Abstract
A novel procedure for data-driven enhancement of informative signal is presented in this paper. The introduced methodology covers decomposition of the signal via time-frequency spectrogram into set of narrowband sub-signals. Furthermore, each of the sub-signals is considered as a sample of independent identically distributed random variables and we model the distribution of the sample, in contrast to the classical methodology where the simple statistics, for example kurtosis, for each sub-signal was calculated. This approach provides a new perspective in the signal processing techniques for local damage detection. Using our methodology one can eliminate potential risk related to high sensitivity towards single outlier. In the proposed procedure we model each sub-signal in time-frequency representation by α-stable distribution. This distribution is a generalization of standard Gaussian one and allows us for modeling sub-signals related to both informative and non-informative frequencies. As a result, we obtain distribution of stability parameter vs. frequencies that is analogy to spectral kurtosis approach well known in the literature. Such characteristic is basis for filter design used for raw signal enhancement. To evaluate efficiency of our method we compare raw and filtered signal in time, time-frequency and frequency (envelope spectrum) domains. Moreover, we present comparison to the spectral kurtosis approach. The presented methodology we applied to simulated signal and real vibration signal from two stage heavy duty gearbox used in mining industry.
1. Introduction
Problem of the local damage detection in heavy duty machines is currently one of the most investigated in the condition monitoring [1-3]. Methods used in this field are based on the different approaches. For example, one can use methods taking into account synchronous averaging [4], advanced signal filtering based on adaptive filters [5-9], AR model-based filter [10], Shur filter [11, 12] or several signal decompositions: by filter banks, wavelets or EMD [13-25]. Optimization of the filtering procedure might be done in time domain (maximizing kurtosis of the signal [13, 15, 16] or frequency domain (maximizing kurtosis or other statistical features for narrow frequency band [26, 27] or maximizing envelope spectrum results) [28, 29]. Several interesting review papers can be found in literature, for example [30, 31].
Another very promising approach is based on the cyclostationary behavior of the vibration signal [32-34]. However, signal acquired from the industrial machines is often non-stationary and has very complex structure, especially when we consider the faulty case, so to hottest direction in this field is cyclo-non-stationarity of the signal [35].
Due to complexity of structure of the signal, in the literature for many proposed methods of local damage detection the signal is decomposed first, next analysed/modelled and finally processed in order to extract the informative part of the signal [3, 11, 12, 21-23, 27, 36]. Most of the methods of informative frequency band identification are based on the fact that time series from the faulty machine contained in the mentioned informative frequency band has impulsive or cyclostationary character. To quantify the value of the informativeness of such part measures of the impulsivity/cyclostationarity were introduced. Here we mention only few of them, like methods concerning empirical moments, quantiles, cumulative distribution function, stochastic modelling techniques detection of local maxima, indicators of cyclostationarity or generalized detectors of modulation intensity [3, 11-13, 16, 20, 21-23, 26-29, 31, 32, 36-38].
In this paper we propose a method of selection of informative frequency band and local damage detection that is based on the enhancement of noisy vibration signal using -stable distribution approach [3, 39]. More precisely, we estimate the stability index for each sub-signal from time-frequency representation taking into account the assumption that it can be modelled by using -stable distribution which is an extension of the classical Gaussian one [40, 41]. In our approach we obtain distribution of the stability index versus frequency that provides similar picture as spectral kurtosis well known in the literature. In this paper we will provide a comparison of a new method and the spectral kurtosis-based one. On the basis of the obtained characteristic (namely the stability index) we can design the filter in order to enhance of the raw signal. To evaluate efficiency of our method we analyze the raw filtered signal in time, time-frequency and frequency (envelope spectrum) domains. The presented methodology we apply to the simulated as well as to real vibration signal from two stage heavy duty gearbox used in mining industry.
The paper is organized as follows. In Section 2 we present in details methodology related to -stable distribution modelling and procedure of filter design based on this approach. In Section 3 we analyse the simulated vibration signal in the context of the presented methodology. Fourth section presents the results for real vibration signal from the two-stage gearbox. Last section contains conclusions.
2. Theoretical background
In this section we present the procedure of extraction of informative part of vibration signal as well as the filtration technique based on it. We introduce here a novel technique that allows us to extract informative frequency band in order to detect the local damage. It is worth mentioning that by using our approach the informative frequency band will be extracted through data driven algorithm and it allows for automated local damage detection.
Our method extends the classical methodology based on the spectral kurtosis [26]. Instead of calculating the statistics (kurtosis) for each sub-signal from time-frequency representation we propose to model each of the sub-signals by using the general distribution, which can be appropriate for both types of sub-signals, namely related to informative frequency band as well as not related to it. One of the possible distributions is the -stable one which is an extension of the Gaussian approach. Furthermore, it is worth mentioning that -stable distribution is frequently used for modeling of data with visible peaks/jumps, however for specific values of the stability parameter it reduces to the Gaussian one. Modeling of the sub-signals from the time-frequency representation results in the distribution of the stability index with respect to the frequencies. Such characteristic can be used as a basis for the filter design for raw signal enhancement.
In the first step of the introduced method the raw signal is transformed into time-frequency map through the short-time Fourier transform (STFT) [42]:
where is the shifted window and is the input signal. Each sub-signal corresponding to appropriate frequencies can be considered as a time series. Since the STFT matrix is complex, absolute value needs to be taken in order to obtain the spectrogram. In the proposed procedure we assume the sub-signals corresponding to appropriate frequencies constitute samples from -stable distribution. This is related to the fact that for sub-signals with impulsive behavior (i.e. related to informative frequency band) the stability parameter tends to be lower than for sub-signals without impulses and hence the parameter can be treated as a selector for informative frequency band detection. We mention, a random variable is an -stable distributed if its characteristic function takes the following form [43]:
where is stability parameter, is asymmetry parameter, is scale parameter and is location parameter.
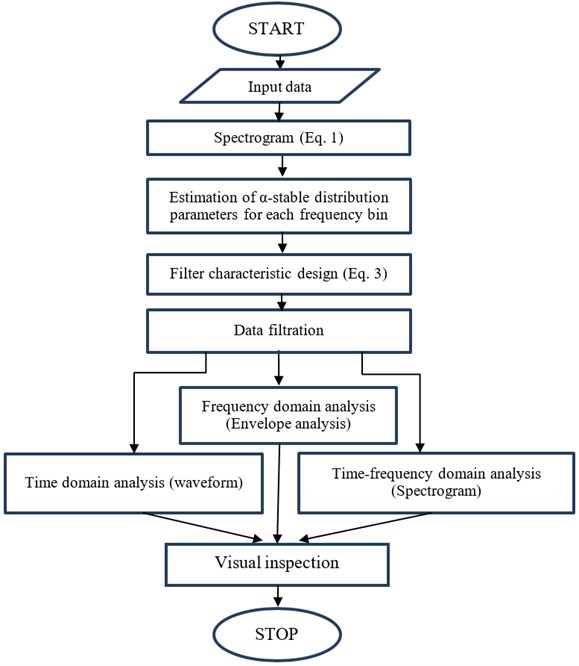
Fig. 1Flowchart of the procedure
In this paper we apply the regression method which is based on the characteristic function of the considered distribution (see Eq. (2)). After modeling of appropriate sub-signals by using stable distribution we obtain a set of parameters corresponding to frequencies. Next, we can design the filter. The filter, called later the -filter, is defined as follows:
where is the estimated parameter for sub-signal corresponding to frequency . At the end the signal is filtered and its main characteristic is analyzed. In Fig. 1 we present the flowchart of the procedure.
As it was mentioned, in this paper we compare the results obtained by using the introduced methodology with the classical approach based on the spectral kurtosis. In the classical method for each time series corresponding to given frequencies in time-frequency representation (spectrogram) the statistic called kurtosis is calculated. We should mention, the kurtosis is often considered as the measure of impulsiveness and therefore it is justifiable to use it in the informative frequency band selection problem. The empirical kurtosis for vector of observations , ,…, has the following form:
Instead of the kurtosis the other statistics (selectors) can be calculated in order to find the informative frequency band. We only mention here two of them like the Jacque-Berra or Kolmogorov-Smirnov statistics, [27]. The mentioned selectors are constructed under the assumption that the distribution of sub-signal corresponding to healthy condition should be closer to Gaussian in comparison to distribution of sub-signal corresponding to damaged one. An approach proposed here is more appropriate from theoretical point of view. As it was mentioned, we apply here a distribution which is appropriate to sub-signals corresponding to the informative part as well as non-informative one [3].
3. Simulated data analysis
In this section we will analyze simulated signal. Vibration signal was created with the method presented in [44]. Using magnitude of the impacts, time-varying structural impulse response and band-pass filter we obtained simulated vibrational signal. The investigated signal parameters are: frequency sampling 16384 Hz and 2.5 s length of the signal. The parameters of the spectrogram are: Kaiser window of length 500, number of overlapping samples being 475, number of samples used for FFT equal to 512, and frequency sampling as was mentioned. It can be seen that there exists cyclic damage. Moreover, there is also visible single impulse (artifact). Observing spectrogram, it reveals IFB around 4 kHz, high energy – low frequency band and low energy – high frequency band. Fault frequency is located at 16.5 Hz.
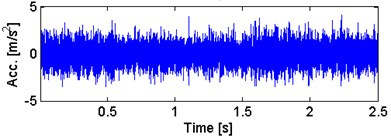
Fig. 2a) Waveform of the simulated signal with b) its envelope spectra
a)
b)
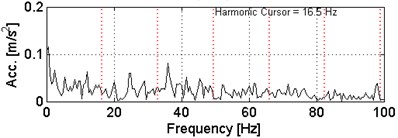
Fig. 3Spectrogram of the simulated signal
In Fig. 2 there are presented both time waveform of the simulated signal and its envelope spectrum. It can be noticed that in time waveform impulses are not clearly visible. In Fig. 2(b) one can observe different components in frequency representation. Impulses related to the damage have the fundamental frequency of 16.5 Hz. Combining both representations one cannot detect the damage. This is the motivation for the application of the novel method that allows enhancement of the signal.
There is presented spectrogram of the simulated signal in Fig. 3. One can denote visible differences in the time-frequency structure. In 0-1,5 kHz high energy component is observable. Around 4 kHz structure reveals optimal frequency band containing information about fault related impulses. Furthermore, there is artifact present around 1 s with wideband range in frequencies.
Fig. 4Filter characteristic based on the α-stable approach for simulated signal

a) parameter
b) filter characteristic
Fig. 5a) Waveform of the α-filtered signal with b) its envelope spectra
a)
b)
Fig. 6Spectrogram of the α-filtered signal
In Fig. 4, there is presented the α-filter characteristic and values of stability parameter versus frequency. We can observe that for sub-signals coming from non-informative band, meaning from band containing no information about fault, the value of stability parameter is close to 2, where value of the filter characteristic would close to 0. We mention the stability index close to 2 means the analyzed time series can be considered as Gaussian distributed sample. According to the presented methodology at the final step we filter the signal by applying -filter characteristic. Fig. 5 contains the filtered signal in time domain and envelope spectra. It can be denoted that the damage can be better observable in time domain in comparison to signal before filtration, as well as in envelope spectra. The fundamental frequency with transparent location of its harmonics is observable in Fig. 5(b). In Fig. 6 we show a time-frequency map of the signal after performing filtration. One can easily notice significant increase in visibility for the impulses related to the fault and attenuation of 0-1 kHz frequency band.
As a comparison we apply the spectral kurtosis filtration to the simulated signal presented in Fig. 2. It can be seen that spectral kurtosis filter characteristic presented in Fig. 7 does not recognize the informative frequency band and wide-band impulse (artifact) causes the spectral kurtosis’ significant increase over multiple frequency bands.
Fig. 7Filter characteristic based on the spectral kurtosis approach for simulated signal
In Fig. 8(a) we observe that in time domain artificial impulse is strongly enhanced, damage detection is impossible for extracted signal. Furthermore, it can be seen Fig. 8(b) that envelope spectrum does not provide any information about fundamental frequency of the fault with lack of the fundamental frequency or its harmonics.
In Fig. 9 we see that applying filter characteristic based on the spectral kurtosis causes enhancement of wide-band impulse instead of enhancing the fault-related impulses. Additionally, it provides obsolete noise in the high-frequency band, while informative frequency band magnitude is significantly decreased.
Fig. 8a) Waveform of the SK-filtered signal with b) its envelope spectra
a)
b)
Fig. 9Spectrogram of the SK-filtered signal
4. Real data analysis
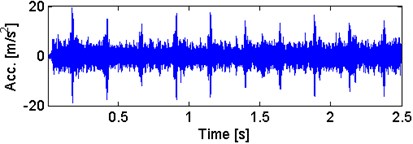
To prove efficiency of the proposed method we apply it also to the real vibration signal from complex machine operating in the harsh environment in mining industry. Measurements have been performed using Bruel-Kjaer Pulse system with parameters of data acquisition as follows: length of the signal 2.5 s, sampling frequency equal to 8192 Hz and expected fault frequency equal to 4.1 Hz. The signals were acquired using an accelerometer located on the gearbox housing in horizontal direction. The machine was normally loaded and the rotational speed was approximately constant during the data acquisition (Fig. 10).
Fig. 10a) Scheme of the investigated machinery, b) sensor location in gearbox case
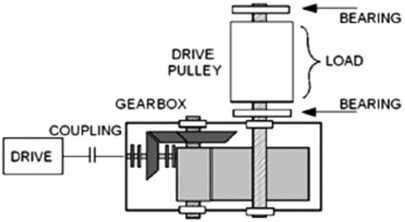
a)
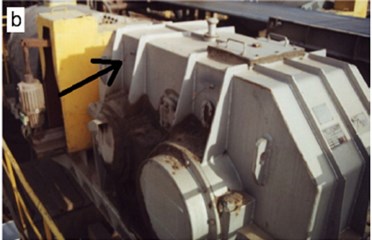
b)
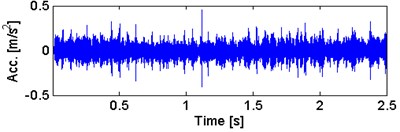
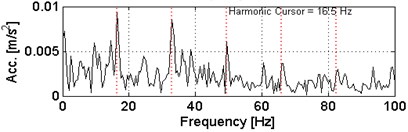
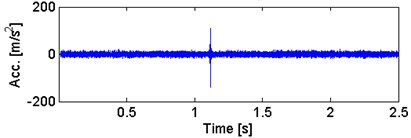
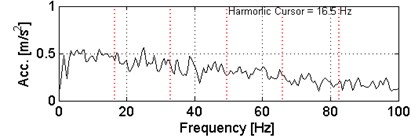
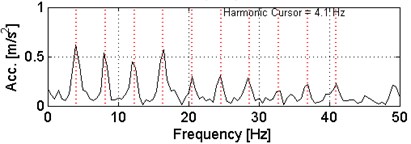
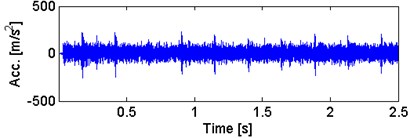
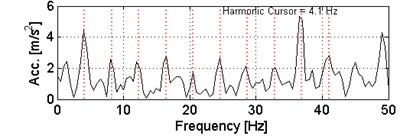
Fig. 11a) Waveform of the acquired signal with b) its envelope spectra
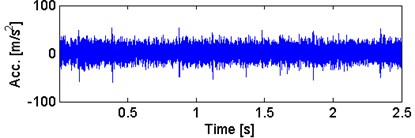
a)
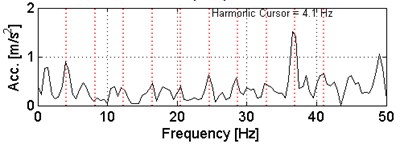
b)
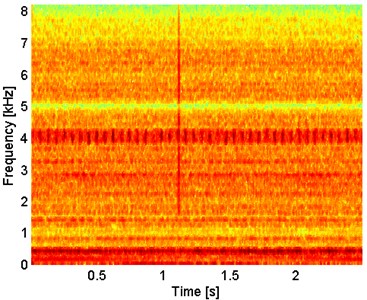
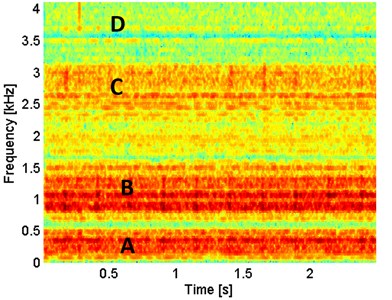
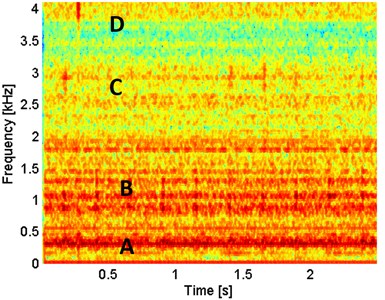
Fig. 12Spectrogram of the acquired signal
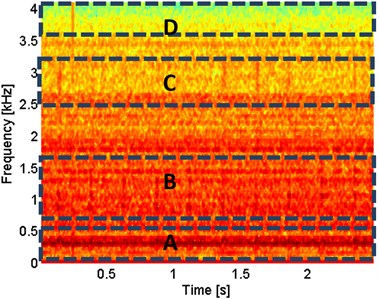
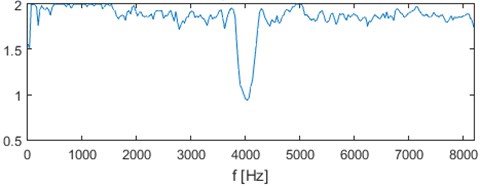
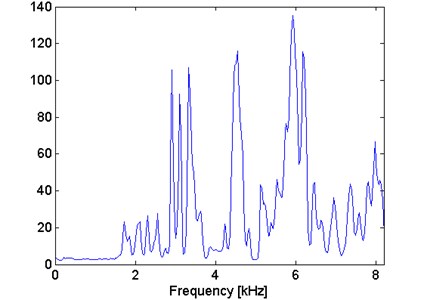
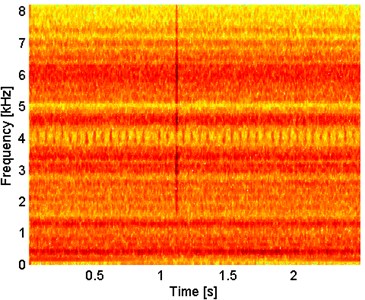
In Fig. 11(a) the acquired vibration signal from the two-stage gearbox is presented in time domain. One can notice impulses, but it cannot be concluded that they come from the damage. Furthermore, in Fig. 11(b) we present the envelope spectra of the signal. After performing visual inspection of the examined gearbox, it was found that damage is localized on the tooth in gear-wheel mounted on second (middle) shaft in the gearbox. Damage frequency is calculated with the machine kinematics and localized at 4.1 Hz. As one can see, it is hard to find harmonics of the fundamental frequency at envelope spectra of raw signal. This is the main reason to apply methodology for the enhancement of the impulses related to the fault. In Fig. 12 spectrogram of the acquired signal is presented. We cannot easily select the informative frequency band. However, there were preliminary determined four frequency bands containing possible information which are confirmed in Fig. 13 containing -filter characteristic. Band A contains high energy component, band B contains impulses but with low signal to noise ratio, in band C one can detect few impulses but with no visible cyclicity of the impulses and finally in band D artifact related to the error during signal acquisition is placed. High energy and multiple impulses located in bands B and C provide that related informative frequency band selector is significantly higher in these bands. Furthermore, high energy of the artifact in band D results in increased value of the selector in this band. Lastly, band A contains high energy component and results in uneven behavior of the selector in this frequency band.
Fig. 13Filter characteristic based on the α-stable approach for real signal
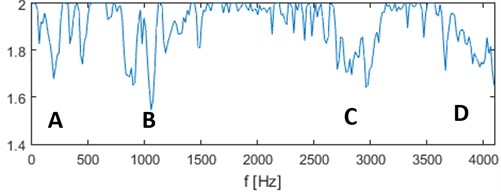
a) parameter
b) filter characteristic
Fig. 14 contains the filtered signal in time domain and envelope spectra. It can be denoted that the damage can be observable in time domain (visible cyclic impulses) as well as in envelope spectra. The fundamental frequency with transparent location of its harmonics we observe in Fig. 14(b).
In Fig. 15 we present a time-frequency decomposition – spectrogram of the signal after performing -filtration. One can easily notice significant visibility for the impulses related to the fault resulting in increase of visibility in band B and C. Additionally, we observe attenuation of band A and D, where in band A there is observable reduction of the high energy component.
Fig. 14a) Waveform of the α-filtered signal with b) its envelope spectra
a)
b)
Fig. 15Spectrogram of the α-filtered signal
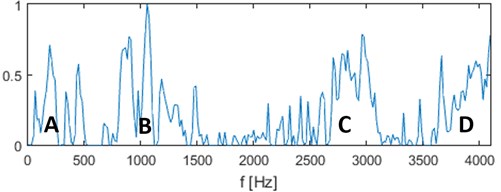
In Fig. 16 we see characteristic for the spectral kurtosis filter. It can be observed that in comparison to Fig. 13, value of the characteristic for the high frequency band D is very high. It is caused by spectral kurtosis as a statistic being highly sensitive towards single sample with high magnitude. Furthermore, spectral kurtosis detects informative frequency bands A, B and C but compared to the -filtration it does not provide as clear information. In Fig. 18 spectrogram of filtered signal (after application of spectral kurtosis approach) is presented. It can be observed that additional noise was added in high-frequency band D. Impulses being highly visible in spectrogram after -filtration in 1 kHz band B are presented here with lower energy. Bands A and C do not contain important information after spectral kurtosis filtration. In Fig. 17 there are presented time waveform for the filtered signal and envelope spectrum after application of spectral kurtosis approach. Subsequently, compared to the -filtration, impulses in time-domain have lower energy resulting in lower signal to noise ratio. On the envelope spectrum, we observe fundamental fault frequency and its harmonics, but not as clearly as by application of the novel method based on -stable distribution.
Fig. 16Filter characteristic based on the spectral kurtosis approach for real signal
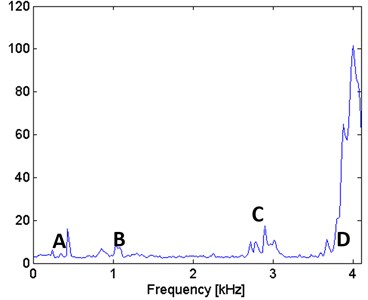
Fig. 17a) Waveform of the spectral kurtosis filtered signal with b) its envelope spectra
a)
b)
Fig. 18Spectrogram of the α-filtered signal
5. Conclusions
In this paper a novel method for filtering vibration signals is proposed. The filtering procedure was developed in order to enhance the raw vibration signal, i.e. improve its signal to noise ratio. The algorithm is based on the fundamental property of the informative part of the signal, meaning impulsivity in the certain frequency bands providing information about possible faulty state of the machine. The main difficulty in the modern analysis of the signal is identification of given band. Most of the novel methods are based on the statistical properties of the signal which is highly sensitive towards single impulses observable in the signal. Proposed method is based on the fitting of the distribution towards sub-signals coming from the frequency bands in the time-frequency decomposed signal. Fitted distribution, in this case -stable one, is a generalization of the Gaussian distribution. It allows for the modeling of both, informative and non-informative frequency bands. Moreover, as a distribution it is less sensitive towards single samples with high energy, for example artifacts.
In the case of machine in the healthy condition, distribution of signal (and consequently each sub-signal for given frequency band) is close to the Gaussian which is particular case of the -stable distribution with parameter close to 2. For machines in the bad condition, impulsivity in the signal will affect many frequency bands (energy flow in these bands will reveal impulsive character, too). In consequence, stability parameter will become significantly smaller than 2. Distribution of parameter with respect to frequency allows us to indicate so called informative frequency band and might be used as filter characteristic.
Simulation results proved that new method is highly effective with high insensitivity towards single high-energy wideband impulse when searching for the informative frequency band. Additionally, it gives us the ability to strongly enhance time waveform, frequency spectrum and time-frequency representation when analyzing impulsive data. Application of the method for real vibration signals proved that both in time domain as well as in envelope spectrum signal reveals much clearly presence of damage. After filtering cyclic impulses are more visible in time domain. Also in envelope spectrum one might notice fundamental frequency together with family of harmonics that is clear signature of local damage in gearbox.
Furthermore, spectral kurtosis filtration, as the classical one, is performed as a method of comparison. It can be observed that classical method has lower accuracy, especially in case of impulse with high energy present in multiple frequency bands. Such cases are often encountered in industry, as signals are contaminated with environmental noise. Therefore, it is essential to use more advanced methods to signals from industry machines.
References
-
Zimroz R. Role of signal preprocessing in local damage detection in mining machines. Diagnostyka, Vol. 2, Issue 46, 2008, p. 33-36.
-
Obuchowski J., Wyłomańska A., Zimroz R. Recent developments in vibration based diagnostics of gear and bearings used in belt conveyors. Applied Mechanics and Materials, Vol. 683, 2014, p. 171-176.
-
Burdzik R., Konieczny Ł., Folęga P. Structural health monitoring of rotating machines in manufacturing processes by vibration methods. Advanced Materials Research, Vol. 1036, 2014, p. 642-647.
-
Braun S. The synchronous (time domain) average revisited. Mechanical Systems and Signal Processing, Vol. 25, Issue 4, 2011, p. 1087-1102.
-
Chaturvedi G. K., Thomas D. W. Adaptive noise cancelling and condition monitoring. Journal of Sound and Vibration, Vol. 76, Issue 3, 1981, p. 391-405.
-
Lee S. K., White P. R. The enhancement of impulsive noise and vibration signals for fault detection in rotating and reciprocating machinery. Journal of Sound and Vibration, Vol. 217, Issue 3, 1998, p. 485-505.
-
Khemili I., Chuchane M. Detection of rolling element bearing defects by adaptive filtering. European Journal of Mechanics A/Solids, Vol. 24, 2005, p. 293-303.
-
Barszcz T. Decomposition of vibration signals into deterministic and nondeterministic components and its capabilities of fault detection and identification. International Journal of Applied Mathematics and Computer Science, Vol. 19, Issue 2, 2009, p. 327-335.
-
Zimroz R., Bartelmus W. Application of adaptive filtering for weak impulsive signal recovery for bearings local damage detection in complex mining mechanical systems working under condition of varying load. Solid State Phenomena, Vol. 180, 2012, p. 250-257.
-
Obuchowski J., Wyłomańska A., Zimroz R. Two-stage data driven filtering for local damage detection in presence of time varying signal to noise ratio. Mechanisms and Machine Science, Vol. 23, 2015, p. 401-410.
-
Makowski R. A., Zimroz R. Adaptive Bearings Vibration Modelling for Diagnosis. Lecture Notes in Computer Science (including subseries Lecture Notes in Artificial Intelligence and Lecture Notes in Bioinformatics) 6943 LNAI, 2011, p. 248-259.
-
Makowski R., Zimroz R. New techniques of local damage detection in machinery based on stochastic modelling using adaptive Schur filter. Applied Acoustics, Vol. 77, 2014, p. 130-137.
-
Antoni J. Fast computation of the kurtogram for the detection of transient faults. Mechanical Systems and Signal Processing, Vol. 21, Issue 1, 2007, p. 108-124.
-
Lei Y., Lin J., He Z., Zuo M. J. A review on empirical mode decomposition in fault diagnosis of rotating machinery. Mechanical Systems and Signal Processing, Vol. 35, Issues 1-2, 2013, p. 108-126.
-
Dybała J., Zimroz R. Rolling bearing diagnosing method based on empirical mode decomposition of machine vibration signal. Applied Acoustics, Vol. 77, 2014, p. 195-203.
-
Lin J., Zuo M. J. Gearbox fault diagnosis using adaptive wavelet filter. Mechanical Systems and Signal Processing, Vol. 17, Issue 6, 2003, p. 1259-1269.
-
Peng Z. K., Chu F. L. Application of the wavelet transform in machine condition monitoring and fault diagnostics: a review with bibliography. Mechanical Systems and Signal Processing, Vol. 18, Issue 2, 2004, p. 199-221.
-
Yan R., Gao R. X., Chen X. Wavelets for fault diagnosis of rotary machines: a review with applications. Signal Processing, Vol. 96A, 2014, p. 1-15.
-
Feng Z., Liang M., Chu F. Recent advances in time-frequency analysis methods for machinery fault diagnosis: a review with application examples. Mechanical Systems and Signal Processing, Vol. 38, Issue 1, 2013, p. 165-205.
-
Urbanek J., Barszcz T., Antoni J. Time-frequency approach to extraction of selected second-order cyclostationary vibration components for varying operational conditions. Measurement, Vol. 46, Issue 4, 2013, p. 1454-1463.
-
Makowski R., Zimroz R. Parametric time-frequency map and its processing for local damage detection in rotating machinery. Key Engineering Materials, Vol. 588, 2014, p. 214-222.
-
Żak G., Obuchowski J., Wyłomańska A., Zimroz R. Novel 2D representation of vibration for local damage detection. Mining Science Vol. 21, 2014, p. 105-113.
-
Obuchowski J., Wyłomańska A., Zimroz R. The local maxima method for enhancement of time-frequency map and its application to local damage detection in rotating machines. Mechanical Systems and Signal Processing, Vol. 46, Issue 2, 2014, p. 389-405.
-
Tse P. W., Wang D. The design of a new sparsogram for fast bearing fault diagnosis: part 1 of the two related manuscripts that have a joint title as “two automatic vibration-based fault diagnostic methods using the novel sparsity measurement – parts 1 and 2”. Mechanical Systems and Signal Processing, Vol. 40, Issue 2, 2013, p. 499-519.
-
Tse P. W., Wang D. The automatic selection of an optimal wavelet filter and its enhancement by the new sparsogram for bearing fault detection: part 2 of the two related manuscripts that have a joint title as “two automatic vibration-based fault diagnostic methods using the novel sparsity measurement – parts 1 and 2”. Mechanical Systems and Signal Processing, Vol. 40, Issue 2, 2013, p. 520-544.
-
Antoni J., Randall R. B. The spectral kurtosis: application to the vibratory surveillance and diagnostics of rotating machines. Mechanical Systems and Signal Processing, Vol. 20, Issue 2, 2006, p. 308-331.
-
Obuchowski J., Wyłomańska A., Zimroz R. Selection of informative frequency band in local damage detection in rotating machinery. Mechanical Systems and Signal Processing, Vol. 48, Issues 1-2, 2014, p. 138-152.
-
Li C., et al. Criterion fusion for spectral segmentation and its application to optimal demodulation of bearing vibration signals. Mechanical Systems and Signal Processing, Vol. 64, Issue 65, 2015, p. 132-148.
-
BarszczT.,JabłońskiA. A novel method for the optimal band selection for vibration signal demodulation and comparison with the Kurtogram. Mechanical Systems and Signal Processing, Vol. 25, Issue 1, 2011, p. 431-451.
-
Samuel P. D., Pines D. J. A review of vibration-based techniques for helicopter transmission diagnostics. Journal of Sound and Vibration, Vol. 282, Issues 1-2, 2005, p. 475-508.
-
Randall R. B., Antoni J. Rolling element bearing diagnostics – a tutorial. Mechanical Systems and Signal Processing, Vol. 25, Issue 2, 2011, p. 485-520.
-
Raad A., Antoni J., Sidahmed M. Indicators of cyclostationarity: theory and application to gear fault monitoring. Mechanical Systems and Signal Processing, Vol. 22, Issue 3, 2008, p. 574-587.
-
Antoni J. Cyclostationarity by examples. Mechanical Systems and Signal Processing, Vol. 23, Issue 4, 2009, p. 987-1036.
-
Urbanek J., Antoni J., Barszcz T. Detection of signal component modulations using modulation intensity distribution. Mechanical Systems and Signal Processing, Vol. 28, 2012, p. 399-413.
-
Abboud D., Antoni J., Sieg-Zieba S., Eltabach M. Deterministic-random separation in nonstationary regime. Journal of Sound and Vibration, Vol. 362, 2016, p. 305-326.
-
Obuchowski J., Wyłomańska A., Zimroz R. Stochastic modeling of time series with application to local damage detection in rotating machinery. Key Engineering Materials, Vol. 569, 2013, p. 441-449.
-
Yu G., Li C., Zhang J. A new statistical modeling and detection method for rolling element bearing faults based on alpha-stable distribution. Mechanical Systems and Signal Processing, Vol. 41, Issues 1-2, 2013, p. 155-175.
-
Żak G., Obuchowski J., Wyłomańska A., Zimroz R. Application of ARMA modelling and alpha-stable distribution for local damage detection in bearings. Diagnostyka, Vol. 15, Issue 3, 2014, p. 3-10.
-
Burnecki K., Wyłomańska A., Beletskii A., Gonchar V., Chechkin A. Recognition of stable distribution with Levy index alpha close to 2. Physical Review E, Vol. 85, 2012, p. 056711.
-
Wyłomańska A., Zimroz R., Janczura J. Identification and stochastic modelling of sources in copper ore crusher vibrations. Journal of Physics: Conference Series, Vol. 628, 2015, p. 012125
-
Wyłomańska A., Chechkin A., Sokolov I. M., Gajda J. Codifference as a practical tool to measure interdependence. Physica A, Vol. 421, 2015, p. 412-429.
-
Allen J. B. Short term spectral analysis, synthesis, and modification by discrete Fourier transform. IEEE Transactions on Acoustics, Speech and Signal Processing, Vol. 25, Issue 3, 1977, p. 235-238.
-
Samorodnitsky G., Taqqu M. S. Stable Non-Gaussian Random Processes. Chapman and Hall, New York, 1994.
-
Antoni J., Randall R. B. A stochastic model for simulation and diagnostics of rolling element bearings with localized faults. Journal of Vibration and Acoustics, Vol. 125, Issue 3, 2003, p. 282-289.
Cited by
About this article

Authors would like to acknowledge Jakub Obuchowski for his help related to model of the signal. This work is partially supported by the Statutory Grant S50112 (Radosław Zimroz) and S50112 (Grzegorz Żak).
