Abstract
Low strain detection, an indirect and nondestructive testing method, is one of the main pile integrity testing methods. We propose low strain testing analysis based on a synchrosqueezing wavelet transformation (SST). Through a typical model pile test, the SST is applied to identify pile bottom signal reflection time and to separate signal from noise. It is also compared with the conventional wavelet de-noising and the empirical mode decomposition (EMD) de-noising method. Results show that the SST technique can be used to identify the reflected signal of the pile bottom, achieve signal and noise separation, and improve signal-to-noise ratio. The method has significant advantage in low strain detection signal processing compared to other methods.
1. Introduction
Wavelet analysis is an emerging signal processing tool, and it has been extensively used in structural integrity assessment and damage detection [1-5]. In the aspect of structural integrity assessment, wavelet analysis has been applied to quality evaluation of pile foundation. Pile foundation is an important part of a deep foundation. The quality of a pile foundation is related directly to the safety of a project [6]. Thus, pile testing is an essential part of a pile foundation project. However, the pile is usually hidden underground or under water. Low strain testing, which is an indirect non-destructive technique, is a primary pile integrity testing method [7-10]. Low strain testing involves back analysis of elastic wave propagation and changing the degree of frequency of a spectrum is closely related to the internal structure of a pile. Wavelet analysis includes a multi-resolution function; thus, both the frequency and the time domain ensure a constant quality factor. Wavelet transformation has been used to analyze signals of pile dynamic testing and obtain specific effects [11-14]. In low strain testing, the wavelet can de-noise through the frequency domain filter to eliminate noise and reconstruct the signal, thereby obtaining a high signal-to-noise ratio (SNR). Wavelet transform results also vary in different mother function analyses. To obtain the best signal analysis results, the effects of the analysis results with different mother functions are compared, such as stress wave detection for less obvious damage of pile. Cao et al. proposed Shannon entropy measurement to determine the optimal mother wavelet [15]. Daubechies recently proposed a synchro squeezing wavelet transformation (SST) based on a continuous wavelet transform. In SST, wavelet coefficients are squeezed in a time-frequency domain. A SST algorithm obtains an instantaneous frequency even if a function is nonharmonic [16-18]. The proposed technique has been introduced for use in signal time-frequency analysis in seismic exploration, machinery diagnostics, bioinformatics, and other areas [19-22]. By comparing the results with other time–frequency analysis methods, the SST algorithm can increase the accuracy of analysis; the selection of the mother wavelet has no significant effect on the results of the analysis. For example, Herrera et al. used SST for time-frequency analysis of seismic data and compared the results with those from the complementary ensemble empirical mode decomposition (CEEMD) method [23]. Even in complex situations, SST can also identify the instantaneous frequency of seismic signals. In concrete ultrasonic testing, Avanesians and Momayez proposed using the SST to reconstruct ultrasonic signals within a certain frequency range, as it could accurately obtain the initial time of the reflected signal [24]. In the diagnosis of structural health, Ren and his colleagues applied the SST to recognize the time change of damage in simply supported beams [25-28]. Their results showed that the method could effectively identify the damage in the structure. Thakur et al. also applied the SST to paleoclimate analysis in geographical research [29]. The authors demonstrated specific implementation processes in practical analyses. Studies have shown that the SST method has high robustness and resolution. Li and Liang proposed a generalized synchrosqueezing transform (GST) based on SST theory, which is used in machinery fault diagnosis [30]. Their experimental results showed that the GST could effectively monitor the working condition of a gearbox. In biological signal analysis, Yi-Hsin et al. used the SST to estimate the instantaneous frequency of electrocardiogram (ECG) signals. Their research showed that instantaneous frequency error was small [31]. The foregoing studies demonstrate that the use of the SST algorithm for processing low strain testing signals, analyzing time–frequency characteristics, and studying the effects of low strain testing signal processing significantly influence the signal level of low strain pile testing.
In this study, low strain testing and SST theory are first introduced. Then, the SST is used in signal processing of low strain pile testing. The SST is used to process the detection signal in a pile model experiment. The pile bottom reflection time is identified in accordance with its time-frequency characteristics. Finally, the SST algorithm is used to process a signal with a strong noise background to test its de-noising ability.
2. Methodology and theory
2.1. Low strain testing
Generally, the length of a pile is greater than its width. In low strain conditions, a pile can be simplified to a one-dimensional elastic body. When the impact load is on top of the pile, the pile body produces stress waves (Fig. 1) and its propagation characteristics conform to a one-dimensional wave equation [32]:
where is displacement, is time, and is the elastic wave velocity.
Fig. 1Low strain testing sketch: A – sensor, T – pile body, S – soil, H – force-hammer; E – signal analysis system
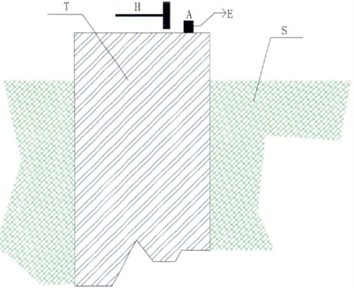
During low strain testing of pile after power hammer excitation, a stress wave is generated and spreads downward in the pile. When the stress wave encounters the wave impedance surface, transmitted and reflected waves appear. The transmission and reflection of energy depend on the wave impedance of two different media, a condition that complies with the law of energy conservation. Wave’s propagation characteristics can be expressed as [33]:
where , are vibration velocity and stress at the interface of the particle respectively; , , are incident waves, reflected waves and refracted waves respectively.
In accordance with Eq. (2), vibration velocity and section stress of the reflected wave can be preliminarily expressed as:
From Eq. (3), the velocity and stress at the particle interface are associated with the reflection coefficient that is determined by the wave impedance that relies on the pile concrete cross-sectional area, velocity, and density. When the interface impedance indicates a great difference in the pile, the reflected signal detected is significant. Thus, the distance between the top and the bottom of the pile can be obtained by:
where is the elastic wave velocity, is the time difference between incident and reflected wave on the pile top.
The wave impedance of internal pile defects or interfaces is different from that of uniform concrete in the pile body. As a result, speed response amplitude and phase changes occur when elastic wave propagation takes place in the pile body. Analysis of the amplitude and speed phase can determine the position of defects and the integrity of the pile body, among other features, for evaluating the pile quality.
2.2. SST theory
The SST algorithm is based on wavelet analysis theory. In this study, is processed by using the following wavelet transform [34]:
where is the scale factor, is the time shift, and is the complex conjugate of the mother wavelet.
In the synchrosqueezing phase, where , the energy is converted from a time-scale plane to a time-frequency plane. The instantaneous frequency of can be preliminarily estimated as [35]:
where is instantaneous frequency.
Then, the synchrosqueezing value of wavelet coefficients is obtained by determining the wavelet coefficients in the central frequency domain:
where is the wavelet synchrosqueezing coefficient.
The time-domain signal can be reconstructed by using SST back-transformation, which is expressed as:
where
When the signal is discrete, the wavelet synchrosqueezing coefficients are expressed as:
where is the central frequency in [, ].
In the same way, the time-domain discrete signal can be reconstructed by using SST back-transformation, which is expressed as:
where , .
3. Model testing
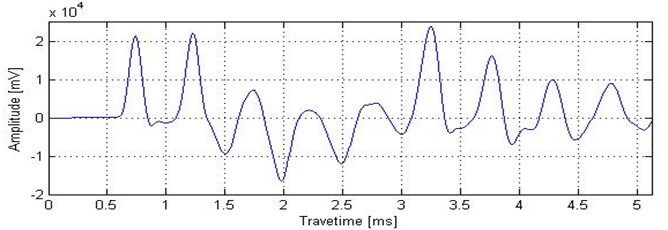
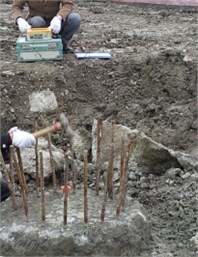
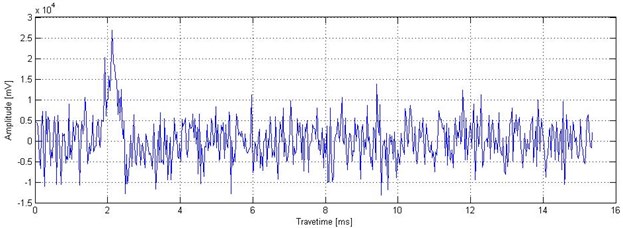
One model pile is tested in the experiment. The total length of the pile is 200 cm, with four sections that measure 40, 20, 40, and 100 cm, respectively. These lengths correspond to the radii 3.5, 2, 2.5, and 3.5 cm (Fig. 2). An RS-W pile dynamic testing instrument is used to test the model pile. The sampling time window and the sampling rates are set to 10.24 ms and 105 s-1, respectively. The sampling signal is shown in Fig. 3.
Fig. 2Model pile sketch (unit: cm)
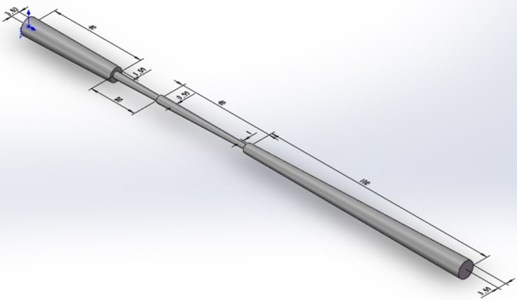
Fig. 3Low strain testing signal
3.1. Signal recognition of the pile bottom reflection
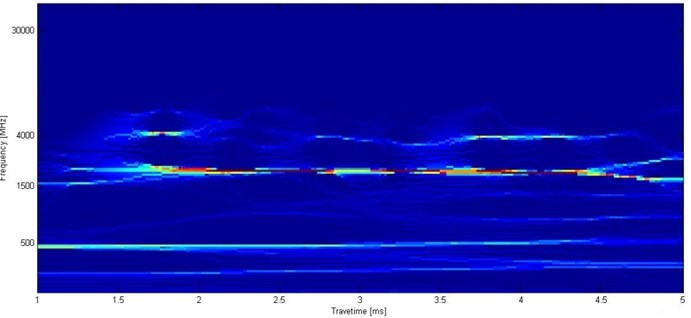
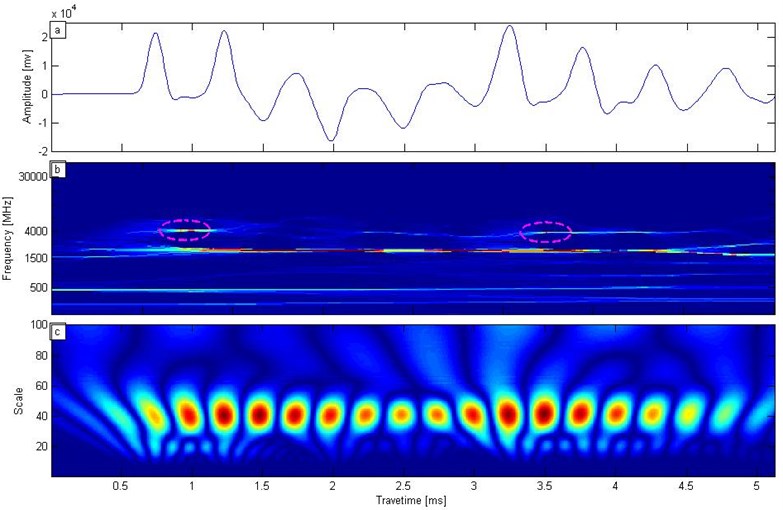
The low strain detection signal in Fig. 3 is transformed with the SST. The instantaneous frequency spectrum is shown in Fig. 4. The results of the analysis show that the signal frequency range is 0 to 6000 MHz. The signal energy in Fig. 4 is concentrated at the low frequency 500 MHz, intermediate frequency 2000 MHz, and high frequency 4000 MHz. For the three characteristic frequencies, the energy is most concentrated near the intermediate frequency 2000 MHz.
Fig. 4Instantaneous frequency spectrum of low strain testing signal with SST
Three frequency bands were taken at 400-600 Hz, 1800-2000 Hz, and 4000-4200 Hz for SST inverse transformation. The signals within the three frequency bands can be reconstructed as shown in Fig. 5.
Fig. 5 shows the reconstructed signal diagram. In Fig. 5(b), the low frequency band signal shows that no reaction interface is evident in the pile and the reflected signal is mainly from the background trend. In Fig. 5(c), the signal energy is concentrated and its peak overlaps with the original signal peak. With higher resolution, the part presents reactions at each interface in the pile. In Fig. 5(d), the high-frequency part shows that different interfaces in the pile have different reactions.
Considering the high-frequency portion as a major research target, we compare it with the continuous wavelet transformation, as shown in Fig. 6. Fig. 6(a) shows several reflection peaks as different reflective interfaces that form multiple peaks about the original signal. If the pile length is known in advance, then the pile bottom reflection peak becomes difficult to recognize. The reflection time of the pile bottom must be determined. SST can be adopted for signal processing and for obtaining time-frequency characteristics. Fig. 6(b) shows the time-frequency contour of the signal after the SST transformation. In the figure, two red ellipse regions show two noticeable features at 4000 Hz; these features correspond to the reflection times of the top and bottom of the pile. Fig. 6(c) shows the scale and wavelet coefficients of a continuous wavelet transform. Fig. 6(c) shows multiple peaks of reactions, but no apparent characteristics are indicated with regard to the reflected signal of the pile bottom.
Fig. 5Reconstructed signal in three frequency bands with SST: a) original signal, b) 400-600 Hz, c) 1800-2000 Hz, d) 4000-4200 Hz
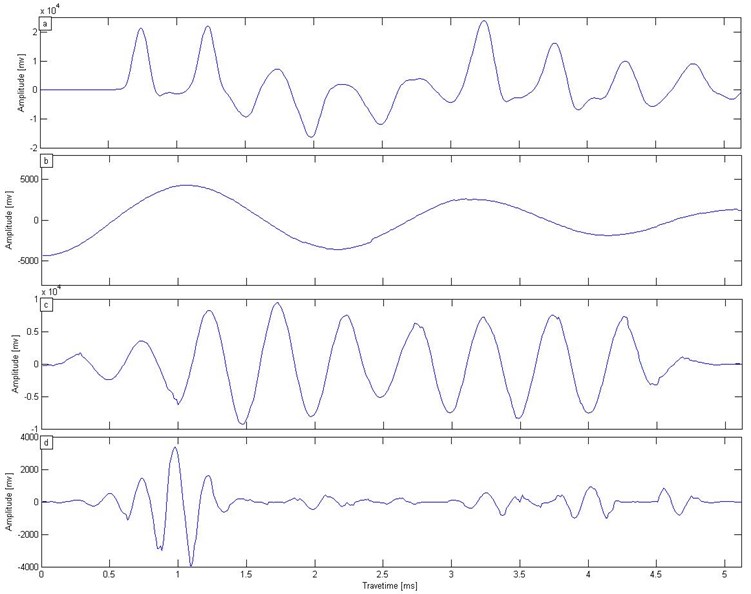
Fig. 6a) Low strain testing signal, b) SST transform, c) wavelet transform
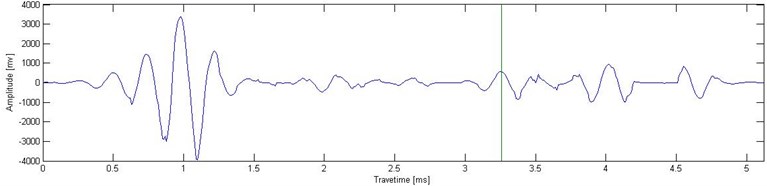
The time-domain signal is reconstructed by using SST back-transformation. In Fig. 7, the reflected signal is reconstructed from 4000 Hz to 4200 Hz, as in Fig. 5(d). The reflected signal of the pile bottom is strengthened, whereas the other reflected signal is suppressed. Reflected wave arrival time from the pile bottom is 3.35 ms, as green horizontal line marked in Fig. 7. The velocity is 1593 m/s and the initial wave time is 0.82 ms. In accordance with Eq. (4), we calculate the pile length as 2 m. The result is consistent with the actual pile length.
Fig. 7Reconstructed low strain testing signal
3.2. Signal and noise separation
With a low strain testing a signal against a strong noise background, the reflection time of wave impedance interface formation becomes difficult to identify. Fig. 8(a) shows the testing signal amplitude in the time domain against a strong noise background. The SST is used for signal and noise separation. In general, the containing noise signal is de-noising data minus the original noiseless data, and the ratio of signal to noise energy is regarded as the signal to noise ratio (SNR). We can use this parameter to measure the de-noising effect. The formula is [36]:
where is SNR, is square norm, is original noiseless data, is containing noise data. In Fig. 7(a), 1.249.
Fig. 8a) Noise interference, b) SST de-noising
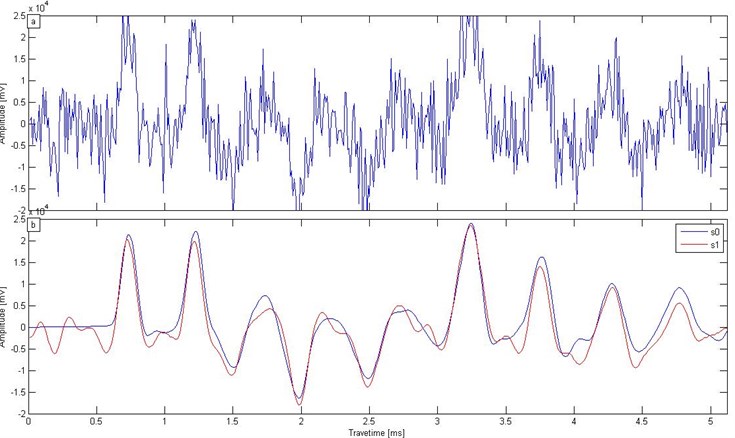
The signal in Fig. 8(a) was processed using low-pass filtering SST. Fig. 6(b) shows the original signal s0 and the processed signal ; these signals have corresponding reflection peaks. The SNR increased from 1.249 (0.964 dB) to 10.796 (10.333 dB), and the SST de-noising effect was considered significant.
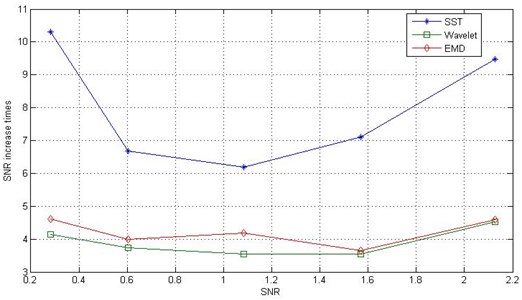
To further study the effects of SST de-noising under different noise levels, we added different levels of random noises to the Fig. 3 data and used the SST method for de-noising, comparing the results with those from EMD and Wavelet threshold. In the process, the EMD method abandons high-frequency components and IMF1 (intrinsic mode function 1) and IMF2 (intrinsic mode function 2), and an adaptive threshold is adopted in Matlab wavelet de-noising. De-noised data can be obtained by all three methods, and SNR is calculated by Eq. (11) in the five noise level. Table 1 shows the effects of the three de-noising methods. From the SNR results in Table 1, the de-noising performance of the SST method is significantly better than that of the other two methods, and EMD and Wavelet threshold have similar effects.
Table 1Low strain testing signal SNR under different noise level
Original signal | SNR after de-noising | ||
EMD | Wavelet | SST | |
2.13 | 9.78 | 9.61 | 20.13 |
1.57 | 5.74 | 5.56 | 11.15 |
1.09 | 4.54 | 3.84 | 6.71 |
0.60 | 2.41 | 2.26 | 4.04 |
0.28 | 1.30 | 1.17 | 2.91 |
According to Table 1, the increase in the times of SNR can be obtained with the three de-noising methods, as shown in Fig. 9. In Fig. 9, the minimum increase in the times of SNR with SST is 6 and the highest value is more than 10. The result shows that the SST has good ability to remove noise. Even in a strong noise background, the SST can significantly improve SNR, and its performance is better than that of the other two methods.
Fig. 9Increase in times with low strain testing signal SNR under different noise levels
3.3. Effect analysis of wavelet basis function
The SST is based on conventional wavelet transformation, during which the wavelet function selection is involved. To study the effect of the wavelet basic function on the results, we selected three types of wavelet (Morlet, Mexican, Bump). Fig. 10 shows the findings of the basic function of the three types of wavelet. In Fig. 10(a)-(c), the squeezing wavelet coefficients in the time-frequency domains are in good agreement with each other. In the SST process for pile with a low strain detection signal, the wavelet basis function has less affects result.
In our study of the de-noising effect of SST with different basis functions, the three wavelet functions are still the research object. In Fig. 11(a), a low strain test signal is under a strong noise background (). We tested the function of the three wavelets for low strain test signal de-noising. The result is shown in Fig. 11(b).
Fig. 10SST with different wavelet basis functions: a) Morlet wavelet, b) Mexican wavelet, c) Bump wavelet
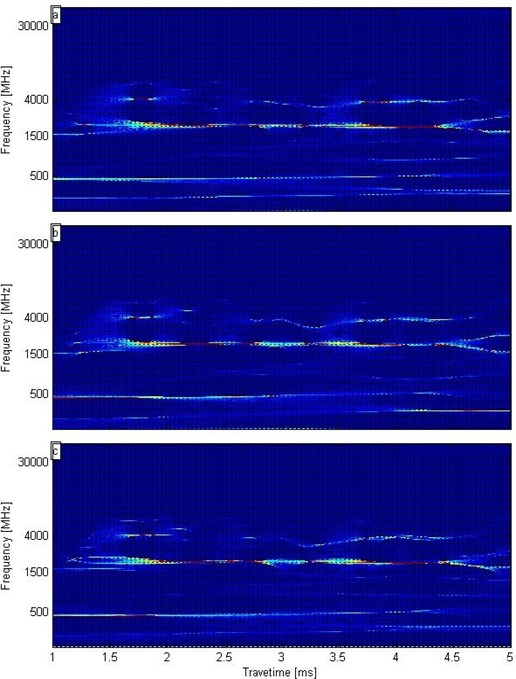
Fig. 11a) Low strain test signal containing strong noise, b) De-noising results with three types of wavelet basis function
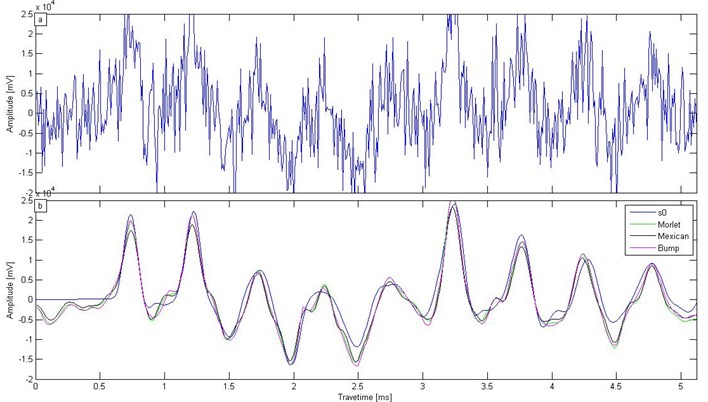
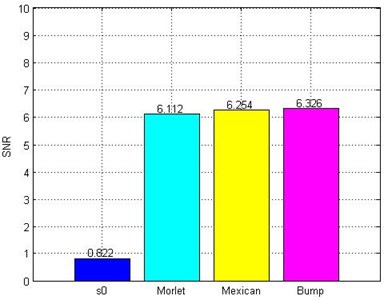
Fig. 11(b) shows that the results from the three different wavelet basis functions are highly consistent with the original signal . The selection of wavelet basis function has little influence on the de-noising effect. From Fig. 11(b), the SNR of the three wavelet basis functions can be obtained according to Eq. (11), as shown in Fig. 12.
As evident in Fig. 12, the change in magnitude of the SNR is at the same level with the three de-noising methods. The original signal SNR increases dramatically. These findings further confirm that the SST has strong de-noising performance and the wavelet basis function selection is not greatly influenced.
Fig. 12SNR with SSTs of different wavelet basis functions
4. Engineering application
In one project involving pile low strain tests, we used the RS-K1616 pile inspection instrument in order to detect pile quality. The test site is shown in Fig. 13(a). In order to verify the SST methods for in actual engineering applications, the practical test data added to strong noise SNR 0.261 (–5.838 dB), and the signal is shown in Fig. 13(b). In the case of strong noise, it is difficult to recognize pile quality.
Fig. 13Pile test in one engineering
a) Pile test site
b) Test signal containing strong noise
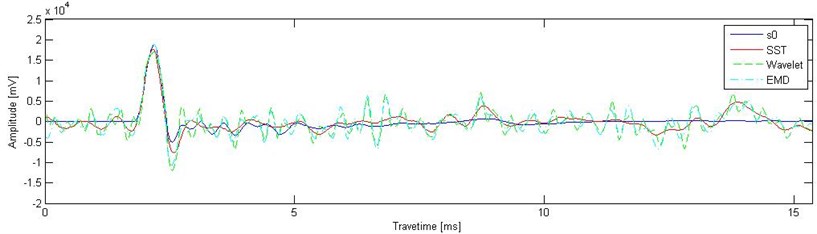
In Fig. 13 (b), three methods (SST, wavelet de-noise, EMD) were adopted for de-noising, and the processing effects of these three methods were compared in practical engineering applications. After being processed, the results shown in Fig. 14 were obtained, and is the original signal in Fig. 13. The results showed that noise was suppressed after using the above three de-noising methods, but the signal that was de-noised with SST was the most approximate to the original signal. Wavelet de-noise and EMD resulted in some de-noising, but their de-noising effects were less than that of the SST method. Based on Eq. (11), the signal SNRs are 3.101 (4.915 dB), 1.229 (0.895 dB), and 1.258 (0.997 dB) after the use of three de-noising methods. The highest SNR is the signal after SST de-noising.
Fig. 14De-noising results with three types of method
5. Conclusions
Low strain pile testing is considered a major dynamic technique for evaluation of pile quality. An SST algorithm is initially introduced into the signal processing of low strain testing. A typical model pile is tested, and an SST algorithm is used to identify the reflection time from a pile bottom and to separate signal from noise. SST is also compared with other methods for low strain pile testing signal. The following conclusions can be drawn:
1) SST can analyze effectively the signal of low strain pile testing in the time-frequency domain;
2) Through SST, the obtained frequency characteristics can be used to recognize the reflected signal of the pile bottom and determine the pile bottom reflection time;
3) SST can suppress strong noise effectively, achieve signal-noise separation, and improve SNR;
4) SST de-noising performance is better than that of traditional methods. The results are not significantly affected by the choice of wavelet function. The SST is an effective time-frequency method for low strain pile testing.
References
-
Messina A. Refinements of damage detection methods based on wavelet analysis of dynamical shapes. International Journal of Solids and Structures, Vol. 45, Issue 14, 2008, p. 4068-4097.
-
Cao M. S., Qiao P. Z., Ren Q. W. Improved hybrid wavelet neural network methodology for time-varying behavior prediction of engineering structures. Neural Computing and Applications, Vol. 18, Issue 7, 2009, p. 821-832.
-
Bai R. B., Cao M. S., Su Z. Q., Ostachowicz W., Xu H. Fractal dimension analysis of higher-order mode shapes for damage identification of beam structures. Mathematical Problems in Engineering, Vol. 12, 2012, p. 454568.
-
Cao M., Xu W., Ostachowicz W., Su Z. Damage identification for beams in noisy conditions based on Teager energy operator-wavelet transform modal curvature. Journal of Sound and Vibration, Vol. 333, Issue 6, 2014, p. 1543-1553.
-
Cao M., Ostachowicz W., Radzieński M., et al. Multiscale shear-strain gradient for detecting delamination in composite laminates. Applied Physics Letters, Vol. 103, Issue 10, 2013, p. 101-110.
-
Poulos H. G. Pile behavior – theory and application. Geotechnique, Vol. 39, 1989, p. 365-415.
-
Jiang J., Liu D. J., Lu Z. T., et al. A study on low strain integrity testing of platform-pile system using staggered grid finite difference method. Soil Dynamics and Earthquake Engineering, Vol. 67, 2014, p. 345-352.
-
Hou Y. B., Zhang F., Liu D. W., et al. Low-strain reflected wave method for identification of typical time-domain signals of foundation piles. Journal of Hohai University, Vol. 35, Issue 4, 2007, p. 413-417.
-
Zheng C., Liu H., Kouretzis G. P., et al. Vertical response of a thin-walled pipe pile embedded in viscoelastic soil to a transient point load with application to low-strain integrity testing. Computers and Geotechnics, Vol. 70, 2015, p. 50-59.
-
Zheng-Yin L. I., Zhai Bang K.-E., Liu D. J., et al. Tests on PHC pipe pile joint quality by low-strain reflected wave method. Chinese Journal of Geotechnical Engineering, Vol. 33, 2011, p. 209-212.
-
Ni S., Isenhower W. M., Huang Y. Continuous wavelet transform technique for low-strain integrity testing of deep drilled shafts. Journal of GeoEngineering, Vol.7, Vol. 3, 2012, p.97-105.
-
Wang F., Liu D., Lu Z. Application of wavelet transform to data processing for low strain test piles. Chinese Journal of Engineering Geophysics, Vol. 8, Issue 4, 2011, p. 487-491.
-
Ni S., Lo K., Lehmann L., et al. Time-frequency analyses of pile-integrity testing using wavelet transform. Computers and Geotechnics. Vol. 35, Issue 4, 2008, p. 600-607.
-
Kijewski T. Wavelet transforms for system identification in civil engineering. Computer-aided Civil and Infrastructure Engineering, Vol. 18, Issue 5, 2003, p. 339-355.
-
Cao M., Liu J., Ren Q. Detection of small damages in foundation piles using optimal base wavelet. Zhendong yu Chongji/Journal of Vibration and Shock, Vol. 25, Issue 3, 2006, p. 155-158.
-
Daubechies I., Lu J., Wu H. Synchrosqueezed wavelet transforms: an empirical mode decomposition-like tool. Applied and Computational Harmonic Analysis, Vol. 30, Issue 2, 2011, p. 243-261.
-
Yang H. Synchrosqueezed wave packet transforms and diffeomorphism based spectral analysis for 1D general mode decompositions. Applied and Computational Harmonic Analysis, Vol. 39, Issue 1, 2014, p. 33-66.
-
Yang Haizhao, Ying Lexing, et al. Synchrosqueezed wave packet transform for 2D mode decomposition. Siam Journal on Imagingences, Vol. 6, Issue 4, 2012, p. 1979-2009.
-
Montejo L. A., Vidot-Vega A. L. Synchrosqueezed wavelet transform for frequency and damping identification from noisy signals. Smart Structures and Systems, Vol. 9, Issue 5, 2012, p. 441-459.
-
Bause F., Henning B., Huang B., et al. Ultrasonic waveguide signal decomposition using the synchrosqueezed wavelet transform for modal group delay computation. IEEE, Ultrasonics Symposium, 2013, p. 671-674.
-
Chen Y., Liu T., Chen X., et al. Time-frequency analysis of seismic data using synchrosqueezing wavelet transform. Journal of Seismic Exploration, Vol. 23, Issue 4, 2014, p. 303-312.
-
Brockway B., Brockway M. ECG Sensing with Noise Filtering. Google Patents, 2013.
-
Herrera R. H., Han J., Baan M. V. D. Applications of the synchrosqueezing transform in seismic time-frequency analysis. Geophysics, Vol. 79, Issue 79, 2014, p. 55-64.
-
Avanesians P., Momayez M. Wave separation: application for arrival time detection in ultrasonic signals. Ultrasonics, Vol. 55, 2015, p. 15-25.
-
Liu J., Wang Z., Ren W., et al. Structural time-varying damage detection using synchrosqueezing wavelet transform. Smart Structures and Systems, Vol. 15, Issue 1, 2015, p. 119-133.
-
Liu J. L., Ren W. X., Wang Z. C., et al. Instantaneous frequency identification based on synchrosqueezing wavelet transformation. Journal of Vibration and Shock, Vol. 32, Issue 18, 2013, p. 37-123.
-
Yi-Ding H. U., Ren W. X., Yang D. Nonstationary vibration signal decomposition based on synchrosqueezing transformation and local surrogate data. Journal of Vibration and Shock, Vol. 32, Issue 23, 2013, p. 43-47.
-
Wang X., Wang B., Wang W., et al. Harmonic signal extraction from chaotic interference based on synchrosqueezed wavelet transform. Acta Physica Sinica, Vol. 64, Issue 10, 2015, p. 201-210.
-
Thakur G., Brevdo E., Fu Kar N. S., et al. The Synchrosqueezing algorithm for time-varying spectral analysis: robustness properties and new paleoclimate applications. Signal Processing, Vol. 93, Issue 5, 2013, p. 1079-1094.
-
Li C., Liang M. Time-frequency signal analysis for gearbox fault diagnosis using a generalized synchrosqueezing transform. Mechanical Systems and Signal Processing, Vol. 26, Issue 1, 2012, p. 205-217.
-
Yi-Hsin C., Hau Tieng W., Shu-Shya H., et al. ECG-derived respiration and instantaneous frequency based on the synchrosqueezing transform: application to patients with atrial fibrillation. Applied and Computational Harmonic Analysis, Vol. 36, Issue 2, 2011, p. 354-359.
-
Ding X., Liu H., Liu J., et al. Wave propagation in a pipe pile for low-strain integrity testing. Journal of Engineering Mechanics, Vol. 137, Issue 9, 2012, p. 598-609.
-
Rausche F., Ren-Kung S., Likins G. E. Comparison of Pulse Echo and Transient Response Pile Integrity Test Methods. Transportation Research Record, 1991.
-
Daubechies I. Ten Lectures on Wavelets. Society for Industrial and Applied Mathematics, 1992, p. 1671.
-
Yang H., Ying L. Robustness analysis of synchrosqueezed transforms. Eprint Arxiv, 2014.
-
Huang Y. Q., Wang Y. R., Luo H. A new signal de-noising method based on fractional wavelet packet transform in time-frequency domain. Chinese Journal of Scientific Instrument, Vol. 32, Issue 7, 2011, p. 1534-1539.
Cited by
About this article

This research was funded by the Open Research Fund of State Key Laboratory of Simulation and Regulation of Water Cycle in River Basin (Grant No. IWHR-SKL-201518) and the National Natural Science Foundation of China (Grant No. 11132003, 51279054). I thank for Zhou Shungang (Zhejiang Engineering Prospecting Institute) providing me with the low strain pile testing data.
