Abstract
As an important manufacturing process, mechanical assembly affects directly product quality. Conventional quality inspections and estimations of mechanical assembly are primarily concentrated in “static quality”, such as size coordination, shaping and positioning tolerances, etc. However, mechanical assembly actually has its own dynamic quality, which contributes to that of whole product. Inspecting only static quality is thus incomplete for quality estimation of the assembly. On the basis of substructuring method, this paper at first applies eigenvalue analysis to investigate the effects of assembling process on the dynamic transfer-functions, expressed by spectral-based frequency response functions (FRFs), of substructural components involved in the process. Eigenvalue modules of FRF-matrix-ratios of FRF before assembling to that after assembling are analyzed to quantify the effects, which are consequently indicated by the mean module. Then, according to the explicit definition of “dynamic quality of mechanical assembly” introduced in this paper, dynamic quality matrix of mechanical assembly and its mean eigenvalue module are worked out and chosen to be the right quantitative measure and indicator for dynamic quality estimation of assembly system. Meanwhile, a lumped-parameter model and its experimental counterpart are employed to validate effectiveness of the analytical outcomes obtained and the quality estimation method established in the study.
1. Introduction
In manufacture of electromechanical products, mechanical assembly via manual, semi-automatic and or full-automatic technics is an important process that affects product quality. Its inspection and control are always paid highly attention for quality assurance (QA). The conventional quality inspections and estimations of mechanical assembly are primarily concentrated in “static quality”, such as size coordinations, shaping and positioning tolerances, etc., according to relevant technical standards and specifications [1] and or by the aid of corresponding technical management [2]. So far, rapidly developments on flexible and digitized assembly with its inspections continually promote the automatic assembly of products, such as vehicles and aircrafts, to different new levels [3, 4]. However, the conventional assembly quality inspections still belong to the static ones [5, 6], and so do their estimations, such as analysis and entropy computation of assembly defects [7]. In fact, a mechanical assembly process has also “dynamic quality” of itself. For dynamic quality of a whole product-noise, vibration and dynamic stability, only inspecting and estimating static quality is incomplete in essence.
This paper defines “dynamic quality of mechanical assembly” explicitly as “The effect of a mechanical assembling process on dynamic transferring characteristics of substructural components with their real connectors or joints involved in an assembly system”. Currently, there is no enough attention to dynamic quality inspection, estimation and control during assembling process. This results in poor theoretical and thus technical guidance, which are supposed to be investigated in detail to make up shortcomings of conventional static quality inspection and estimation.
Substructuring dynamic analysis is commonly-used in mechanical dynamics and can be applied to analyze structural dynamic transferring characteristics of mechanical systems. Where, frequency response function (FRF) can be easily used for structural dynamic analysis [8, 9], especially in engineering application [10]. The spectral-based FRF inverse substructuring dynamic analysis has been well developed [11] theoretically and applied in automotive [12]. The author of this paper [13] and Wang [14] also applied inverse substructuring analysis to dynamic analysis of transportation packaging systems. In practice, however, both substructuring and inverse substructuring dynamic analysis have problem of analytical accuracy, especially at lower order of modes [15]. Data enhancement is often needed, for instance, an enhanced LS algorithm was introduced [16]. In substructuring analysis, eigenvalues of dynamic transfer-functions are often applied to characterize the dynamic behaviors of mechanical structures and/or systems. In addition, eigenvalue analysis has been often used in dynamic transferring characteristics of discrete structural systems, especially on sensitivity analysis [17-19].
On the basis of substructuring method, this paper applies eigenvalue analysis to investigate dynamic quality of mechanical assembly that is considered as a two-level of substructures. Firstly, the effects of an assembling process on dynamic transferring characteristics of substuctural components involved in an assembling process are analyzed in detail. Where, the transfer-functions expressed by spectral-based frequency response functions (FRFs) is used to describe the dynamic characteristics, and eigenvalue modules of FRF-matrix-ratios of the FRFs before assembling to that after assembling are investigated to quantify the assembling effects, which are consequently indicated by the mean module. Secondly, according to the definition of “dynamic quality of mechanical assembly” introduced in this study, dynamic quality matrix and its mean eigenvalue module are worked out and chosen to be the right quantitative measure and indicator for dynamic quality estimation of assembly system. Meanwhile, a lumped-parameter model and its experimental counterpart are employed to validate effectiveness of the analytical outcomes obtained and the quality estimation method established in the study. The objective is to provide a theoretical basis for developing the approach for dynamic quality inspection and estimation of mechanical assembly.
2. Spectral-based substructuring analysis
2.1. Dynamic transfer-functions of mechanical assembly
Fig. 1FRFs on two-level of substructures before a) and after b) assembling
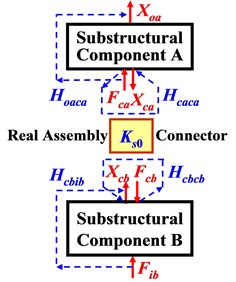
a) Component level
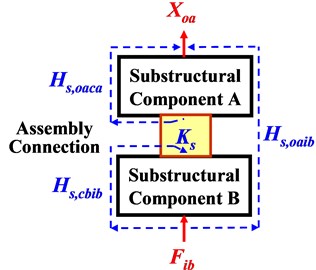
b) System level
Dynamic system of mechanical assembly can be modeled as a two-level of substructures as shown in Fig. 1. Where, two substructural components involved in assembling process are indicated by A and B, and dynamic transfer-function () from excitation-force () to displacement response () before assembling (in uncoupled state) and after assembling (in coupled state) are called “FRF at component level” (without subscript ‘’) and “FRF at system level” (with subscript ‘’), respectively. It represents dynamic transferring characteristics expressed specifically by spectral-based FRFs. The assembly-coupling dynamic stiffness is denoted by for assembly connection after assembling, which is different from the stiffness for real assembly connector before assembling. Lowercase , and denote substructures A, B and their coupling interface, and and denote input force and output displacement, respectively. For examples, and indicate FRF at component level from excitation on interface of side-A to output response also on A and FRF at system level from input excitation on side-B to output response on A.
Based on substructuring analysis, the relations between FRFs at component level () and FRFs at system level () of an assembling process can be expressed as follow [11]:
where:
The symbols +1, −1 for and , and +1, −1 for and , respectively. Matrix is called “assembly-coupling matrix”, in which matrix is so-called assembly-coupling dynamic stiffness and every of its entry is generally simplified by:
The real part represents static stiffness that indicates capacity of dynamic energy conservation, and in imaginary part represents damping factor indicating capacity of dynamic energy dissipation of an assembly, respectively. Symbol and is analytical frequency in Hertz, and .
Eqs. (1) and (2) show that, FRFs at system level (after assembling) can be explicitly expressed by that before assembling, which belongs to the ‘positive issue’ of substructuring analysis. Oppositely, FRFs at component level can also be inversely expressed by that after assembling which is so-called inverse substructuring analysis.
For convenience, the nine FRFs to be used in next discussions are simply denoted as:
In essence, FRFs , and indicate the dynamic transferring characteristics of substructural components A and B before assembling, and the assembly system after assembling, respectively.
2.2. Changes of FRFs on substructural components due to assembling process
For the two-level substructural model of Fig. 1, the effects of assembling process on dynamic transferring characteristics of substructural components A and B involved in the process are discussed next.
The nine representative FRFs expressed in Eq. (4) are associated with a mechanical assembly, For the two substructural components, their FRFs at system level (after assembling) can be expressed individually by corresponding FRFs at component level (before assembling). From Eq. (1), the functional relations can be formulated as follow:
where, [] is unit square matrix with the same size of matrix []. In order to measure the relative changes of dynamic transferring characteristics, ratios of the four representative FRF-matrices before assembling to those after assembly are formulated from Eqs. (5) and (6). A FRF-matrix-ratio compares the two matrices relative to each other. If the numbers of , , and are set to be equal, then the four FRF-matrix-ratios can be derived as:
Eqs. (7) and (8) demonstrate that, and , that means an assembling process has identical effect on the same component. Therefore, and would be selected as two representative FRF-matrix-ratios for further study next. On the other hand, the effects are described specifically by mathematical product of and or . Whereas assembly-coupling dynamic stiffness [] is the unique factor affected by assembling process, thus [] (for assembly connection after assembling) [] (for real assembly connector before assembling), see Fig. 1.
3. Eigenvalue analysis on assembling effects
3.1. Lumped-parameter model
To investigate in detail the changes of FRFs on two substructural components before assembling due to assembling process, a lumped-parameter model is employed for theoretical analysis. It is shown in Fig. 2 with parameters listed in Table 1. For this model system, it is assumed that no real assembly connector before assembling the two substructural components, i.e., []0, and after assembling, the coupling dynamic stiffness of assembly connection turns out to be [].
Fig. 2Lumped-parameter model of assembly system
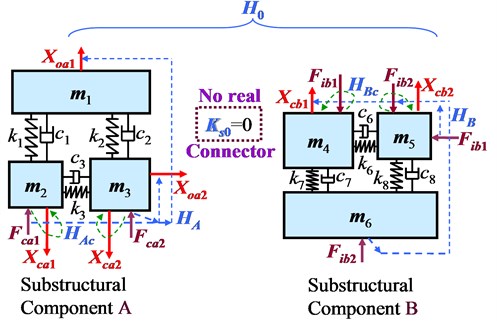
a) Before assembling
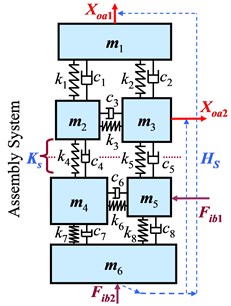
b) After assembling
Table 1Parameters of the lumped-parameter model
Mass [kg] | Static stiffness [N/m] | Damping factor [sN/m] | |||
4.5 | 6000 | 6 | |||
0.5 | 5500 | 5 | |||
2.0 | 2500 | 8 | |||
1.0 | 1200 | 10 | |||
0.8 | 1400 | 20 | |||
5.0 | 3500 | 9 | |||
7000 | 7 | ||||
6500 | 6 | ||||
All associated FRFs in the model system can be calculated by following governing equation of either substructural components or their assembly system:
where, , and corresponding to substructural components A and B, and assembly system, respectively. The analytical frequency is chosen to be 0-30 Hz for this model system. In addition, there are only two diagonal entries in assembly-coupling dynamic stiffness matrix, i.e., . They are given by Eq. (3) as follow:
Thus, a pair of dynamic force excitation input and displacement response output are set on both substructural components A and B (see Fig. 2), so that all FRF matrices from Eq. (7) are square with same size of .
3.2. Effects on substructural components
Eigenvalues of FRF-matrix-ratios and characterize the principal vectors on which relative changes of dynamic transferring characteristics of substructural components A and B are presented, respectively. From Eqs. (7) and (8), the eigenvalue modules can be calculated by:
where or for and , and ‘’ denotes ‘eigenvalue-finding’. If in principal vectors, then the FRF before assembling () would be greater than that after assembling ().
Strengthening assembly connection of the model system results in five levels of [], as listed inTable 2. Subsquently, the eigenvalue modules and are computed by Eq. (11) in full frequency range (0-30 Hz). The results are shown in Figs. 3 and 4.
Table 2Five [Ks]-levelsof the lumped-parameter model
[]-level | (N/m) | (N/m) | (sN/m) | (sN/m) |
1 | 300 | 350 | 2 | 5 |
2 | 600 | 700 | 5 | 10 |
3 | 1200 | 1400 | 10 | 20 |
4 | 2400 | 2800 | 20 | 40 |
5 | 3600 | 4200 | 40 | 80 |
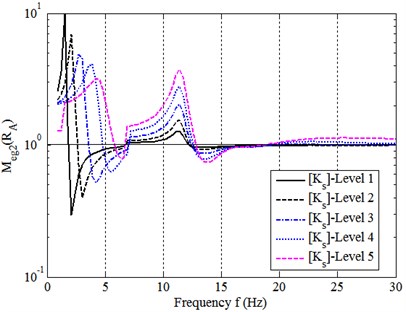
It can be seen from Figs. 3 and 4 that, in full frequency range, (1) at most frequencies, . It means that assembling process of the model system reduces the dynamic transfer-functions (FRFs). It can be explained that assembling process changes boundary conditions of the substructrual components, which constrain the dynamic responses; (2) at some frequencies, such as at about 6 Hz for 1st eigenvalue and 4 Hz and 13 Hz for 2nd eigenvalue, . This is resulted from destructive modal couplings. In this case, assembling process increases the transfer-functions; (3) increases with strengthening assembly connection that makes [] increased, and thus tends to be much lower than . Simultaneously, the peak frequencies move upto higher modes, at which the modal couplings get to be weak. The analytical results of (1) and (2) can also be seen clearly in Fig. 5, where the magnitudes of four entries of [] and [] are directly compared with those of [] and [].
Fig. 3Eigenvalue module MegRA
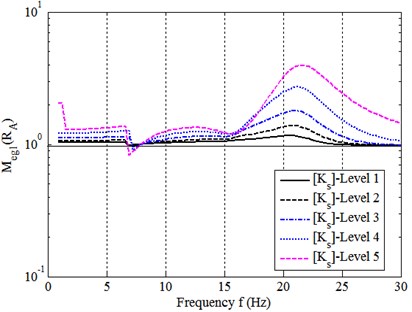
a) 1st eigenvalue
b) 2nd eigenvalue
Fig. 4Eigenvalue module MegRB at five [Ks]-levels
![Eigenvalue module MegRB at five [Ks]-levels](https://static-01.extrica.com/articles/16277/16277-img7.jpg)
a) 1st eigenvalue
![Eigenvalue module MegRB at five [Ks]-levels](https://static-01.extrica.com/articles/16277/16277-img8.jpg)
b) 2nd eigenvalue
3.3. Indication of the assembling effects
In order to synthetically estimate and thus simply indicate the assembling effects on substructural components of an assembly process, mean eigenvalue modules of FRF-matrix-ratios and are computed in full analytical frequency range for all eigenvalues as follow:
where and are the numbers of discrete frequencies and eigenvalues respectively. The mean eigenvalue module computed by Eq. (12) can be used to indicate the overall effect of assembling process.
Fig. 5Comparisons of a) HA with Hs,A, and b) HB with Hs,B (on [Ks]-level 3)
![Comparisons of a) HA with Hs,A, and b) HB with Hs,B (on [Ks]-level 3)](https://static-01.extrica.com/articles/16277/16277-img9.jpg)
a)
![Comparisons of a) HA with Hs,A, and b) HB with Hs,B (on [Ks]-level 3)](https://static-01.extrica.com/articles/16277/16277-img10.jpg)
b)
For the lumped-parameter model system, 100 within 0-30 Hz analytical frequency interval 0.3 Hz, and 2 due to all square FRF-matrices with size of 2 by 2. the mean-values of eigenvalue modules and are computed for the five []-levels. Table 3 lists the resultant data, which are also compared in Fig. 6. It can be seen that, (1) the overall effect of assembling process on dynamic transfer-functions are increased with strengthening the assembly connection; (2) the overall effect of an assembling process on substructural component A is very close to that on B; (3) both of the mean eigenvalue modules indicate that the assembling process of the model system reduce the FRFs [] and [] about 2-3.5 times with strengthening the assembly connection at the five []-levels.
Fig. 6Mean MegRA and MegRB at five [Ks]-levels
![Mean MegRA and MegRB at five [Ks]-levels](https://static-01.extrica.com/articles/16277/16277-img11.jpg)
Table 3Mean eigenvalue modules of RA and RB
[]-level | |||||
1 | 2 | 3 | 4 | 5 | |
2.16 | 2.24 | 2.43 | 2.79 | 3.26 | |
2.17 | 2.25 | 2.45 | 2.84 | 3.39 | |
4. Dynamic quality estimation of mechanical assembly
4.1. Formulating a quantitative measure
For a mechanical assembly system, dynamic quality inspection and estimation require a right quantitative measure and/or indicator in engineering application. According to the definition of “dynamic quality of mechanical assembly” explained in ‘Introduction’ of this paper, a relative change of systematic dynamic transferring characteristics due to assembling process is to be determined quantitatively to measure the dynamic quality of the whole assembly system.
Similarly to discussion in Section 2.2, relative change of systematic dynamic transferring characteristics from the FRFs and of both substructural components, together with the dynamic stiffness [] of real assembly connector, before assembling, to the systematic FRF of their assembly system can also be described by a FRF-matrix-ratio. On the other hand, Eqs. (1) and (2) show that assembly-coupling matrix [] just combines the transfer-functions from the FRF [] on side B of connecting-interface, through assembly connection [], to the FRF [] on another side A of the interface. Thereby it describes completely the overall dynamic transferring characteristics of an assembling process. Thus, matrix [] does dominate the overall assembling effect on the systematic dynamic transferring characteristics of whole assembly system. Thereby, matrix [] would be the right choice for finding out the FRF-matrix-ratio to estimate the relative change.
Two entries (1, 3) and (3, 1) of FRF-matrix on both sides of Eq. (1) provide such equalities that relate the systematic transfer-functions after assembling to that before assembling. Here choosing entry (1, 3) leads to:
Before assembling, the two substructural components are disconnected, Eq. (13) would become:
Specially, if there is no any real connector or joint for an assembling process, i.e., 0, as it is assumed in the lumped-parameter model, then Eq. (14) turns out to be:
If set same numbers of , and , and combine Eqs. (14) and (15) for [], then the FRF-matrix-ratio to be found can be formulated by , denoted specially by , as follow:
In consideration of the matrix-ratio is adopted essentially for comparing [] with [] and thus generating the relative change , Eq. (16) can be equivalently rewritten in normalized form as:
where:
The FRF-matrix-ratio expressed in Eqs. (16) and/or (17) describes definitely the overall change of systematic transfer-function after assembling, relative to the ‘systematic transfer-function’ [] before assembling (as reference base), of whole assembly system due to assembling process. Therefore, it is supposed to be applied as the right quantitative measure on overall effect of the process of a mechanical assembly. Consequently, it is renamed as “dynamic quality matrix of mechanical assembly” here by this study.
4.2. Eigenvalue analysis on dynamic quality matrix
Again, the lumped-parameter model of Fig. 2 is applied for eigenvalue analysis on the dynamic quality matrix . In the model system, as it is supposed 0, thus Eq. (17b) is adopted to do the eigenvalue analysis on matrix as done in Section 3.2 and 3.3.
Fig. 7 illustrates the eigenvalue module computed by Eq. (17b) at the five -levels. It shows that, (1) at most frequencies, for both eigenvalues of , even up to 20-30 Hz near peak frequencies. Additionally, modal couplings still exist so that at some frequencies, such as 4 Hz and 14 Hz; (2) strengthening the assembly connection ([] goes up to higher levels) lead getting down, that is, goes higher relative to . This can be considered as that the dynamic quality of whole assembly system of the model turns out to be poor.
Fig. 7Eigenvalue module MegQC at five [Ks]-levels
![Eigenvalue module MegQC at five [Ks]-levels](https://static-01.extrica.com/articles/16277/16277-img12.jpg)
a) 1st eigenvalue
![Eigenvalue module MegQC at five [Ks]-levels](https://static-01.extrica.com/articles/16277/16277-img13.jpg)
b) 2nd eigenvalue
Fig. 8 compares directly to . Again, it shows that the ‘overall systematic dynamic transfer-function’ [] of whole model system before assembling (in free or uncoupling state) is generally greater than that after assembling (in coupled or constrained state). This proves the analytical results above from Fig. 7 and results in 1 generally. On the whole, dynamic quality matrix [] is proved to be the expected measure for estimating the dynamic quality of a mechanical assembly system.
To indicate the dynamic quality quantitatively, the mean eigenvalue modules of over full frequency range is computed by Eq. (12) as well here at the five []-levels. The computed data are listed in Table 4 and compared in Fig. 9. It shows that strengthening assembly connection makes mean-value of decreased, and thus the systematicdynamic transfer-function increased relative to . This indicates the dynamicquality of the assembly system getting poor. Summarily, dynamic quality matrix and its mean eigenvalue module can be considered as the right quantitative measure and indicator for dynamic quality inspection and estimation of mechanical assembly.
Table 4Mean eigenvalue modules of QC
[]-level | 1 | 2 | 3 | 4 | 5 |
60.69 | 30.91 | 18.00 | 11.71 | 9.40 |
Fig. 8Comparing Hs with H0
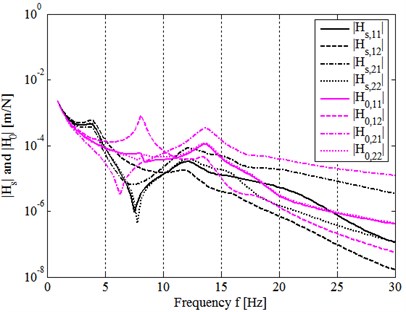
Fig. 9Mean MegQc at five [Ks]-levels
![Mean MegQc at five [Ks]-levels](https://static-01.extrica.com/articles/16277/16277-img15.jpg)
5. Application to experimental counterpart
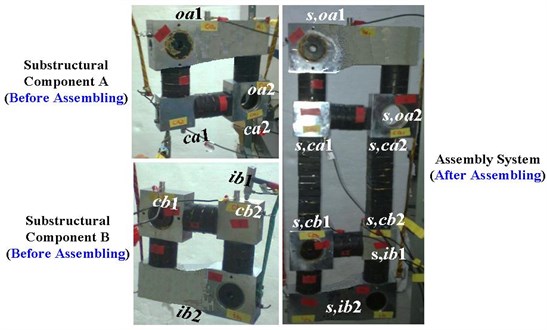
To validate further the effects of assembling process and the effectiveness of the quantitative measure and indicator of dynamic quality of mechanical assembly, an analogic experimental counterpart of the lumped-parameter model is employed here to primarily apply eigenvalue analysis and the dynamic quality matrix determined by Eq. (17b).
Fig. 10 illustrates the experimental model that imitate the assembling process of Fig. 2. In this model system, six aluminum mass blocks are connected by multilayer rubber-pads with adhesives. Both substructural components before assembling and the assembly system after assembling are suspended up on a rigid frame by elastic ropes for keeping them in free state during FRF-tests by “hammer excitation-accelerator response”. Fig. 11 demonstrates the experimental connecting diagram, Fig. 11(a), and its instrumentation, Fig. 11(b). It consists of multi-channel signal conditioning and data-acquisition system with self-contained software, DASP. The tested FRF-data are then processed further by programming in Matlab, where moving-average is applied for smoothing the plots.
Fig. 10Experimental counterpart of the lumped-parameter model
In consideration of differences always existing in between an analytical model and its real counterpart, the testing frequency is fixed to be 0-300 Hz to ensure the model system to be well excited, and the relevant sampling frequency interval is set to be 1.0 Hz for FRF-tests. Totally 20 FRF-entries of five FRF-matrices: [] and [] on substructural component A, [] and [] on substructural component B, and [] on the whole assembly system are tested respectively. Then use Eqs. (7a), (8a) and (17b) to calculate , and respectively. Their mean eigenvalue modules are computed by Eq. (12), where 2 and 300. All results are named here as “measured” ones.
Fig. 12 illustrates the measured and together with direct comparison of to , as shown in Fig. 13. The measured mean , and are listed in Table 5 and compared in Fig. 14.
Fig. 11Testing system
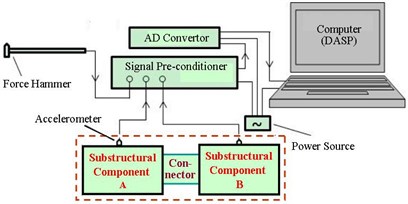
a) Connecting diagram
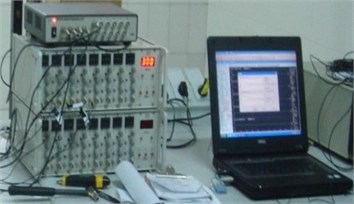
b) Data-acquisition system
Fig. 12Measured eigenvalue modules
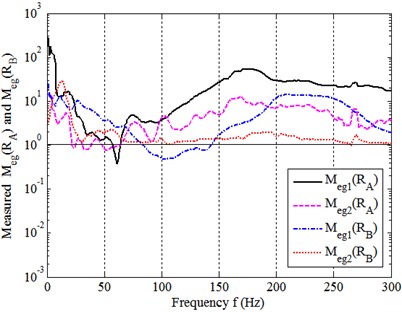
a) and
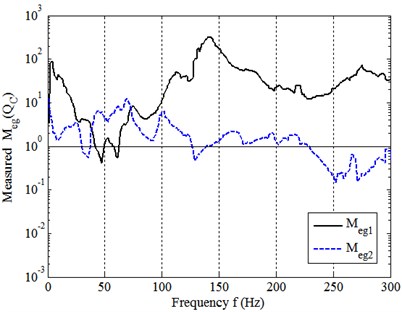
b)
Fig. 13Comparison of measured Hs to H0
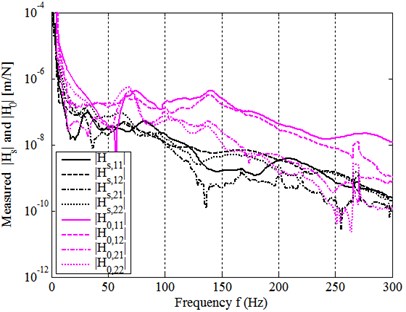
Fig. 14Measured mean eigenvalue modules
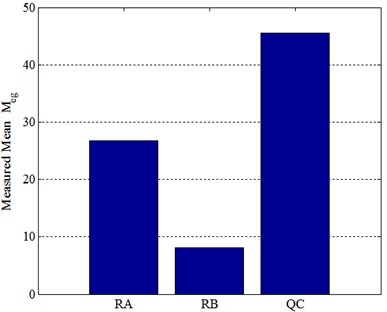
Table 5Measured mean eigenvalue modules
FRF-matrix-ratio | |||
26.70 | 8.03 | 45.59 |
It can be seen again that, for the experimental model system, the assembling process makes , and also , totally, the overall magnitudes of the three FRFs before assembling are about 27, 8 and 46 times higher than that after assembling. In summary, these measured results are consistent with those obtained in Sections 3.2, 3.3 and 4.2, which have been well validated by this application.
6. Conclusions
Mechanical assembly has its own dynamic quality that affects directly the product dynamic quality. In order to improve conventional “static quality” inspection and estimation of mechanical assembly, this paper defines explicitly the concept of “dynamic quality of mechanical assembly”. Based on substructuring dynamic analysis, eigenvalue analysis of spectral-based FRFs involved in an assembling process has been carried out to investigate the effects of assembling process on the dynamic transferring characteristics of both substructural components and their assembly system. A right quantitative measure and its indicator has also been determined for the dynamic quality estimation of mechanical assembly. The results obtained in this study are concluded as follow:
1) A mechanical assembling process has the effects that the dynamic transfer-functions (FRFs) of both substructural components and their assembly system. In general, the FRFs before assembling are decreased due to the process, and the systematic dynamic transfer-function of an assembly system is also less than that of combined FRFs on the components and real assembly connector without assembling generally. However, in case of that destructive modal couplings occur at some frequency modes, the process would increase the transfer-functions of both of the components, and the systematic transfer-function turns out to be greater than the combined one.
2) Strengthening assembly-coupling dynamic stiffness of assembling process makes the dynamic transfer-functions of both substructural components get to be decreased further, but increase the systematic dynamic transfer-function of the assembly system gets to be increased and thus leads the dynamic quality of the assembly system to be poor.
3) The dynamic quality matrix determined by Eqs. (16)-(18) can be effectively applied as the right quantitative measure on the dynamic quality of an assembly system. Its mean eigenvalue module computed by Eq. (12) can be considered as the right quantitative indicator for dynamic quality estimation of mechanical assembly in engineering application.
4) Eigenvalue analysis on the lumped-parameter model shows effective in assembly dynamic quality analysis. And the primary application on the experimental counterpart of the model has well validated the analytical outcomes and the method established in this study for assembly dynamic quality estimation.
The method established in this paper is effective and feasible in engineering application on dynamic quality inspection and estimation of mechanical assembly. It contributes to improve conventional quality inspection, estimation and control of mechanical assembly and can be widely applied in manufacturing process, therefore benefits dynamic quality assurance of electromechanical products.
References
-
Xu B. Technical Standards of Mechanical Assembly. China Light Industry Press, Beijing, 2010.
-
Wang X. K. Quality Management of Mechanical Assembly. China Machine Press, Beijing, 2010.
-
Liu Y. H., Wang W., Zhu X. B. Automotive assembly – the state of art. Bus Technology and Research, Vol. 2, 2007, p. 47-49.
-
Wei Z. G., Xue L. The advanced techniques and developments of aeroplane assembly. Journal of Aeronautical Engineering Institute, Vol. 24, Issue 1, 2009, p. 119-120.
-
Gao K., Zhao H. W., Peng G. H. Advanced automatic measurement technology for engine assembly. New Technology and New Process, Vol. 7, 2003, p. 11-13.
-
Wu X. J. A portable laser instrument for inspecting airplane assembly seam. Metrology and Measurement Technology, Vol. 31, Issue 5, 2011, p. 22-26.
-
Wang B., Tang X. Q. Decision-making of quality control for mechanical assembly activities. China Mechanical Engineering, Vol. 21, Issues 2-2010, 164, p. 168-174.
-
Xiang S. H., Qiu J. B., Wang D. J. The recent progresses on modal analysis and dynamic substructure methods. Advances in Mechanics, Vol. 34, Issue 3, 2004, p. 289-303.
-
Hwang H. Y. Identification techniques of structure connection parameters using frequency response functions. Journal of Sound and Vibration, Vol. 212, Issue 3, 1998, p. 469-479.
-
Lim T. C., Steyer G. C. Hybrid experimental-analytical simulation of structure-borne noise and vibration problems in automotive systems. Journal of Passenger Cars, Vol. 101, Issue 6, 1992, p. 585-591.
-
Zhen J. T., Lim T. C., Lu G. Q. Determination of system vibratory response characteristics applying a spectral-based inverse sub-structuring approach. Part 1: analytical formulation. International Journal of Vehicle Noise and Vibration, Vol. 1, Issues 1-2, 2004, p. 1-30.
-
Zhen J. T., Lim T. C., Lu G. Q. Determination of system vibratory response characteristics applying a spectral-based inverse sub-structuring approach. Part 2: Motor vehicle structures. International Journal of Vehicle Noise and Vibration, Vol. 1, Issues 1-2, 2004, p. 31-67.
-
Lu G. G., Wang Z. W. Study on dynamic characteristics of product-packaging-carrier system. Chinese Packaging Engineering, Vol. 27, Issue 1, 2006, p. 115-118.
-
Wang Z. W., Wang J., et al. Application of the inverse substructure method in the investigation of dynamic characteristics of product transport system. Packaging Technology and Science, Vol. 25, Issue 6, 2012, p. 351-362.
-
Kompella M. S., Bernhard R. J. Techniques for prediction of the statistical variation of multiple-input-multiple-output system response. Noise Control Engineering Journal, Vol. 45, 1997, p. 133-142.
-
Li J., Lim T. C. Application of enhanced least square to component synthesis using FRF for analyzing dynamic interaction of coupled body-subframe system. SAE Paper No. 1999-01-1826, Traverse City, Michigan, USA, 1999.
-
Adelman H. M., Haftka R. T. Sensitivity analysis for discrete structural systems. AIAA Journal, Vol. 24, 1986, p. 823-832.
-
Choi K. M., Cho S. W., Man Ko G., Lee I. W. Higher order eigen sensitivity analysis of damped systems with repeated eigenvalues. Computers and Structures, Vol. 82, 2004, p. 63-69.
-
Liu X. B. A new method for calculating derivatives of eigenvalues and eigenvectors for discrete structural systems. Journal of Sound and Vibration, Vol. 332, Issue 7, 2013, p. 1859-1867.
About this article

The authors acknowledge gratefully the National Natural Science Foundation of China for supporting the researches of Project No. 51475211, including the study of this paper.
