Abstract
The development of a measurement system for the purpose of structural performance evaluation has been needed. This work introduces a moving cart system on which to mount measurement sensors to measure acceleration and sound pressure in the time domain and an impact hammer for external excitation. The measurement data are utilized to evaluate the structural performance based on a mixed approach to directly and indirectly collect response data by a microphone and an accelerometer, respectively. The reliability of the measurement data is improved by the utilization of multiple sensors. The structural state is investigated by the power spectral density estimate (PSE) or proper orthogonal mode (POM) of the sound pressure and acceleration data. The applicability of the system is illustrated in a field test.
1. Introduction
The defects of wide open members, such as slabs and bridges; members with long spans, such as a railway; and underground members, such as sinkholes, should be traced using numerous measurements. A conventional performance evaluation of a structural member is performed using the sound pressure or dynamic responses caused by tapping the structural surface with an impact hammer. The process for these measurements at many locations is time-consuming and requires significant training of the inspectors. If the measurement sensors on the structural member are installed, a vast number of sensors are necessary. Furthermore, if the measurement system is operated by inspectors, their weight also affects the responses and dynamic characteristics. Such inadequacies can be resolved by automatically controlling the measurement system by a remote wireless controller.
The direct method directly collects response data from measurement sensors attached on the test structure, and the indirect approach collects data from sensors on the moving cart rather than on the test structure. The direct approach is carried out by hitting the hammer at a single reference point to excite the beam and roving the accelerometer, and vice versa. The dynamic responses and sound pressure are indirectly measured by the accelerometer on a platform attached at the rear of the cart and the microphone, respectively. The indirect method could offer a mobile, sustainable, and economical complementary solution to the traditional direct method.
Yang et al. [1] presented an indirect approach for measuring the bridge frequencies using a vibration sensor mounted on a hand-drawn cart rather than on the bridge. Yang et al. [2] developed hand-drawn test carts and investigated the test results depending on the elastic properties of the cart wheels and the reliability of the bridge frequencies. Malekjafarian et al. [3] presented a review of indirect methods for bridge monitoring and the technical factors to be overcome for successful implementation. Miyamoto and Yabe [4] provided a method of assessing the condition of existing concrete bridges based on vibration data obtained from a public bus equipped with measurement instrumentation. Yang et al. [5] studied the effect of the road surface roughness on measuring the bridge frequencies indirectly from a test vehicle passing over the bridge. Gonzalez et al. [6] provided a method to estimate road irregularities by establishing the relationship between the power spectral densities of the road surface and vehicle accelerations. Douangphachanh and Oneyama [7] derived an approach to estimate the road roughness condition using acceleration data collected by smartphone sensors. Li and Au [8] presented a damage detection method using the collected vertical accelerations of the vehicle and a bridge subjected to a sinusoidal excitation and applying a continuous wavelet transform. Cerda et al. [9] investigated an indirect approach for evaluating the detection capability of the approach based on data measured from a passing vehicle. Cerda et al. [10] investigated the validity of an indirect approach to bridge structural health monitoring using the collected acceleration signals from a vehicle and bridge system and the simple short-time Fourier transform technique. Lederman et al. [11] presented algorithms for diagnosing damage using the responses collected both directly from the bridge model and indirectly from a vehicle passing over the model.
A power spectral density estimate (PSE) predicts the spectral density of a random signal from a sequence of the time sample. The techniques may be based in time domain or frequency domain analysis. Welch [12] provided a method for the application of the fast Fourier transform (FFT) algorithm to estimate power spectra. The Welch method is a non-parametric method and includes a periodogram, with the advantage of possible implementation using FFT. The Welch method is used to find the power spectral density estimate (PSD) of a signal and to reduce the effect of noise. Vamvoudakis-Stefanou et al. [13] analyzed six well-known, output-only statistical time series methods and compared the methods through the detection and identification of various types of damage. Kopsaftopoulos and Fassois [14, 15] investigated the potential and effectiveness of the statistical time series methods through experiments on a laboratory aluminum truss structure. They assessed several scalar and vector statistical time series methods for vibration based on structural health monitoring. Gupta et al. [16] compared several types of window functions and observed that the rectangular and Hamming windows gave better results than the Bartlett, Hanning and Blackman windows. Zimm and Zimmerman [17] compared time domain periodogram analysis (TDPA) with frequency domain periodogram analysis (FDPA) for synthetic signals and suggested that TDPA can be utilized as an index to evaluate the existence of structural damage.
To collect as much measurement data as possible, a more accurate evaluation of the structural performance should be performed. However, making repeated measurements is time consuming. The direct method also requires a number of sensors and a large amount of labor to attach the sensors and measure data. Such difficulties can be overcome by the indirect method and the operation of a remote controller. This work provides a moving cart system to install the sensors to measure the acceleration and sound pressure due to the external excitation by an impact hammer. The measured data in the time domain are transformed to the PSEs, and the structural performance is evaluated based on the data. The applicability of the system is illustrated in a field test.
2. Welch’s method
The Welch method divides the time series data into segments, computes a modified periodogram of each segment and averages the PSE. A portion of the data stream near the boundaries of the window function is ignored in the analysis, and its situation can be improved by letting the segments overlap. The PSD represents the strength of the variations as a function of the frequency. The spectral density characterizes the frequency content of the signal, and its estimation detects any periodicities in the data by observing peaks at the frequencies corresponding to these periodicities. The PSE is the discrete Fourier transform (DFT) of the autocorrelation estimate or:
This assumes that is a discrete time, random process with an autocorrelation function . The number of overlapping data, the window function, and the frequency resolution affect the PSE in Eq. (1).
Dividing an N point data sequence , , from a stationary, second-order stochastic sequence into segments of samples (), the data segment can be expressed as:
Similarly:
and:
where is the starting point for the th sequence. If , the segment does not overlap.
The Welch method to modify Bartlett’s method applies the window directly to the data segment before computing the individual periodograms. The modified or windowed periodogram to form ,…, can be defined as:
where and is a normalization factor for the power, written as:
The Welch PSE is the average of the modified periodogram, defined as:
and its expected value is given by:
here:
This study adopted the hamming window function as:
The frequency resolution is the distance in Hz between two adjacent data points in the DFT. It is defined as:
where denotes the sampling rate and is the number of data. From the relationship of the sampling rate and time, , it can also be expressed by:
This equation indicates that the frequency resolution is affected by the prescribed time.
The normalizing factor in Eq. (6) is required so that the PSE of the modified periodogram will be asymptotically unbiased. The PSE is determined by the spectral resolution of each segment of length , and it depends on the window function to minimize the effect of leakage to better represent the frequency spectrum of the data. This work predicts the structural performance using the PSE transformed from the measured response data in the time domain.
Fig. 1Moving cart to install measurement sensors
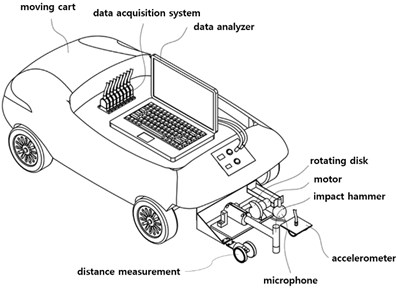
3. Moving cart
A measurement system collects the units of measurement. The measurement system in Fig. 1 is composed of an accelerometer, an impact hammer and a microphone and is installed on a moving cart to measure responses subjected to the excitation of the hammer. The accelerations and sound pressure in the time domain and the frequency responses function (FRF) in the frequency domain are collected in the data acquisition system. The FRF is expressed as a function of the cross-spectrum and auto-spectrum, which can readily be obtained from most multi-channel data acquisition systems. They are saved in the form of the FRF magnitudes in g/N and Pa/N measured by the accelerometer and the microphone, respectively. The cart moves at a constant velocity of 0.4 m/sec. and is controlled at regular intervals for measurement. The cart stops for a while, and the impact hammer hits the structure. At the same time, the acceleration and sound pressure are measured, and the measured data are collected in the data acquisition system. Five impact hammer tests are repeatedly conducted at a stop, and the collected data are averaged to evaluate the structural performance. The cart moves forward for the next measurement after finishing the measurement at a node. The process is repeated, and the system is controlled by a remote controller such as a smartphone to minimize the effect due to the weight of the inspector because it affects the dynamic characteristics. Additionally, the cart is designed to reduce its mass of 33.4 kg.
The accelerometer and microphone are placed on the rear of the vehicle, and the impact hammer is located at the rear of the vehicle, like a tail. The accelerometer is attached on the wheeled plate, and the accelerations are indirectly measured on the structure. The impact hammer head strikes a constant position five times by the same cycle so that the same impulse force repeatedly exerts at a point on the structure. The sound pressure is directly measured by the microphone. It is expected that the measurement data collected by the multiple sensors and the mixed approach of direct and indirect methods provide more reliable data than a single sensor. The experiment was conducted using a DYTRAN model 3055B1 uni-axial accelerometer with a frequency measurement range of 1 to 10,000 Hz, a PCB model 426E01 microphone preamplifier with a frequency measurement range of 1 to 10,000 Hz and a miniature transducer hammer, Brüel & Kjaer model 8204. The data acquisition system was a DEWETRON model DEWE-43.
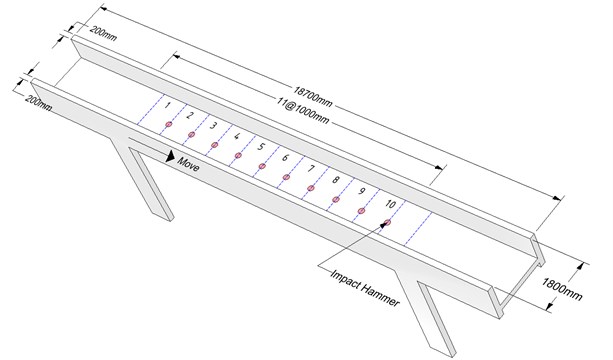
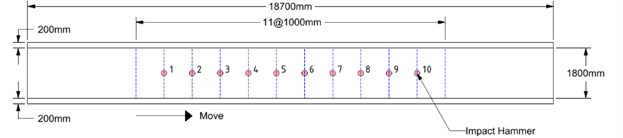
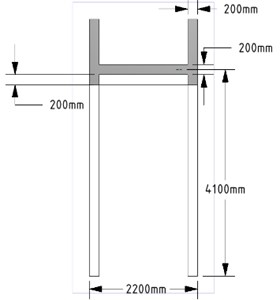
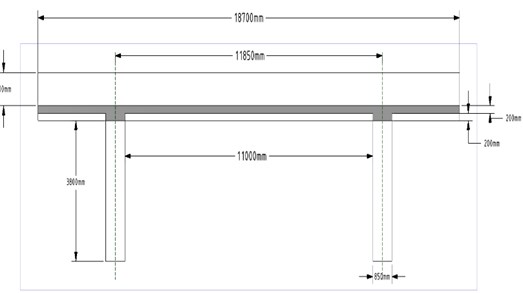
Fig. 2Reinforced concrete corridor: a) perspective view, b) floor plan and sensor placement, c) front view, d) side view
a)
b)
c)
d)
4. Structural performance test using the moving cart
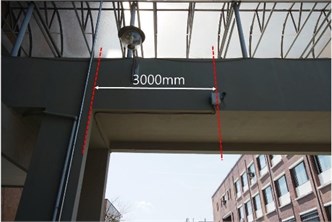
Experimental work to evaluate the structural performance of the reinforced concrete corridor in Fig. 2 connecting the second floors of two adjacent buildings was performed using the proposed moving cart. The corridor was located 4,100 mm above the ground and was 11,000 mm in length between the two supports, and its gross cross-section was 1,800 mm×200 mm. The bridge was built in 1994 and did not look like it required repairs to the naked eye, except for the concrete cracks due to drying shrinkage.
Based on the measurement data obtained by the moving cart, the relative flexural rigidity of the structure at the measurement positions is compared using the PSE approach. The reinforced concrete corridor is governed by the flexural behavior rather than the shear behavior. Thus, its performance can be evaluated by the flexural responses. The abrupt change in the PSE curve should be displayed at the region of the structural defect. Such a region can be more reliably detected by multiple sensors rather than a single sensor.
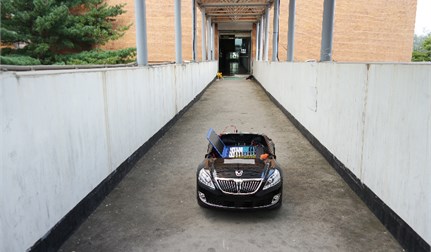
The excitation by an impact hammer at the stationary state on the corridor and the corresponding vertical acceleration and sound pressure are simultaneously recorded. The cart moves from one end to the other support, shown in Figs. 2 and 3, by the operation of the remote controller. The cart stops at ten points at 1 m intervals along the bridge, and the measurements are repeatedly carried out.
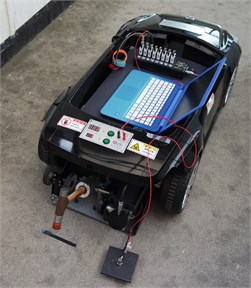
Fig. 3Moving cart on the reinforced concrete corridor
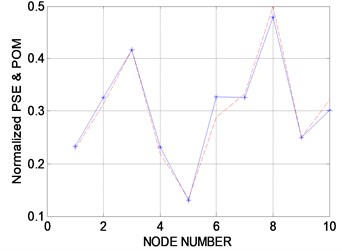
When the cart stops at a stationary position, the responses due to the strike of the impact hammer are measured. Fig. 4(a) shows the acceleration response after 0.11 seconds from rest. Fig. 4(b) displays the PSE of a discrete-time response vector using Welch's averaged, modified periodogram method. The acceleration response data set is divided into eight sections with 50 % overlap. Each section is windowed with a Hamming window, and eight modified periodograms are computed and averaged. The frequency resolution is established as 3.50 Hz. The axis in Fig. 4(b) denotes the vector of normalized frequencies at which the PSD is estimated. Unreliable factors in the measurement data can lead to improper performance results. The measurement data contain external noise such as measurement errors due to the irregularity of the concrete cover and equipment errors. The exact performance evaluation depends on the accuracy of the measurement data. As shown in Fig. 4(b), the explicit resonance frequency cannot be found because the measurement data are contaminated by the external noise, and the first resonance frequency measured at all nodes is located in the range 40 Hz±5 Hz. Taking the maximum PSE data at all nodes in the range 13.66-58.05 Hz, including the first resonance frequency or transforming the PSE data in the range to the proper orthogonal mode (POM), this study utilizes indices to evaluate the structural state. Fig. 4(c) shows the normalized vector of the maximum PSE data at all nodes in the frequency range and the POM curve corresponding to the first proper orthogonal value (POV) of all PSE data in the range. It is observed that an abrupt change in the plot or a structural defect exists at nodes 3 and 6. Fig. 4(c) shows that the structural defect is expected in the neighborhood of nodes 3 and 6 despite the existence of external noise. It is observed that the structural performance deterioration comes from the section loss related to the structural rigidity. Two holes are located on both sides of the corridor floor of node 6 in Fig. 6(a), and the punched section to anchor the attachment is placed at node 3, shown in Fig. 6(b). Considering that the PSE curve in Fig. 4(c) compares the relative rigidity at node sections, it is found that the section at node 6 exhibits more section loss than at node 3 and is more deteriorated. It should be expected that the sections at nodes 3 and 6 can contain other defects that affect the structural performance, except the section loss. After the experiment, a more detailed investigation at the defect-expected region should be conducted.
Fig. 4Test results measured by accelerometer. The solid line and dashed line indicate the maximum PSE and the POM, respectively
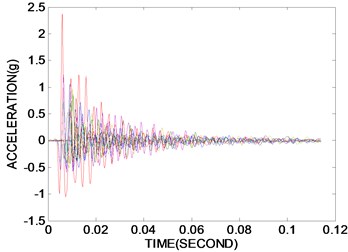
a) Acceleration responses in time domain
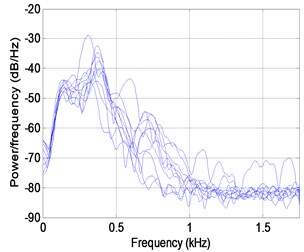
b) PSE curve in frequency domain
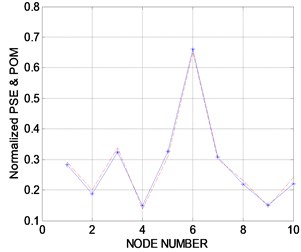
c) Normalized PSE curves
Fig. 5 shows the experimental results measured by the microphone. Fig. 5(a) shows the sound pressure at all nodes in the time domain. Transforming them to the PSE in the frequency domain, the resulting curves are shown in Fig. 5(b) and include the external noise so that the resonance frequency cannot be recognized explicitly. Fig. 5(c) plots the maximum PSE values at all nodes and the normalized POM curves extracted from the PSE data in the same range as the accelerometer, 13.66-58.05 Hz. It is expected that the structural defect should exist in the region between nodes 6 and 8 in Fig. 6(a) and at node 3 in Fig. 6(b). The structural defects are expected in the region between nodes 6 and 8 and at node 3 based on the mixed approach. Results similar to the accelerometer are observed, except that the defect-expected region is placed at the region between nodes 6 and 8 rather than at node 6. Furthermore, a more accurate performance evaluation was performed by multiple sensors than a single sensor, and the proposed moving cart system can be utilized in evaluating the structural performance.
Fig. 5Test results measured by microphone. The solid line and dashed line indicate the maximum PSE and the POM, respectively
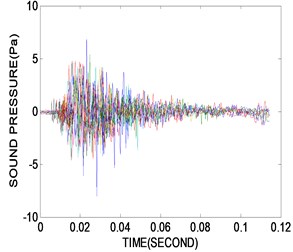
a) Sound pressure responses in time domain
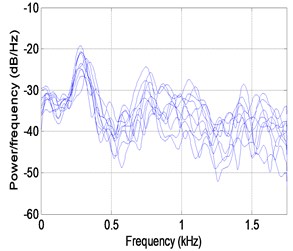
b) PSE curve in frequency domain
c) Normalized PSE curves
Fig. 6Cross section of damage-expected region
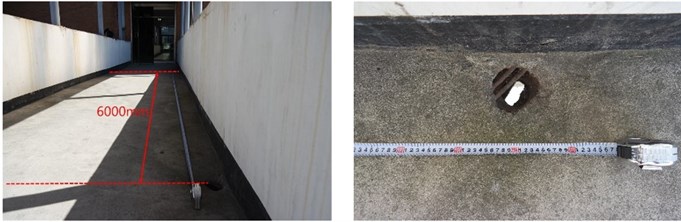
a) Two holes in cross section
b) Attachment anchored in corridor
5. Conclusions
This work presents a moving cart system to mount measurement sensors for evaluating the structural performance. The performance evaluation is performed by the mixed approach based on measurement data using a microphone and an accelerometer, which is automatically operated by a remote control sensor. The collected data for the acceleration and sound pressure in the time domain are transformed to the PSE in the frequency domain and its POM. The data are utilized as the indices to evaluate the structural performance. The reliability of the measurement data is improved by using multiple sensors. Considering the normalized PSE and POM curves obtained from the mixed approach, the structural health state can be evaluated, and this is illustrated through an experiment. It can be concluded that the proposed moving cart system and the mixed approach can be utilized to evaluate the structural performance.
References
-
Yang Y. B., Chen W. F., Yu H. W., Chan C. S. Indirect measurement of bridge frequencies by a hand-drawn cart. Proceedings of the Thirteen East Asia-Pacific Conference on Structural Engineering and Construction, Sapporo, Japan, 2013.
-
Yang Y. B., Chen W. F., Yu H. W., Chan C. S. Experimental study of a hand-drawn cart for measuring the bridge frequencies. Engineering Structures, Vol. 57, 2013, p. 222-231.
-
Malekjafarian A., McGetrick P. J., Obrien E. J. A review of indirect bridge monitoring using passing vehicles. Shock and Vibration, 2015, p. 286139.
-
Miyamoto A., Yabe A. Bridge condition assessment based on vibration responses of passenger vehicle. Journal of Physics: Conference Series, Vol. 305, 2011, p. 1-10.
-
Yang Y. B., Lee Y. C., Chang K. C. Effect of road surface roughness on extraction of bridge frequencies by moving vehicle. Mechanics and Model-Based Control of Advanced Engineering Systems, 2014, p. 295-305.
-
Gonzalez A., O’Brien E. J., Li Y., Cashell K. The use of vehicle acceleration measurements to estimate road roughness. Vehicle System Dynamics, Vol. 46, Issue 6, 2008, p. 483-499.
-
Douangphachanh V., Oneyama H. A study on the use of smartphones for road roughness condition estimation. Proceedings of the Eastern Asia Society for Transportation Studies, Vol. 9, 2013.
-
Li Z., Au F. T. K. Damage detection of bridges using response of vehicle considering road surface roughness. International Journal of Structural Stability and Dynamics, Vol. 15, Issue 3, 2015, p. 1450057.
-
Cedar F., Chen S., Bielak J., Garrett J. H., Rizzo P., Kovacevic J. Indirect structural health monitoring of a simplified laboratory-scale bridge model. Smart Structures and Systems, Vol. 13, Issue 5, 2014, p. 849-868.
-
Cedar F., Garrett J. H., Bielak J., Rizzo P., Barrera J. A., Zhang Z., Chen S., McCann M. T., Kovacevic J. Indirect structural health monitoring in bridges: scale experiments. Proceedings of the Sixth International IABMAS Conference on Bridge Maintenance, Safety, Management, Resilience and Sustainability, Stresa, Italy, 2012, p. 346-353.
-
Lederman G., Wang Z., Bielak J., Noh H., Garrett J. H., Chen S., Kovacevic J., Cerda F., Rizzo P. Damage quantification and localization algorithms for indirect SHM of bridges. Bridge Maintenance, Safety, Management and Life Extension, 2014, p. 640-647.
-
Welch P. D. The use of fast Fourier transform for the estimation of power spectra: a method based on time averaging over short, modified periodograms. IEEE Transactions on Audio and Electroacoustics, Vol. AU15, 1967, p. 70-73.
-
Vamvoudakis-Stefanou K. J., Sakellarlou J. S., Fassois S. D. Output-only statistical time series methods for structural health monitoring: a comparative study. 7th European Workshop on Structural Health Monitoring, Nantes, France, 2014.
-
Kopsaftopoulos F. P., Fassois S. D. Experimental assessmen of vibration-based time series methods for structural health monitoring. 4th European Workshop on Structural Health Monitoring, Kracow, Poland, 2008.
-
Kopsaftopoulos F. P., Fassois S. D. Scalar and vector time series methods for vibration based damage diagnosis in a scale aircraft skeleton structure. Journal of Theoretical and Allied Mechanics, Vol. 49, 2011, p. 727-756.
-
Gupta H. R., Batan S., Mehra R. Power spectrum estimation using Welch method for various window techniques. International Journal of Scientific Research Engineering and Technology, Vol. 2, Issue 6, 2013, p. 389-392.
-
Zimm V., Zimmerman D. C. Structural damage detection using time-domain periodogram analysis. Structural Health Monitoring, Vol. 8, 2009, p. 125-135.
About this article

This research was supported by the Chung-Ang University Research Scholarship Grants in 2014. This work (Grants No. C0217650) was supported by Business for Cooperative R&D between Industry, Academy, and Research Institute funded Korea Small and Medium Business Administration in 2014.
E. T. Lee and S. W. Park analyzed the experimental results and participated in manufacturing the moving cart. Y. J. Choi provided the acoustic-based algorithm and analyzed the related experimental results. H. C. Eun, Y. J. Ahn and S. G. Lee planed this study, combined the vibration and acoustic-based damage detection algorithm, performed the site test, and analyzed the experimental results.
