Abstract
The paper presents results of a vibroacoustic signal analysis of the unsprung mass in a car actuated by harmonic kinematic vibrations. A passenger car with a hydropneumatic suspension system and standard tires was examined. Different tire pressures were used during the experiments. The authors applied the short time Fourier transform method with superposition of the Hanning windows combined with the zero complement method. With reference to the STFT spectrum, values of the unsprung mass resonance frequency were identified. The results of the experiments described in the publication are particularly useful for the personnel of vehicle service stations, especially that they relate to the effect of tire pressure changes occurring in a vehicle with a hydropneumatic suspension system on the vibration test results.
1. Introduction
Vibroacoustic diagnostics, based on analysis of vibration or acoustic signals perceived as residual processes of non-invasive nature, is becoming more and more important in systems of Structural Health Monitoring (SHM). This problem is particularly important when considering both the application of and the research on new materials and technologies for the automotive industry [1-5]. One may distinguish between two major approaches to detection and positioning of defects in SHM systems, i.e. global and local methods [6-13]. The scope of application of the aforementioned methods as well as their suitability for numerous diagnostic systems also result from the capabilities of advanced methods of signal analysis and identification of numerous characteristics of technical condition.
Diagnostics of technical condition of suspension systems in automotive vehicles allow for the system assessment from the perspective of the vehicle operation safety. For instance, technical condition of shock absorbers affects correct responses of the vehicle under diversified road conditions. This proves to be particularly important in modern cars equipped with a multitude of electronic systems providing assistance in the course of driving, such as ABS or ESP. Owing to correct functioning, these systems require that optimum contact between wheels and road pavement is ensured. Poor technical condition of shock absorbers triggers an increase in the braking distance, both in cars without electronic assistance systems (ABS, ESP) and in those equipped with such functionality. Hence the major importance of appropriate assessment of the suspension system and its technical condition.
The operation of testing stands at vehicle diagnostic stations is based on the forced vibration method [14-20]. They enable approximate assessment of the suspension system’s technical condition, and the operating efficiency of shock absorbers in particular. However, this set of testing methods is not fault less. For instance, results obtained by application of the Eusama method depend to a certain extent on the tire pressure value and the vehicle loading. Therefore, the assessment of the impact exerted by these parameters on the results obtained in vibration testing is extremely important. In the case of hydropneumatic suspension systems, the damping assembly fails frequently (the shock absorber is a gland in the hydropneumatic column cylinder), but even a more frequent defect one may encounter is the loss of gas in the hydropneumatic suspension sphere in the course of the vehicle operation [21-27].
2. Simulation research
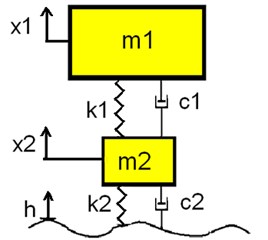
Simplified two-mass(quarter-car) models are often used in the course of research on dynamics of vibrations of a vehicle suspension system. These types of models are sufficient for studying the impact of chosen parameters on the control of suspension properties. A quarter-car model is used in the simulation research of passive suspension systems (mechanical, hydropneumatic, pneumatic) as well as often in simulation of controlled suspension systems (suspension elements with changeable characteristics). Therefore, the quarter-car model was chosen for the analysis of the effect of changeable tire stiffness on the phase magnitude. Sprung () and unsprung () masses are connected by the spring and damping elements. The coil spring is defined by stiffness (k1 coefficient) and the shock absorber is defined by damping ( coefficient). The kinematic force generated by the road roughness is transferred to unsprung masses through the tire, which is defined by stiffness ( coefficient) and damping ( coefficient). The quarter-car model has been presented in Fig. 1.
Fig. 1Quarter-car model
The equation of motion of a quarter-car (Lagrangian) model can be described as follows:
Fig. 2Quarter-car suspension model with linear elasticity and damping characteristics prepared in Mat-lab/Simulink
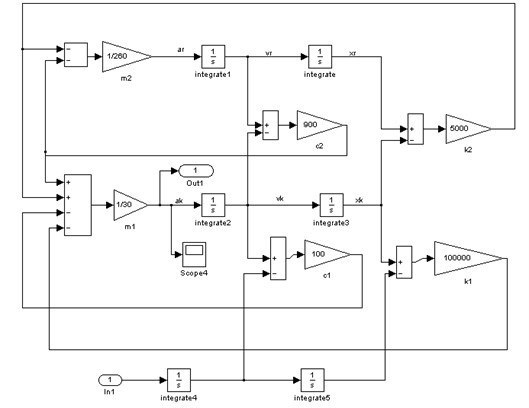
The quarter-car model was created using the Matlab/Simulink software (Fig. 2). The Simulink model was converted into state-space model representations (where A, B, C and D are state matrices). The input signal was simulated as the vibration acceleration of a forced kinematic platform. The output signal was taken as the suspension arm vibration acceleration. It was set according to results of tests conducted on a real car, conducted during the research. This type of simulation is known as a single input, single output (SISO) model.
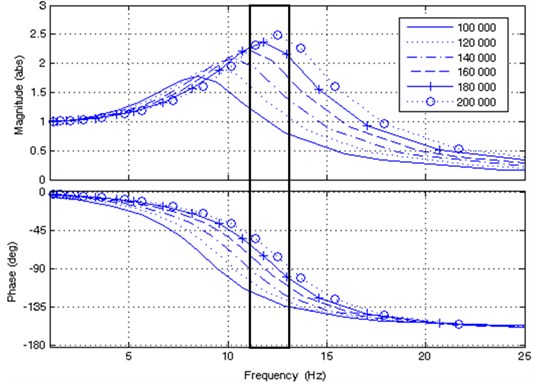
The effect of tire stiffness () on the magnitude was presented as a body diagram in Fig. 3. The scope of the research included studies for different values of the parameter. The value range was set from 100,000 N/m to 200,000 N/m with the gradation step of 20,000 N/m. It should be noted that the increases in resonant frequency and resonance amplitude are proportional to the increase of tire stiffness. Also the phase shift increases, but the phase function form appears similar.
Fig. 3Effect of tire stiffness on phase angle and frequency band (black rectangle)
3. Study of a real object
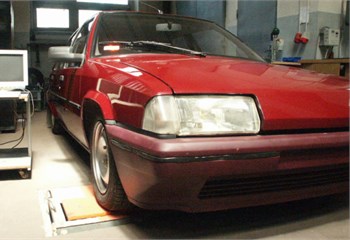
The study of a real object was conducted in the Laboratory of Vehicle Suspension Dynamics at the Faculty of Transport of the Silesian University of Technology. The research object was a passenger car, Citroen BX 14 TGE, with a hydropneumatic suspension system and standard tires (165/70 R14 with nominal pressure of 1.8 [bar]). The front suspension system was based on a McPherson strut. It was an example of a passive hydropneumatic suspension with an option of manual control of the vehicle clearance (Fig. 4). The scope of the study included vibration tests conducted at a harmonic kinematic excitation platform controlled by an inverter with frequency regulation within the range of 0-21 Hz. The car setup for the vibration test has been depicted in Fig. 4.
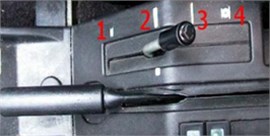
Fig. 4Vibration test of Citroen BX 14 TGE and manual controller of vehicle clearance: 1 – low position, 2 – normal position, 3 – hard position, 4 – service position
Vibration accelerations were measured with sensors connected to the excitation platform, the suspension arm (wheel) and the car body (Fig. 5).
Signals were recorded by means of an analog/digital converter and stored on a computer with the WaveView software installed. A schematic diagram of the measurement system has been presented in Fig. 6.
Fig. 5Locations of vibration sensors during tests
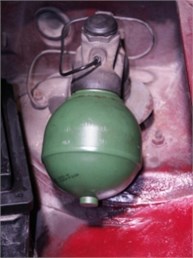
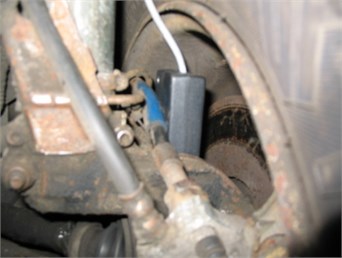
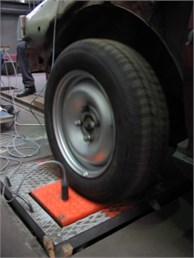
Fig. 6Schematic diagram of the measurement system

4. Analysis of results
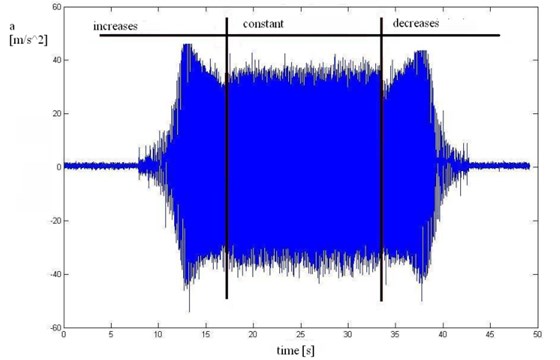
As a result of the studies, vibration signals were collected. An example of the unsprung mass (wheel) acceleration has been presented in Fig. 7. Successive phases of excitation were marked as the increase, constant and decrease of the excitation platform frequency.
Digital signals were analyzed using the MatLab software. The signals were non-stationary, and therefore their processing should be conducted simultaneously in the domains of time and frequency. The short time Fourier transform (STFT) is a simple and effective method widely applied in machine diagnostics [6, 7, 18-20, 22-26]. The STFT result is a 3-dimensional spectrum demonstrating the behavior of the signal amplitude in the time and the frequency domain.
The short time Fourier transform equation is as follows:
where: () – window width.
The STFT algorithm is as follows. A frequency analysis is conducted by application of the Fast Fourier Transformation (FFT) for consecutive fractions of the signal multiplied by the window function with a constant width of . These consecutive fractions are analyzed independently. The main disadvantage of this method is the constant window width. For example, when using a narrow window in the time domain, one can obtain good time resolution, however, the resolution deteriorates in the frequency domain. For a rectangular window, the jump function changes at the beginning and at the end of windows, being the source of spectral leakage. In order to minimize effects of this kind, other windows are often used (e.g. triangular, Hanning, Hamming types) [6, 7].
Consequently, the window width is treated as a compromise between resolutions in the time and the frequency domain.
In order to improve the resolution in the frequency domain, one can apply the zero complement method. It consists in adding samples with a zero value of amplitude to the original signal in order to multiply the number of signal samples.
The next method of improving the selectivity of the STFT method is superposition of windows (each sample is used several times for a single FFT process).
Fig. 7Time course of wheel vibration accelerations
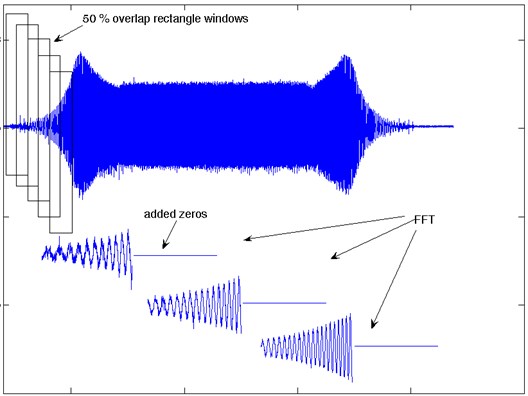
This paper provides some results of studies of the unsprung mass vibration accelerations. For purposes of the signal processing, the STFT method was used in combination with the Hanning window. Each window of the signal was 100 % elongated using the zero complement method and then analyzed by way of the FFT process. The windows were overlapping in 50 % (Fig. 8).
Fig. 8STFT procedure with overlapping and with added zeros
The impact of window overlapping and adding zeros has been shown in Fig. 9. It can be noticed that using overlapping windows and adding zeros increase the precision in determination of individual spectral components of the STFT spectrogram. The zero-adding directly affects the frequency resolution spectra of individual components. In contrast, the overlapping of windows makes it possible to make the clear thresholds of transition between these spectra smoother. In the end, the operations applied by the authors allowed them to determine the smoothed STFT spectrograph, particularly for purposes of further analysis of a specific frequency band selection.
Fig. 9a) STFT procedure without overlapping and added zeros and b) with overlapping and added zeros
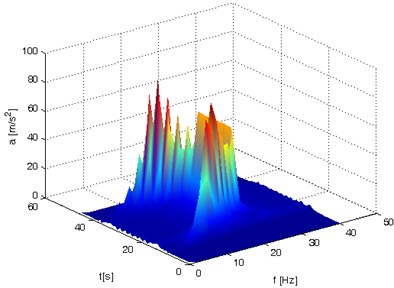
a) time window = 0.5 s, resolution 2.008 Hz
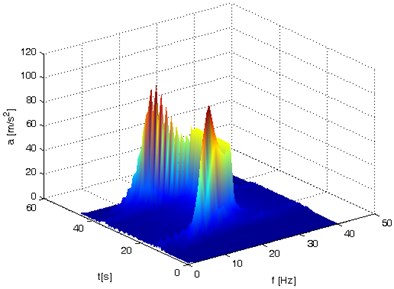
b) time window = 0.5 s, resolution 1.002 Hz
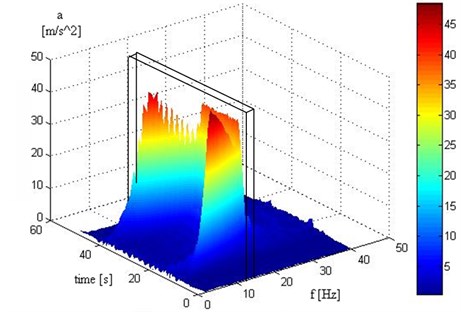
Consequently, an STFT spectrum with the resolution of 1 Hz was obtained in the frequency domain. This representation of the signal allows for isolating the frequency band (Fig. 10) with resonance phenomena. The middle of the frequency band was 12 Hz, and the frequency band width was 3 Hz.
Fig. 10Example of STFT spectrum with the mid-frequency of 12 Hz marked
The time distribution of the STFT limited to the resonant frequency band (11-13 Hz) has been presented in Fig. 11. These functions make it possible to observe changes of amplitude values in time for a strictly pre-defined frequency band.
Fig. 11Time distribution of STFT limited to the resonance frequency band
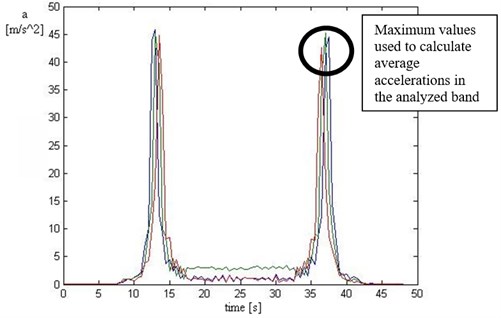
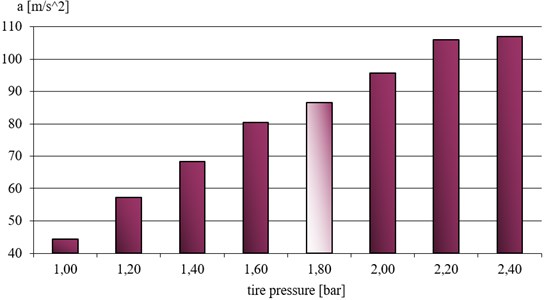
For the analysis of the effect of tire stiffness on the vehicle vibration, average values of maximum acceleration amplitudes were calculated. The studies entailed two vehicle clearance values (normal and high position). The results obtained for the normal and the hard position of the hydropneumatic suspension system were compared. These results have been presented in the figures below, separately for the normal (Fig. 12) and the hard position (Fig. 13) of the hydropneumatic suspension system.
Fig. 12Average accelerations in the analyzed band in the tire pressure function; vehicle clearance in “normal position”
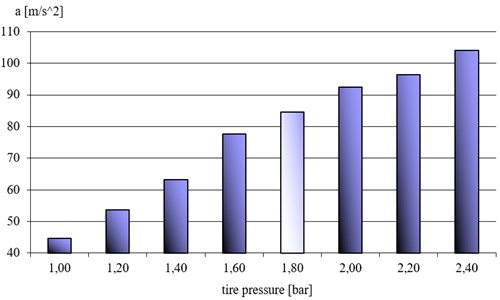
Fig. 13Average accelerations in the analyzed band in the tire pressure function; vehicle clearance in “hard position”
A shift in the unsprung mass resonance frequency caused by changing the tire stiffness triggers amplitude changes in the analyzed frequency band (11-13 Hz).
5. Conclusions
The results obtained by the authors, based on the vibration signal analysis method proposed, imply the following conclusions. An increase in tire pressure (and the resulting increase in the tire stiffness value) increases the vibration acceleration amplitude within the frequency band analyzed. This interdependence applies to both the normal position of the hydropneumatic suspension system as well as the hard position. Consequences of the tire pressure are both an increase in the resonant amplitude value and a shift of the unsprung mass resonant frequency towards higher values. Assuming a constant frequency analysis window enables preliminary assessment of correctness of the tire pressure value, which may prove particularly important when vibration testing is conducted in order to assess the technical condition of suspension systems of this type. The results of the experiments described in the publication are particularly useful for the vehicle service station personnel.
References
-
Bajda A., Laskowski D., Wrazen M. Diagnostics the quality of data transfer in the management of crisis situation. Przeglad Elektrotechniczny, Vol. 87, Issue 9A, 2011, p. 72-78.
-
Slania J., Wegrzyn T., Silva A. P. Process Stability Evaluation of Manual Metal Arc Welding Using Digital Signals. Advanced Materials Forum VI, Book Series: Materials Science Forum, Vol. 730, 732, p. 847-852.
-
Lisiecki A. Welding of thermomechanically rolled fine-grain steel by different types of lasers. Archives of Metallurgy and Materials, Vol. 59, Issue 4, 2014, p. 1625-1631.
-
Radwański K., Wrożyna A., Kuziak R. Role of the advanced microstructures characterization in modeling of mechanical properties of AHSS steels. Materials Science and Engineering A, Vol. 639, 2015, p. 567-574.
-
Radwański K. Application of FEG-SEM and EBSD methods for the analysis of the restoration processes occurring during continuous annealing of dual-phase steel strips. Steel Research International, Vol. 30, 2015.
-
Dąbrowski Z., Deuszkiewicz P. Designing of high-speed machine shafts of carbon composites with highly nonlinear characteristics. Key Engineering Materials, Vol. 490, 2011, p. 76-82.
-
Grządziela A., Analysis of vibration parameters of ship gas turbine engines. Polish Maritime Research, Vol. 2, 2006, p. 22-26.
-
Dąbrowski D., Cioch W. Neural classifiers of vibroacoustic signals in implementation on programmable devices (FPGA) – comparison. Acta Physica Polonica A, Vol. 119, Issue 6A, 2011, p. 946-949.
-
Dąbrowski D., Jamro E., Cioch W. Hardware implementation of artificial neural networks for vibroacoustic signals classification. Acta Physica Polonica A, Vol. 118, Issue 1, 2010, p. 41-44.
-
Wieczorek A. Effects of construction changes in the teeth of a gear transmission on acoustic properties. International Journal of Occupational Safety and Ergonomics, Vol. 18, Issue 4, 2012, p. 499-507.
-
Klaczynski M., Wszolek T. Artificial intelligence and learning systems methods in supporting long-term acoustic climate monitoring. Acta Physica Polonica A, Vol. 123, Issue 6, 2012, p. 1024-1028.
-
Klaczynski M. Identification of aircraft noise during acoustic monitoring by using 3D sound probes. Acta Physica Polonica A, Vol. 125, Issue 4, 2014, p. 144-148.
-
Dabrowski Z., Zawisza M. Investigations of the Vibroacoustic signals sensitivity to mechanical defects not recognised by the OBD system in diesel engines. Solid State Phenomena, Vol. 180, 2012, p. 194-199.
-
Burdzik R., Konieczny Ł. Diagnosing of shock absorbers of car vehicles at changeable pressure in tires. Diagnostyka, Vol. 3, Issue 51, 2009, p. 27-32.
-
Burdzik R., Konieczny Ł. Application of vibroacoustic methods for monitoring and control of comfort and safety of passenger cars. Solid State Phenomena, Vol. 210, 2014, p. 20-25.
-
Dixon J. C. The Shock Absorber Handbook. Society of Automotive Engineers Inc., Warrendale, PA, 1999.
-
Dixon J. C. Tires, Suspension and Handling, 2nd Ed. Society of Automotive Engineers, Inc., Published by Warrendale, Pennsylvania, USA, 1996.
-
Jazar R. N. Vehicle Dynamics: Theory and Applications. Springer Science +Business Media, LLC, 2008.
-
Konieczny Ł., Burdzik R. Comparison of characteristics of the components used in mechanical and non-conventional automotive suspensions. Solid State Phenomena, Vol. 210, 2014, p. 1012-394.
-
Wang Z., Yu Z., Li K. Research of automobile tire vertical stiffness optimization method on the basis of ADAMS/Car. Key Engineering Materials, Vol. 561, 2013, p. 527-532.
-
Bauer W. Hydropneumatic Suspension Systems. Springer-Verlag, Berlin, Heidelberg, 2011.
-
Cao D. P., Rakheja S., Su C. Y. Roll plane analysis of interconnected hydro-pneumatic suspension struts. Proceedings of the ASME Design Engineering Division, 2005, p. 133-142.
-
Els P. S., Theron N. J., Uys P. E., Thoresson M. J. The ride comfort vs. handling compromise for off-road vehicles. Journal of Terramechanics, Vol. 44, Issue 4, 2007, p. 303-317.
-
Els P. S., Grobbelaar B. Heat transfer effects on hydropneumatic suspension systems. Journal of Terramechanics, Vol. 36, Issue 4, 1999, p. 197-205.
-
Giliomee C. L., Els P. S. Semi-active hydropneumatic spring and damper system. Journal of Terramechanics, Vol. 35, Issue 2, 1998, p. 109-117.
-
Konieczny Ł., Burdzik R., Figlus T. Possibility to control and adjust the suspensions of vehicles. Communications in Computer and Information Science, Vol. 395, 2013, p. 378-383.
-
Lv B. Z., Hu A. J., Zhu S. H. Research on Characteristics of Damping Force of Hydro-Pneumatic Suspension. History of Mechanical Technology and Mechanical Design. Book Series: Applied Mechanics and Materials, Vol. 42, 2011, p. 303-306.
About this article

