Abstract
Reinforced concrete shear wall is one of the most effective members during severe lateral loads especially in earthquakes and winds. Extensive researches, both analytical and experimental, have been carried out to study the behavior of reinforced concrete (RC) shear walls. Predicting inelastic response of RC walls and wall systems requires accurate, effective, and robust analytical model that incorporate important material characteristics and behavioral response features. In this study, a modeling method using fiber and spring elements is developed to capture inelastic responses of an RC shear wall. The fiber elements and the spring reflect flexural and shear behaviors of the shear wall, respectively. The fiber elements are built by inputting section data and material properties. The parameters of the shear spring that represent strength and stiffness degradation, pinching, and slip are determined based on analysis results from a detailed finite element method (FEM) model. The reliability of the FEM analysis program is verified. The applicability of the proposed modeling method is investigated by performing inelastic dynamic analyses for reference buildings with various aspect ratios of shear walls.
1. Introduction
Reinforced concrete shear walls have been widely used as essential structural elements in seismic design of buildings due to their high stiffness and strength in lateral actions. The seismic performance of a building is greatly influenced by the inelastic behavior of a shear wall which carries a large portion of the lateral forces. Extensive researches, both analytical and experimental, have been carried out to study the behavior of RC walls [1-3]. While investigating the inelastic response of a shear wall by an experimental method provides the most reliable results, this is not a viable option for generic cases. Detailed FEM also can provide a reliable estimation of inelastic responses of shear walls. However, the application of the detailed FEM analysis is limited to member levels due to the excessive time and effort to perform the modeling and analyses [4]. Using fiber elements can greatly reduce the time and effort for the inelastic analysis and thus, the method is applicable for an entire building. However, the use of fiber elements is limited to structural members governed by flexural responses [5]. In order to overcome the limitations of the above modeling methods, in this study, using a fiber-spring element is proposed for a RC shear wall modeling where an inelastic spring is added to fiber elements. The properties of the inelastic spring are determined by the analysis results of the detailed FEM model of the shear wall. While this method also needs to perform a detailed FEM analysis, the method is still an efficient method to build an inelastic model of an entire building with shear walls on all stories. Additionally, the proposed method makes it possible to do seismic performance assessment for a shear wall building where many number of inelastic dynamic analyses for a structural model are repeatedly carried out.
2. Shear wall modeling
In this study, a shear wall is modelled by using a set of fiber elements and an inelastic spring to reflect flexural and shear behaviors, respectively (Fig. 1(a)). The shear spring represents the interrelationship between shear force and top displacement of a shear wall, and is defined by a trilinear loading and bilinear unloading paths as shown in Fig. 1(b). The spring model is formulated in OpenSees [6] program as Pinching4 [7] element and appropriate to simulate slip and pinching of RC walls with stiffness and strength degradation due to cyclic loadings. The parameters of the shear spring are determined by observing the differences in the force-displacement relationship between the detailed FEM model and the fiber element model. This method is based on the assumption that the detailed FEM model is capable of representing the inelastic force-displacement relationship of flexure and shear behavior accurately. The MCFT (Modified Compression Field Theory) Model [8] in VecTor2 [9] program is adopted to build detailed FEM analysis models to produce a set of accurate simulation results for determining the shear spring parameters.
The cracking strength of the VecTor2 analysis result is used to determine the points 1 and 5 in Fig. 1(b). Similarly, the shear strength is used for the points 2 and 6; the failure displacement of the shear wall is for points 3 and 7. The strength for the post failure points 4 and 8 is assumed to be 1/10 of the shear strength. Parameters to represent pinching, slip, and stiffness and strength degradation are determined to fit the force-displacement curve to the one produced by the detailed FEM model of VecTor2. The force-displacement curves obtained by the VecTor2 FEM model and by the combination of shear spring and fiber element are compared in Fig. 2. The agreements between the two curves are good and this shows that the proposed fiber-spring element modeling in this study can represent the overall response of shear walls modeled by the detailed FEM method using VecTor2 program. The reliability of the latter FEM model is investigated by comparing the analysis results with experimental results in Section 3. LSW1 and MSW1 are the specimen names used in the comparison.
Fig. 1Fiber-spring element model and inelastic shear spring
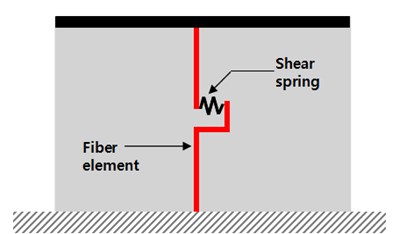
a) Fiber-spring element model
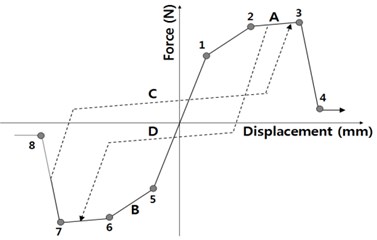
b) Hysteretic response curve of shear spring
Fig. 2Comparisons between force-displacement curves obtained by the detailed finite element analysis models and the fiber-spring model
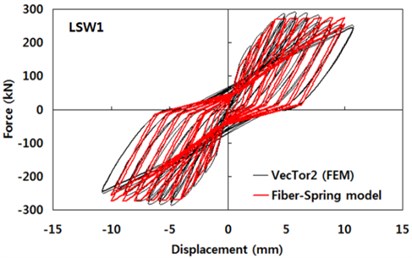
a) Analysis result of LSW1
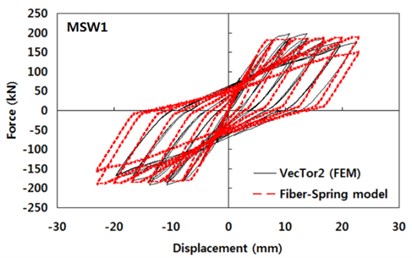
b) Analysis result of MSW1
3. Verification of the detailed FEM model
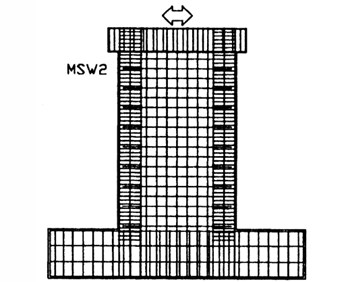
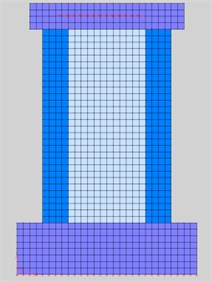
The fiber-spring element model proposed in this study is dependent on the force-displacement relationship determined by the detailed FEM analysis. Therefore, it is important to verify that the FEM analysis result is accurate and reliable. The simulated results should be able to capture the complicated responses of a RC shear wall including combined flexure and shear, sliding and pinching to replace the experimental results. The reliability of the detailed FEM analysis results is investigated by comparing experimental results in literature [10, 11] with the VecTor2 simulation results as shown in Fig. 3. The test specimens used for this verification are represented in Table 1.
Fig. 3Example of a test specimen and the corresponding FEM model by VecTor2 program
a)
b)
Table 1Comparison of the experimental and analytical results of test specimens
Specimen | Asp. ratio | (MPa) | Reinforcement percentage (%) | Axial load (kN) | Maximum base shear (kN) | Error (%) | ||||
Web | Boundary element | |||||||||
Test | VecTor2 | |||||||||
Ver. | Hor. | Ver. | Hor. | |||||||
LSW1 | 1.0 | 22.2 | 0.565 | 0.565 | 1.700 | 1.700 | – | 262 | 283 | 8.0 |
LSW2 | 21.6 | 0.277 | 0.277 | 1.300 | 1.700 | – | 191 | 201 | 5.2 | |
LSW3 | 23.9 | 0.277 | 0.277 | 1.300 | 1.700 | 200 | 268 | 276 | 3.0 | |
MSW1 | 1.5 | 26.1 | 0.565 | 0.565 | 1.700 | 1.100 | – | 197 | 192 | 2.5 |
MSW2 | 26.2 | 0.277 | 0.277 | 1.300 | 1.100 | – | 124 | 131 | 5.6 | |
MSW3 | 24.1 | 0.277 | 0.277 | 1.300 | 1.100 | 200 | 176 | 190 | 8.0 | |
SW4 | 2.0 | 36.9 | 0.390 | 0.500 | 6.850 | 0.790 | – | 104 | 108 | 3.8 |
SW6 | 38.6 | 0.310 | 0.500 | 6.850 | 0.660 | – | 108 | 116 | 7.4 | |
SW7 | 32.0 | 0.390 | 0.590 | 12.74 | 0.790 | – | 127 | 120 | 5.5 | |
Note: – concrete compressive strength | ||||||||||
Experimental results for specimens with aspect ratio of 1.0 and 1.5 are obtained from [10]. LSW1 specimen has 2.0 times and 1.3 times more reinforcement in webs and boundary elements, respectively, than LSW2 and LSW3 specimens. The reinforcement ratios of LSW2 and LSW3 are the same. The only difference between the latter two specimens is the axial force of 200 kN in LSW3. MSW specimens have an aspect ratio of 1.5 and categorized as the same as LSW specimens. The width and thickness of the LSW and MSW are 1,200 mm and 100 mm, respectively. The heights of LSW and MSW are 1,200 mm and 1,800 mm, respectively. Experimental results of specimens with aspect ratio of 2.0 are obtained from [11]. The width, height and thickness of the SW specimens are 600 mm, 1200 mm and 60 mm, respectively. The SW7 specimen has more vertical reinforcement in the boundary element than SW4 and SW6. The analysis models of VecTor2 have webs and boundary elements that have exactly the same dimension of those of the test specimens. Inelastic material models in [12] and [13] are used for concrete and reinforcing steel, respectively. Additional details on the test specimens are given elsewhere [10, 11]. The differences in maximum strength of shear walls between the experimental results and VecTor2 analysis results are less than 10 % as shown in Table 1. This shows that the force-displacement relationship obtained from the detailed FEM model in this study is reliable and can replace the experimental result in determining the shear spring parameters.
4. Application of the fiber-spring element to shear wall modeling
A set of inelastic dynamic analyses were performed to investigate the applicability of the fiber-spring element. The plan and elevation of the reference buildings are shown in Fig. 4. Dimension of the plan is 15 m×20 m and the story height is 3 m. External columns are connected to each other by perimeter beams, and internal spans are waffle slabs. The width of a shear wall for each story is the same as the story height, which makes the number of stories of the building the same as the aspect ratio of the shear. OpenSees program was used for the reference analysis. The program is capable of representing the spread of inelasticity by the fiber approach and inelastic behaviors using many types of spring elements. The accuracy of the program has been verified elsewhere [14].
Fig. 4Plan, elevation and modeling element of the reference building
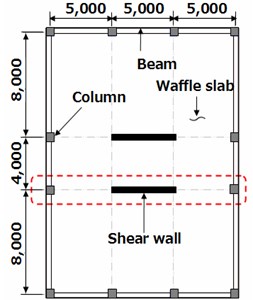
a) Plan
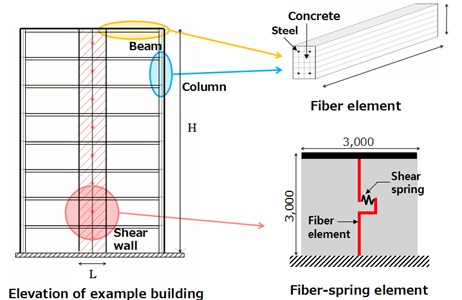
b) Elevation and modeling elements
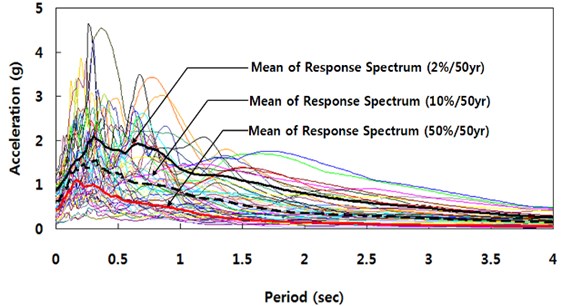
Fig. 5Elastic response spectrum (damping ratio: 5 %)
The inelastic response of the cross-section is assembled from contributions of individual fibers for which inelastic cyclic material constitutive relationships are employed. For concrete, a uniaxial constant confinement concrete model [15] was chosen. Stiffness and strength degradations of the stress-strain curve due to cyclic loading are modeled [16]. Bi-linear stress-strain relationship is used for steel. Compressive strength of concrete and yield strength of steel are assumed to be 33 MPa and 585 MPa, respectively. Material models for concrete and steel are summarized in Table 2. In order to reflect the effect of axial force on the force-displacement relationship, determination of the axial force on the shear wall and parameters of the shear spring are performed for each story, as represented in Fig. 4(b).
Table 2Comparison of the experimental and analytical results of test specimens
Material model | Concrete | Steel | ||
Stress-strain envelope curve [15] | Stress-strain hysteretic response – Bilinear | |||
Stress-strain hysteretic path [16] | ||||
Material properties | Compressive strength | 33 MPa | Yield strength | 585 MPa |
Elastic modulus | 5,000 MPa | Young’s modulus | 200,000 MPa | |
Confinement factor | 1.3 [15] | Post-yield stiffness ratio | 0.0085 | |
The aspect ratio of the shear wall is considered as the main parameter of analytical study. The portion of the flexural response in the total response of the shear wall is expected to increases as the aspect ratio of the shear wall increases. The aspect ratio of the shear wall is the same as the number of stories. For buildings with eight aspect ratios from 1 to 8, the effect of shear responses on the total displacement is investigated. Additionally, the effect of the depth of the connection beam on the shear response of the shear wall is investigated, by varying the depth of the connection beams as 300, 600 and 900 mm. The reference simulations of the buildings were carried out using earthquake record sets [17] developed for the SAC steel project. The record sets were assembled to represent different hazard levels for Los Angeles, three hazard levels (2, 10 and 50 % probability of exceedance in 50 years) are considered. Each set of the hazard level consists of twenty accelerograms. Fig. 5 shows the 5 %-damped acceleration response spectra of the three record sets with different hazard levels and the mean of each set.
Fig. 6Roof drift ratio time histories of the 8 story buildings modeled by fiber element only and fiber-spring element
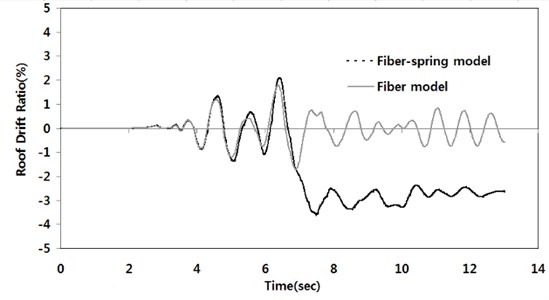
Fig. 6 shows the comparison of roof drift ratios obtained from the two different modeling approaches; using fiber elements only and using fiber-spring elements for shear walls. The reference simulation is performed on the 8 story example building models under the ground motion of 2 % probability of exceedance in 50 years. The additional displacement of the fiber-spring model shown in Fig. 6 is the result of shear yield and shear failure of the core wall which cannot be represented in the analytical model using the fiber element only.
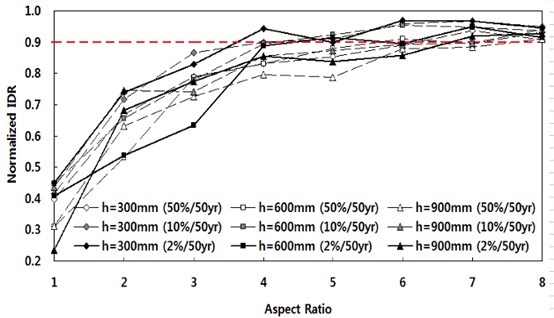
The applicability of the proposed fiber-spring model is examined to replace the fiber model in representing the seismic response of buildings with various aspect ratios of shear walls. Fig. 7 shows the normalized IDR (interstory drift ratio) as functions of the aspect ratio of the shear wall and the depth of the connection beams. Normalized IDR is the ratio of the maximum interstory drift of the fiber model to the maximum interstory drift of the fiber-spring model. As the normalized IDR becomes closer to unity, the modeling error in representing shear responses is getting smaller. Fig. 7 shows that the aspect ratio governs the difference between the two modeling methods. The effects of the beam depth and the earthquake intensity are insignificant. It is observed that the error of the fiber model becomes less than 10 %, if the aspect ratio is 8. This is due to the fact that the portion of shear deformation in the total response of the shear wall reduces as the aspect ratio of the shear wall increases. The above discussion indicates that shear walls with aspect ratio less than 8 are recommended to be modeled using not only the fiber element but also the shear spring element. Shear walls with aspect ratio more than 8 may be modeled by fiber element only in cases where less than 10 % error in the seismic response estimation is allowed.
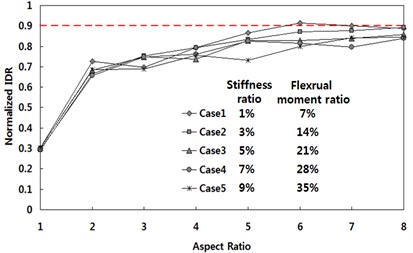
The effect of the depth of the connection beam on the response of the shear wall is investigated by normalizing the stiffness and strength of the connection beam relative to those of the shear wall. The flexural stiffness ratio is defined as the ratio of the flexural stiffness of the connection beam to that of the shear wall. The flexural strength ratio is defined as the ratio of the flexural strength of the connection beam to that of the shear wall. The flexural strength is calculated as per the nominal strength equation given in ACI 318-14 [18]. The flexural stiffness () is calculated as follows:
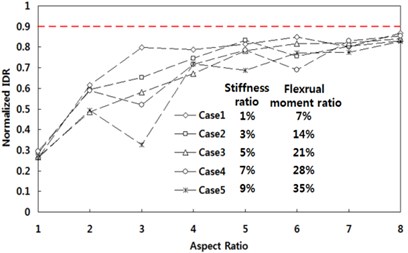
where, and are moduli of elasticity of concrete and rebar, respectively. is the moment of inertia for the gross section, is the moment of inertia for rebar about the centroid of the section, Ln is the clear span of the connection beam or clear story height of the shear wall. Five connection beams with different flexural stiffness ratios of 1 %, 3 %, 5 %, 7 % and 9 % are designed for this study, which correspond to flexural strength ratios of 7 %, 14 %, 21, 28 % and 35 %, respectively.
Fig. 7Relationship between aspect ratios and normalized IDRs
Comparisons of the maximum interstory drift ratios between the fiber element and fiber-spring element models are represented as the normalized IDR in Fig. 8. The normalized IDR becomes close to unity as the aspect ratio increases. There is no clear trend in the variance of the normalized IDR for different flexural stiffness or strength ratios, which implies that the effect of the relative stiffness and strength of the connection beam on the response of the shear wall is insignificant. The differences and variations in the interstory drift ratios between the two modeling approaches from the ground motion set of the 50 % in 50 years hazard level (Fig. 8(a)) are larger than the differences from the 2 % in 50 years record set (Fig. 8(b)). This is due to the fact that the measured interstory drift from the 50 % in 50 years record set is very small, therefore, the natural randomness in earthquake records is magnified in calculating the normalized IDR which is the relative comparison measure.
Fig. 8Normalized IDR for various flexural stiffness and strength ratios
a) 50 % in 50 years
b) 2 % in 50 years
5. Conclusion
While the fiber element is an efficient modeling component to represent inelastic response of structural members in seismic analysis of buildings, its application is generally limited to responses governed by flexure. Therefore, the accuracy of the fiber element modeling method decreases as the portion of shear deformation in the total response increases. In order to overcome this limitation of the fiber element, in this study, a modeling method to reflect the inelastic deformation of an RC shear wall by adding a spring element is proposed. The fiber-spring element model uses the analysis results obtained by VecTor2 FEM models. Determining the parameters of the inelastic spring element based on the detailed FEM analysis results is discussed and the reliability of the FEM analysis program is verified. It is shown that the proposed method can accurately represent pinching, energy dissipation, overall response of shear walls by comparing the analysis result with the test results.
The applicability of the proposed modeling method is investigated by performing inelastic dynamic analyses for reference buildings with various aspect ratios of shear walls. The analysis results obtained by the fiber element and the fiber-spring element are compared and the differences between the two models are quantitatively investigated. The aspect ratio governs the difference between the two modeling methods and the effect of connection beam stiffness and ground motion intensities are insignificant. For shear walls with aspect ratio more than 8, the fiber element model has less than 10 % error in response estimation because the portion of flexural deformation in the total response of the shear wall governs as the aspect ratio of the shear wall increases. Shear walls with aspect ratio less than 8 should be modeled using the inelastic spring element in the fiber model to properly represent the shear deformation.
References
-
Kabeyasawa T., Shiohara H., Otani S., Aoyama H. Analysis of the full-scale seven-story reinforced concrete test structure. Journal of the Faculty of Engineering, The University of Tokyo, Vol. 37, Issue 2, 1983, p. 431-478.
-
Linde P., Bachmann H. Dynamic modelling and design of earthquake-resistant walls. Earthquake Engineering and Structural Dynamics, Vol. 23, Issue 12, 1994, p. 1331-1350.
-
Vulcano A., Bertero V. Analytical Modeling for Predicting the Lateral Response of RC Shear Wall. Evaluation of Their Reliability, EERC, Report No. UBC/EERC-87/19, 1987.
-
Ji J., Elnashai A. S., Kuchma D. A. Seismic Fragility Assessment for Reinforced Concrete High-Rise Buildings. Report 07-14, Mid-America Earthquake Center, University of Illinois at Urbana-Champaign, 2007.
-
Elnashai A. S., Mwafy A. M. Overstrength and force reduction factors of multistory reinforced-concrete buildings. The Structural Design and Tall Buildings, Vol. 11, Issue 5, 2002, p. 329-351.
-
Open System for Earthquake Engineering Simulation. Pacific Earthquake Engineering Research Center, University of California, Berkeley, California, 2004.
-
Lowes L. N., Mitra N., Altoontash A. A Beam-Column Joint Model for Simulating the Earthquake Response of Reinforced Concrete Frames. PEER Report 2003/10, Pacific Earthquake Engineering Research Center, University of California, Berkeley, California, 2004.
-
Vecchio F. J., Collins M. P. The modified compression field theory for reinforced concrete element subjected to shear. ACI Structural Journal, Vol. 83, Issue 2, 1986, p. 219-231.
-
Vecchio F. J. Nonlinear finite element analysis of reinforced concrete membranes. ACI Structural Journal, Vol. 86, Issue 1, 1989, p. 26-35.
-
Salonikios T. N., Kappos A. J., Tegos I. A., Penelis G. G. Cyclic load behavior of low-slenderness reinforced concrete wall: design basis and test results. ACI Structural Journal, Vol. 87, Issue 1, 1990, p. 649-660.
-
Pilakoutas K., Elnashai A. S. Cyclic behavior of reinforced concrete cantilever walls, part 1: experimental results. ACI Material Journal, Vol. 92, Issue 3, 1995, p. 271-281.
-
Popovics S. A numerical approach to the complete stress strain curve for concrete. Cement and Concrete Research, Vol. 3, Issue 5, 1973, p. 583-599.
-
Seckin M. Hysteretic Behavior of Cast-in-Place Exterior Beam-Column-Slab Subassemblies. Doctoral Thesis, University of Toronto, Toronto, Canada, 1981, p. 266.
-
Kanvinde A. M. Methods to evaluate the dynamic stability of structures-shake table tests and nonlinear dynamic analyses. Earthquake Engineering Research Institute Paper Competition Winner, Proceedings of EERI Meeting, Portland, Oregon, 2003.
-
Mander J. B., Priestley M. J. N., Park R. Theoretical stress-strain model for confined concrete. Journal of Structural Engineering, Vol. 114, Issue 8, 1988, p. 1804-1825.
-
Karsan I. D., Jirsa J. O. Behavior of concrete under compressive loading. Journal of Structural Division ASCE, Vol. 95, Issue ST12, 1969.
-
Somerville P., Smith N., Puntamurthula S., Sun J. Development of Ground Motion Time Histories for Phase 2 of the FEMA/SAC Steel Project. SAC Background Document SAC/BC-97/04, SAC Joint Venture, Richmond, CA, 1997.
-
Building Code Requirements for Structural Concrete (ACI 318-14). ACI Committee 318, American Concrete Institute, Farmington Hills, MI, 2014.
Cited by
About this article

This research was supported by Basic Science Research Program through the National Research Foundation of Korea funded by the Ministry of Education (NRF-2014R1A1A2056160) and by Inha University Research Grant.
