Abstract
This study aims to characterize and standardize the Sarasvati Veena of South India. The instrument is very unique in the way in which it is manufactured and played. This instrument is often tuned relative to the accompanying instruments. The aim of the study was to find out the optimum tuning frequency for a particular Veena. The natural frequency of the body of the Veena was determined by conducting an impact test. The strings of the Veena were tuned to the corresponding body frequency to obtain resonance and FFT plots were generated to see the frequency variation. The optimum tuning frequency for a given Veena was obtained such that the body undergoes conductive resonance when tuned to that particular frequency. Acoustic readings were taken using a sound level meter to confirm on the results obtained by impact test.
1. Introduction
Sarasvati Veena is well known stringed musical instrument used in Carnatic classical music, which has its origin in South India. The instrument is named after Sarasvati, the Goddess of learning and arts. The Veena often leads the concert and is rarely used as accompaniment.
Fig. 1Sarasvati Veena

The Veena is a fretted instrument, with strings which, when excited by plucking, give a powerful and rich timbre. The unique curvature of the broad bridge and the resonating wood cavity account for the unique tone of the instrument [1]. The Sarasvati Veena has 7 strings, of which 4 are main strings and 3 drone strings.
The main strings are tied to opposite ends, over the bridge, ‘kudirai’ and nut, ‘meru’ (the upper bridge).
The body of the Veena is made of jack wood, and it has 24 frets made of bell metal (a brass-like alloy) set into wax on the neck. The bridge and the nut are also of the same metal. The playing length of the Instrument is about 83 cm and plucking point is about 0.17 of the string length from the main bridge. Veena can be carved out from a single piece of wood, while there are ones which are carved out as three separate parts; neck, head and resonator. Another hollow stand or ‘surakkai’ provides support to the instrument in its playing position.
The artisans who make the instrument, use their ear to analyze the sound, and make judgments regarding the tone quality when the instrument is being made. Accordingly, they make minor changes structurally. For instance, one would assume the resonating column to be perfectly hollow inside while it is not. Manufacturers remove the material from the inside of the resonator to get what they believe to be the best tone of the Veena.
The instrument is tuned with the help of 7 wooden tuning pegs on which each string is wound. The four main strings pass over the ‘kudirai’ and ‘meru’ and they are further wound on to the tuning pegs which are placed through the wooden frame on the head. Three drone strings pass over a separate curved metal bridge and are wound directly on to the tuning pegs on the neck. The tuning tension of the strings varies as we rotate the pegs in the desired direction.
The aim of this paper is to characterize the instrument and throw light on its vibro-acoustics scientifically. The first scientific study of this instrument was by C. V. Raman [1] in 1922. We find that western stringed instruments such as the violin, the guitar, and the piano and some North Indian stringed instruments such as the sitar and Rudra Veena have been analysed in technical papers, but the South Indian Sarasvati Veena seems to have been neglected. Ours is the first step to close this gap. We have published some preliminary studies in this direction in our earlier work [8].
2. Tuning of the instrument
We refer to the four main strings as S1, S2, S3 and S4 whereas the drone strings are referred as T1, T2 and T3 as shown in Fig. 2. The tuning of the strings is shown in Table 1.
Veena so that it resonates with the body and gives the richest tone possible.
Table 1Tuning of the strings and their corresponding notation in Carnatic Music
String name | Corresponding note in Carnatic Music Notation | Tuning frequency in terms of ‘f’ |
S1 | Sa | f |
S2 | Pa* | 0.75f |
S3 | Sa* | 0.5f |
S4 | Pa** | 0.375f |
T1 | Sa | f |
T2 | Pa | 1.5f |
T3 | Sa* | 2f |
The ‘*’ sign denotes the octave number of the note. Subscript and superscript denote the lower and higher octaves respectively. We aim to evaluate the fundamental frequency ‘f’ for a particular | ||
3. Experimentation
The experiments involved applying impact to the resonant cavity on its upper plate at fixed locations and recording the response at different locations using an accelerometer. They were conducted in semi-anechoic chamber in the studio room of BITS Pilani K. K. Birla Goa Campus, at a constant ambient temperature of 23 °C and the data was recorded using the vibration analyzer Spider-81 of Crystal Instruments [2]. The Spider-81 acts as a complete vibration data acquisition system while Engineering Data Management software is used for analysis of data.
The accelerometer used in the readings is the 352C34 of PCB Piezotronics, which has a sensitivity of 101.3 mV/g [3]. It was mounted at certain locations on the resonating cavity of the Veena, to get local readings so as to check for variation and to average out readings.
The Impact hammer with a plastic tip [4], of sensitivity 10 mV/lbF was used to standardize impact and make sure no variation was present in the readings.
The acoustic analysis was conducted using the 377B02 microphone (PCB Piezotronics) of sensitivity 50.21 mV/Pa [5].
Acoustic data was also gathered and the FFT analysed, using the Larson Davis Sound Level Meter [6] for a frequency Span of 1 kHz and block size of 6400. Comparison of acoustic and vibration data was then carried out.
Fig. 2Resonating column and strings
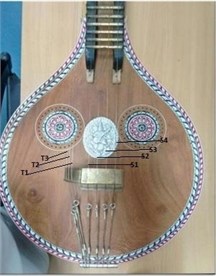
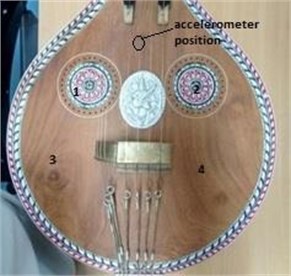
Fig. 3Octave analysis impact points
4. Experimental results
4.1. Octave analysis
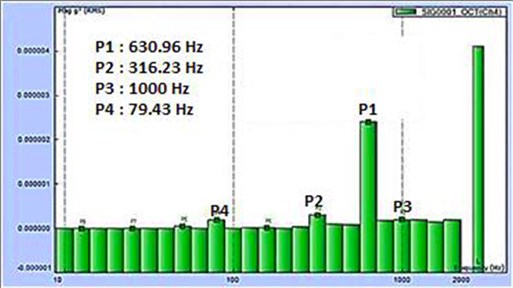
A preliminary step to determine the natural frequency of the system, Octave Analysis of the vibration spectrum gives us the average amplitude over a range of frequencies which contains the natural frequency. An accelerometer is mounted on the center of the resonating column and impact is given on one of the four locations (marked 1, 2, 3, 4) as shown in Fig. 3. The four readings are averaged out to obtain the final amplitude vs frequency plot Fig. 4.
Fig. 4 shows significant peaks around the frequency ranges 300, 600 and near to 1000 Hz. From this we infer that the natural frequency could be close to 300 Hz, since we are getting peaks at multiples of 300 Hz.
Fig. 4Octave analysis
4.2. Auto Power Spectra (APS)
The APS is directly representative of the power distribution over a band of frequencies in the system, which can be used in practice to determine what frequency of vibrations to supply this system to produce a response of the highest amount of power. APS shows Frequency on the axis and Amplitude on the axis.
APS as shown in Fig. 5 shows two prominent peaks at 300 and 600 Hz in agreement with octave analysis. But the peak at 300 Hz is the dominant peak.
4.3. Impact test on the resonating column
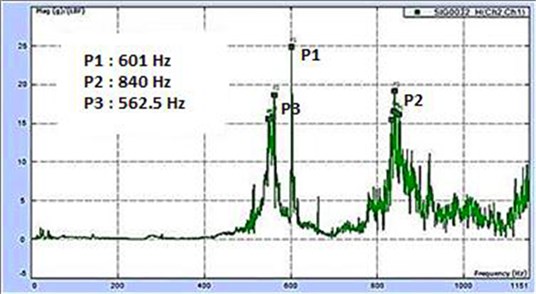
Impacts are monitored and standardized, such that all the impacts are same in amplitude. For the 1st set of readings, Accelerometer was mounted on position 1 (Refer Fig. 6) and impacts were given on the other three points. In the same way, accelerometer was moved to positions 2, 3 and 4 to obtain 12 different readings. These readings are averaged out and plotted. An accurate measurement of the natural frequency is obtained by this method.
Fig. 7 shows peaks around 560, 600 and 840 Hz. If we look at these three peaks as multiples of 280 and 300 respectively, we conclude that, the characteristic body frequencies can be 280 and 300 Hz.
Fig. 5Auto power spectra
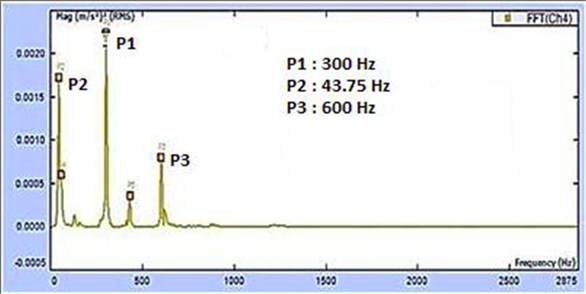
Fig. 6Impact and response points
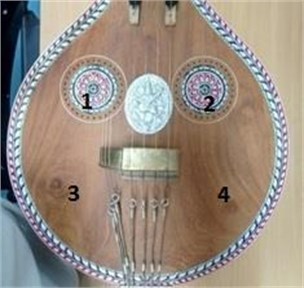
Fig. 7Impact test plot
4.4. Acoustic analysis using Fast Fourier Transform (FFT)
Natural Frequency of the Veena was found out using the Octave Analysis, APS and the Impact Test on the Resonating Chamber. The analysis showed prominent peaks at 280 and 300 Hz and also at 560 and 600 Hz.
We further carry out an Acoustic Analysis of the sound produced by plucking the strings, using the 377B02 microphone (PCB Piezotronics) of sensitivity 50.21 mV/Pa. It is the characteristic of the instrument to boost its 1st overtone instead of the fundamental frequency [8]. Assuming the fundamental frequency of the system to be 300 Hz, the strings were tuned to a frequency which is half of the fundamental to see the response.
String S1 as shown in Fig. 2 was set to 150 Hz and also to 132.5, 140 and 160 Hz and the respective FFT plots are shown in Figs. 8 to 11. After tuning the Veena to one particular frequency, string S1 was plucked and the sound level recorded using the microphone. FFT plots show Frequency and Amplitude on the and axes respectively.
Fig. 8FFT plot for tuning of 132.5 Hz
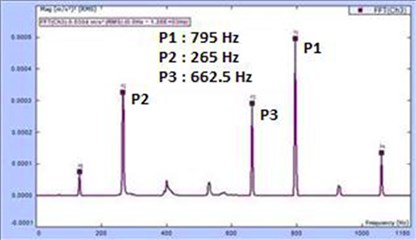
Fig. 9FFT plot for tuning of 140 Hz
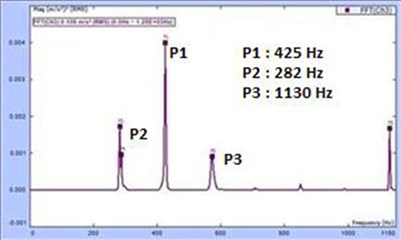
Fig. 10FFT plot for tuning of 150 Hz
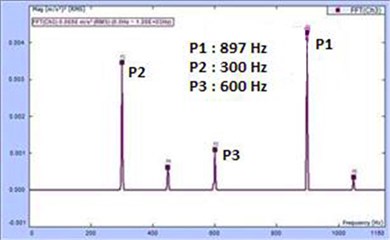
Fig. 11FFT plot for tuning of 160 Hz
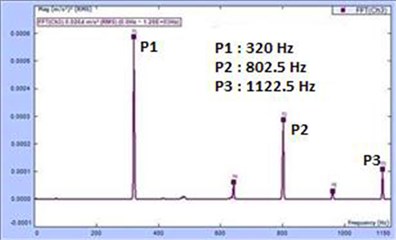
Table 2Amplitude variation with frequencies
No. | Tuning frequency (Hz) | Dominant frequency (Hz) | Amplitude of dominant peak |
1 | 132.5 | 265 | 0.0003 |
2 | 140 | 282.5 | 0.0017 |
3 | 150 | 300 | 0.0035 |
4 | 160 | 320 | 0.0006 |
Table 2 shows the amplitude variation with tuning frequencies. For all the four frequencies under consideration, the dominant peak was at the first overtone or twice the tuning frequency. Also, 150 Hz had the maximum amplitude among the four readings which corroborates our previous results which showed 300 Hz as the dominant peak. The results can be summarized as follows: the fundamental frequency of the system is 150 Hz and it is the unique characteristic of the Veena to boost 300 Hz which is twice the fundamental of the system.
4.5. Sound level meter analysis
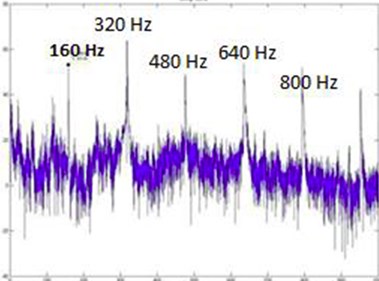
Readings were taken also using Larson Davis 831 Sound Level Meter (SLM) for the same set of frequencies. The frequency range is restricted to 1 kHz and block size is set to 6400. The Veena was tuned to same frequencies as for previous acoustic analysis and ambient noise spectrum was removed from the FFT signal.
Figs. 12 to 15 shows the FFT plots for tuning of 132.5, 140, 150 and 160 Hz.
For all the tuning frequencies, the Veena displays its harmonic nature as we can clearly identify successive overtones ranging from the fundamental to the sixth multiple of the fundamental (f, 2f, 3f,…, 6f). As shown in Fig. 21, 150 Hz displays prominent peaks which had the maximum area under the curve among the four frequencies considered. This shows that 150 Hz is the fundamental frequency of the system, as the system undergoes conductive resonance at 150 Hz and gives the maximum amplitude in FFT plots.
Fig. 12SLM FFT plot for 132.5 Hz
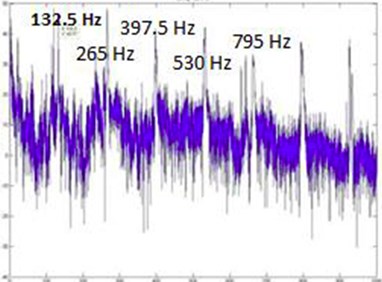
Fig. 13SLM FFT plot for 140 Hz
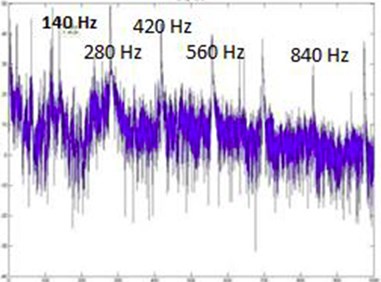
Fig. 14SLM FFT plot for 150 Hz
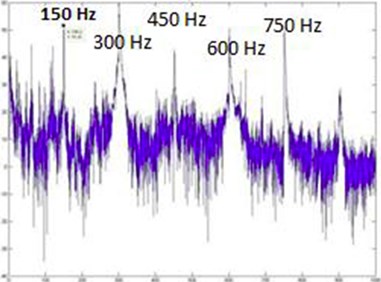
Fig. 15SLM FFT plot for 160 Hz
5. Results and discussion
Octave analysis showed significant peaks around the frequency ranges 300, 600 and near to 1000 Hz.
Auto Power Spectra showed a prominent peak at 300 Hz and that peak contains the maximum energy in the graph.
Impact test showed peaks around 560, 600 and 840 Hz. These three peaks are multiples of 280 and 300 respectively.
Microphone readings taken show a significant amplitude rise with the frequencies 140 and 150 Hz. The respective multiples are 280 and 300, which are inferred to be the body frequencies.
As a characteristic of the instrument, the 1st overtone is the dominant frequency in contradiction with theory which says fundamental will be the dominant.
Sound Level meter also showed a wider and powerful spectrum with 150 Hz, which emphasizes the conclusion the body frequencies are around 300.
6. Conclusions
The optimum tuning frequency for this particular Veena will be 150 Hz on S1.
This particular Veena has its characteristic frequencies as 280 and 300 Hz. The body resonates with the strings if the strings are tuned to a frequency which is a multiple of the body frequency. Also the characteristic of the instrument is to boost the 1st overtone (2f). If we tune S1 of the Veena to a frequency half of either 280 or 300, and the remaining strings accordingly it undergoes resonance and gives the maximum tone output.
References
-
Raman C. V. On Some Indian Stringed Instruments. M.A., D.Sc. (Hon.), Proceedings on the Indian Association for the Cultivation of Science, Vol. 29, Issue 7, p. 33-1921.
-
Spider-81 Manual, Crystal Instruments.
-
Accelerometer 352C34 Product Manual. PCB Piezotronics.
-
Clarence W. de Silva Vibration Monitoring, Testing and Instrumentation. CRC Press, 2007.
-
Microphone 377B02 Product Manual. PCB Piezotronics (1-1 to 1-73).
-
Larson Davis Sound Level Meter Manual. 2013.
-
Engineering Data Management Manual. Crystal Instruments.
-
Samarth Mathur, Ayush Raizada, Pravin M. Singru, Radhika Vathsan Experimental Acoustic Analysis of Sarasvati Veena. 2nd International and 17th National Conference on Machines and Mechanisms, 2015.
