Abstract
This paper proposes a semi-active mechanical blocking method against reflected light-intensity instrument based surreptitious signal gathering via vibrating window surfaces. The technical countersurveillance method is based on driving a piezoceramic transducer mounted on the window pane with a sinusoidal input coincident with the first resonant mode of the surface. The article evaluates the simulated surveillance data gathered experimentally on a simplified laboratory model when supplying the proposed blocking system with different types of disturbance signals. It has been found that, while the use of a high amplitude random signal does block surveillance attempts effectively, the resulting acoustic noise can be bothersome to the occupants of the protected room. However, the analysis presented here also suggests that the use of a sinusoidal signal with a frequency equal to the first resonant frequency of the windowpane disrupts surveillance signals – depending on the properties of the target – without generating significant acoustic by-products. Results are applicable only to reflected light-intensity systems, as the efficacy of the method cannot be confirmed without classified surveillance equipment with broader dynamic range.
1. Introduction
The documented history of espionage goes back to several centuries [1] and with the advent of different electronic devices added to the arsenal of governments and corporations, the importance of developing effective technical countermeasures has been escalating throughout the last century. Products of the science of surveillance left classified research laboratories and have been turned into commercialized goods, allowing any person or organization with a sufficient budget to conduct long distance monitoring [2, 3]. Owing to the influence of popular culture, covert surveillance is mainly associated with government activity, but private companies can also engage in industrial and economic espionage [4]. The financial loss due to the theft of proprietary information is estimated at several tens of millions of dollars each year in the United States alone [4].
This article focuses mainly on one particular surveillance method: intelligence gathering through optical devices-informally known as laser microphones-aimed at windowpanes to pick up minute vibrations resulting from human speech in the room [5, 6] (see Fig. 1). Early versions of this approach utilizing infrared beams instead of lasers in interferometer configuration were used as early as 1947 by the Soviet government [7-9]. The device code named "Buran" was reliable up to distances of 500 m, but it was ineffective in case of rain or fog. The acquired signal was post-processed to remove noise with analog technology available at the time [8]. The practice of embedding small prisms in the window glass that are nearly invisible to the naked eye thereby enhancing laser sensitivity and aiding positioning was also common practice during the late years of the cold war [10].
It is widely believed that similar but more developed surveillance methods using laser interferometry are still extensively used by government and military units worldwide, however, due to the nature of the topic this cannot be positively confirmed and evidence remains mostly anecdotal [2, 9, 11-13]. Though the use of laser interferometry for clandestine surveillance requires equipment that is expensive [14], hard to maintain and difficult to operate, it has the advantage that it can elude traditional technical countersurveillance methods (TCSM) usually aimed to block, identify or disrupt radio frequency transmission links [10].
Fig. 1Basic principle of laser microphone surveillance
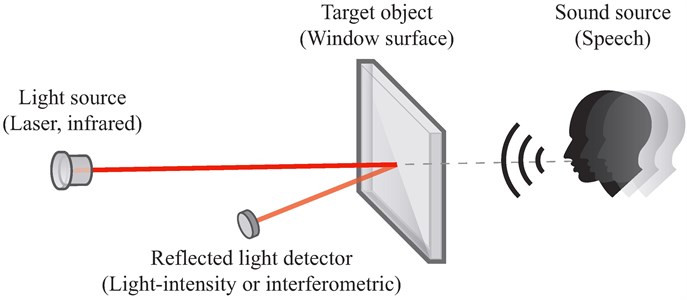
Crude laser listening devices produce a visible beam or spot that can be identified relatively easily, but higher end commercial devices use infrared lasers that are invisible to the naked eye [1]. Also, in addition to traditional audio surveillance, reconstructing keystrokes from a computer keyboard using the combination of a crude laser microphone and statistical analysis software coupled with dictionary matching has also been demonstrated [15-17].
The construction of a primitive laser surveillance device using the principle of sensing the changes of intensity in the reflected beam is a trivial matter [1, 18] and detailed instructions [19-21] and usage examples [22] are readily available online. These devices consist of a laser source, a visible one for aiming and an infrared for surveillance, and an analog photo-sensitive component with a basic amplifier circuit connected to a computer sound card. The reflection of the beam directed at the vibrating window is aligned with the photo-sensitive element and changes in the coverage area and light intensity are translated to an analog voltage signal. Surprisingly, even commercialized devices based on this basic method are on sale [4, 23-25], albeit with more refined optical components and signal filtering. The disadvantage of the reflected light-intensity approach is that, since the beam undergoes nearly specular reflection [26], it is difficult to aim the beams at large distances and they generally lack advanced post-processing and filtration facilities.
Precise laser interferometers are also commercially available for a variety of measuring applications [1, 2, 4]. Though marketed for civil engineering applications, certain models are especially suitable for long distance measurement, use an invisible infrared beam and are equipped with optical scopes for easy targeting [27] – suggesting a possibility that versions specialized for government use are available as well. Recently, the use of a photo-electromotive-force pulsed laser vibrometer as a laser surveillance microphone has also been proposed [28, 29]. Using scattered and reflected sunlight instead of laser beams for distant surveillance has been put forward as well, albeit without demonstrating this intriguing idea in a practical experiment [30]. Recently a team of researchers has introduced a novel optical sound recovering technique, possibly useful as a surveillance method: Davis et al. has demonstrated passive sound recovery via video images in [31].
The prevalent tactic used to prevent this type of surveillance is to build special safe rooms or entire buildings of critical importance without windows pointing to the outside [4, 13, 14, 26, 32], underground [33] or using a separate inner and outer shell for the building, like at the CIA headquarters in Langley [13, 34]. Other possible security measures are exterior meshes, windows with protective plastic films [2, 4, 14, 35, 36], planting trees [33], electrodynamic shakers connected directly to the windows and other mechanical disruptions [1, 4], white noise audio generators [1, 37, 38] and other sound masking tactics [4], laser detectors [39], or optical signal jammers injecting high frequency laser noise into the surveillance signal [2, 8].
Of course, creating specialized safe rooms is a very expensive and often impractical countermeasure [4]. The efficiency of other passive or semi-active measures is difficult to assess due to the complete lack of publicly available comparative research literature on subject. While the performance of commercially available white noise generators, audio masking devices and mechanical shakers [37, 38] has not been evaluated in a systematic way either, these devices may create considerable background noise. The noise generated by these approaches may reach levels at which holding conversations in the protected area becomes increasingly difficult [1, 4].
To complement the array of countermeasures against laser microphones, this paper proposes a novel semi-active mechanical blocking of light-intensity optical instrument based signal intelligence of windowpanes, based on a piezoceramic transducer driven at the resonant frequency of the window surface. The article evaluates the simulated surveillance data gathered experimentally on a simplified laboratory model, while supplying the proposed piezoceramic transducer with different types of disturbance signals. The perception of the speech quality and intelligibility is evaluated subjectively and also objectively using an algorithm for speech perception quality measurement. The article investigates the noise level generated by the different signal types, and evaluates the effect of divergence from the identified resonance frequency on masking, in case the modal method is used. Recordings of the experimental tests are also made available [40].
Naturally, classified surveillance equipment is not available for laboratory testing, therefore the experiment and its results presented here are aimed at the first type of laser microphones introduced here: light-intensity based improvised devices or low-end commercial surveillance equipment. The dynamic range of the triangulation device used here is limited compared to the speculated coverage of specialized equipment. Therefore, the experimental measurement system used here cannot be deemed representative in general.
After the formerly presented introduction, the instrumentation used in the experiment is reviewed in Section 2.1. This is followed by the experimental identification of the resonant frequency of the window surface in Section 2.2. The reader is familiarized with the objective speech quality measures considered in this work in Section 2.3. Next, the experimental scenario of simulating laser microphone surveillance is set forth in Section 3.1. The experiments comparing the masking effect of different signals driving the piezoceramic transducer are described in Section 3.2, while the properties of the modal masking method are shown in Section 3.3. The article is concluded by a review of results, possible technical and methodology issues and a discussion on future work in Section 4.
2. Materials and methods
2.1. Instrumentation
A window is modeled by a 4 mm thick Plexiglas (acrylic glass) sheet mounted to a 500×450 mm frame with a 404×352 mm free surface area (Fig. 2). The measurement chain is schematically illustrated in Fig. 3. A SAL SBX 1320/BK medium bandwidth speaker is connected to a Genius SW-HF5.1 500 amplifier and is utilized to emulate speech in a closed room. A Keyence LK-G32 industrial laser triangulation sensor is placed at the side of the window opposite to the speaker, modeling the optical surveillance unit aimed at the window. While the construction and the working principle of this sensor are not suited for long distance or high quality intelligence gathering, it is considered here to be adequate for simulating a surveillance unit with simpler construction, respectively equipment available on the open market. The laser sensor is connected to a Keyence LK-G3001V central processing unit. The physical blocking of the optical surveillance unit is achieved by a MIDÉ QP16n lead zirconate trinitrate (PZT) transducer patch bonded onto the bottom-middle section of the acrylic glass. The transducer gains its signal from a MIDÉ EL-1225 operational amplifier.
Fig. 2Model of a windowpane under surveillance with a piezoceramic transducer mounted on its surface
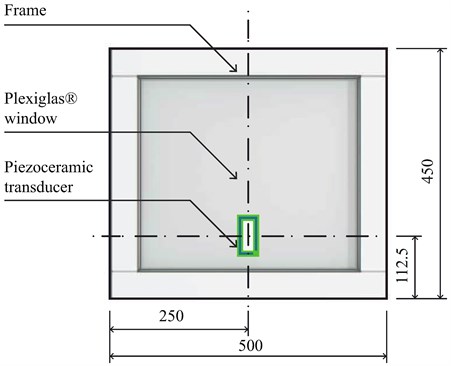
Fig. 3Schematic representation of the experimental system
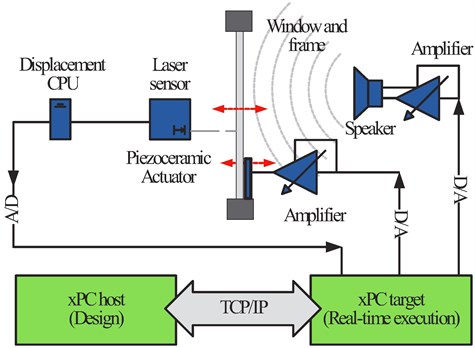
The measurement and algorithms are implemented on a personal computer running the Matlab xPC Target rapid control software prototyping platform, connected to hardware components with a 16 bit National Instruments PCI-6030E measurement card. The measurement system is developed in the Matlab and Simulink software environment, then loaded onto the Target platform via the TCP/IP protocol. The audio signals were sampled at 10 kHz rate with a 16 bit resolution, though not particularly high quality, but commonly used and sufficient for vocal audio [41]. The signals were later downsampled to an 8000 Hz rate. The experimental setup and a detail of the laser sensor and the piezoceramic actuator are shown in Fig. 4.
During the experiments an analog signal is supplied to the amplifier, which in turn drives the speaker emulating speech. Without the semi-active blocking signal the sound pressure causes small vibrations in the surface of the acrylic glass, which are picked up using the laser sensor emulating the signal intelligence unit. This is recorded for post-processing in the xPC Target computer. With the surveillance blocking signal activated, the investigated signal types are sent through the amplifier onto the piezoelectric transducer, disrupting the audio signature of speech inside the gathered data.
Fig. 4a) The experimental setup and b) the laser triangulation head used to emulate the laser microphone and the actuating element
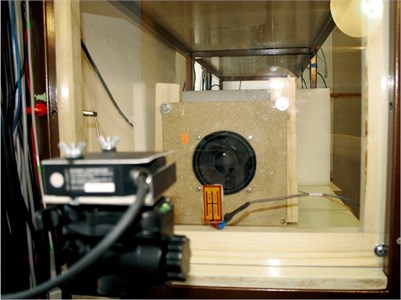
a) Experimental setup
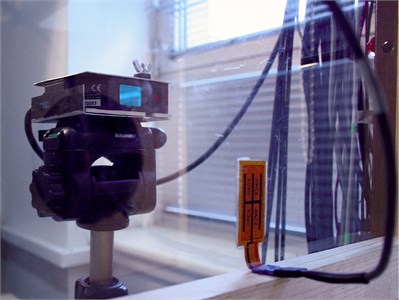
b) Laser sensor and piezoceramic transducer
2.2. Experimental identification of the resonant modes
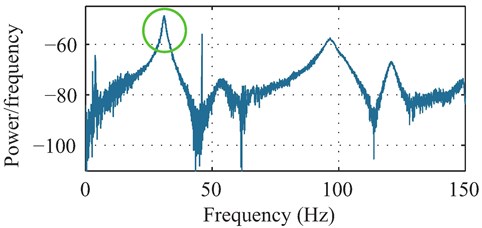
The experimental identification of the resonant modes of the acrylic window was performed by supplying a chirp signal to the piezoceramic transducer in the bandwidth of 0-150 Hz in 150 s time with a 60 V amplitude and 1 kHz sampling. The response of the window was recorded using the laser triangulation sensor. Analyzing this response in the frequency domain, as shown in Fig. 5, indicates that the first three resonant modes are located at 31.13 Hz, 96.65 Hz and 120.90 Hz respectively. This information was used later in determining the effectiveness of a passive sinusoidal blocking signal in agreement with the first resonant frequency.
Fig. 5Periodogram power spectral density estimate of the window response from the piezoceramic transducer, showing the first resonant peak at 31.13 Hz
2.3. Speech perception quality and intelligibility evaluation
As of today, the most accurate method to compare audio speech quality is through subjective listening tests [41, 42]. The conclusions of this article will be given based on such listening tests performed by the authors, while the following sections will also contain information and conclusions based on these trials.
In addition to the formerly mentioned subjective tests, objective measures of speech quality and intelligibility were also analyzed using the algorithm collection provided by Ellis and Brookes, and are given here to allow for an unbiased evaluation of the results [43, 44]. Three different metrics are used here to quantify speech perception quality: NIST STNR which is given as the speech to noise ratio (SNR) defined as , where power refers to the variance of a signal computed over 20 ms windows [45]. The algorithm SNRvad gives a measure of the additional energy in speech regions determined by a crude voice activity detection (VAD) compared to the energy of the silent sections in between [43]. Finally, the perceptual evaluation of speech quality (PESQ) score is given by the fully automatized algorithm of Hu et al. [42, 46], denoting speech quality on a 1-5 scale. A method based on waveform amplitude distribution analysis (WADA) proposed by Kim and Stern in [47] was also considered in the preliminary comparison, however its results were found to be unreliable and inconsistent with the subjective perception of the signal. As the scope of this article does not allow for a deeper introduction of these methods, the reader is referred to the bibliography sources for more information.
3. Results and discussion
3.1. Simulating the optical surveillance of a windowpane with post-hoc filtering
In order to allow for an easier comparison of different blocking methods, the same ~15 s long speech signal down sampled from 44 kHz audio to 10 kHz was used to simulate human conversation in a room. The audio signal used throughout all the experiments is the NASA commentary on the occasion of the landing of the space shuttle Atlantis STS-135. The transcript is: “Nose gear touchdown. Having fired the imagination of a generation, a ship like no other, its place in history secured, the space shuttle pulls into port for the last time, its voyage at an end”.
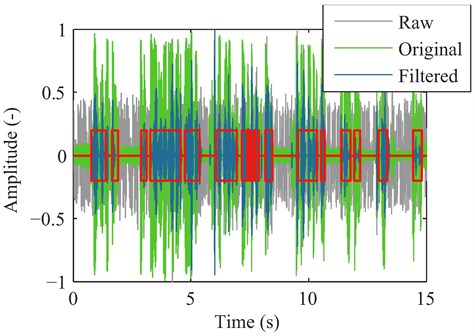
Fig. 6Normalized waveform comparison of the raw surveillance signal from the laser sensor (grey), the original speech signal (green) and the filtered surveillance signal (blue). The automatically identified active voice segments are marked with red boxes
After the laser system picked up the vibration on the surface of the window, the displacement signal was normalized to unit amplitude to increase its absolute volume [41]. Even though the resulting signal is noisy and distorted, the speech is intelligible [40]. As the real-time or post processing of the noisy signal is possible using advanced filtering techniques, the resulting surveillance data was also refined by a Wiener filter algorithm based on tracking a priori user SNR using the decision-directed method proposed by Plapous et al. [48]. It has been found that the harmonic regeneration noise reduction (HRNR) provided the best filtration results and an improvement in sound quality, however, the subjective intelligibility increase with this particular signal was not very convincing. Overall, the intelligibility of both the raw and the filtered simulated surveillance data was adequate. Albeit it was necessary to pay close attention to the reconstructed sound because of the bad quality audio, the meaning of the words and sentences could be distinguished well.
The objective speech quality metrics are given in Table 1 for the original slightly noisy speech file, the raw displacement data from the laser sensor and finally the filtered result.
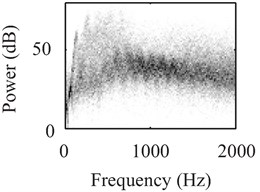
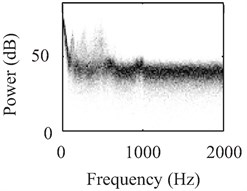
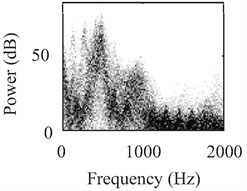
Fig. 7Mean energy of the active voice segments (solid lines) and noise (dashed lines) in the original speech file (green), the raw surveillance data (grey) and the filtered surveillance data (blue)
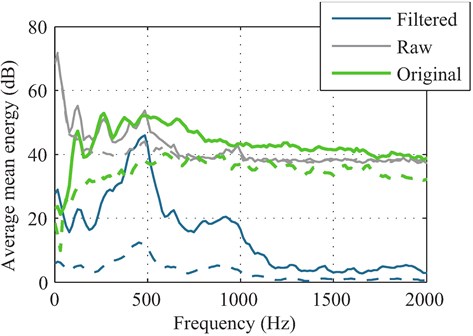
Table 1Evaluation of the objective speech quality without semi-active countersurveillance measures
Original | Raw | Filtered | |
NIST | 25.0 dB | 3.5 dB | 81.8 dB |
SNRvad | 6.1 dB | –7.1 dB | 5.4 dB |
PESQ | – | 1.6 (–) | 2.0 (–) |
Standard techniques used for vocal audio visualization were utilized in order to illustrate the character of the speech signals recorded during the experiments [41]. The waveform of the surveillance data is shown in Fig. 6 for the original speech without a clean reference (green), the raw displacement signal (grey) and the post-processed and filtered signal (blue). Each measurement illustrates the time series data with its maximal amplitudes normalized to unit value. Active speech regions are marked with a crude voice activity detection algorithm [43]. The mean energy for the active voice segments (solid lines) and noise segments (dashed lines) are shown in Fig. 7 for the original speech signal (green), raw unprocessed surveillance data (grey) and the filtered surveillance data (blue). The maximum-scaled sub-band energy histograms in 1 dB bins are also shown for the original speech signal in Fig. 7, raw data in Fig. 7 and post-processed data in Fig. 7.
Fig. 8Illustration of the clean speech from the original data file
a) Original signal
b) Raw surveillance
c) Filtered surveillance
The purpose of the speech perception quality indicators shown in Table 1 and the visualized speech signals in Figs. 6-8 was to give an overall assessment of the quality of the simulated surveillance signal. Unfortunately, speech perception is still mostly evaluated based on subjective testing in industrial practice [41, 42], while standard visualization techniques may not always align with the character of the real audio signal. Therefore, the indicators shown here cannot fully demonstrate the difference between speech and surveillance data. Intelligibility of speech can be objectively characterized by the PESQ score using the time domain data in Fig. 6. The PESQ score of 2.0 achieved with the filtered signal indicates a poor quality audio but intelligible speech, in agreement with examples given by McLoughlin [41] and our subjective findings. To compare the original source with simulated surveillance, it is recommended to listen to the recordings from the experiments, available online [40].
3.2. Evaluation of different semi-active blocking signals
In order to determine the best available countermeasure approach using the piezoceramic actuator, four different semi-active signal disruption strategies were tested experimentally. All methods tested in this paper use the same experimental hardware, only the types of the signals supplied to the piezoceramic transducer have been varied. We may divide the considered signal types into two main groups: random non-correlated and sinusoidal. The random signals considered here were Gaussian noise with an amplitude variance of 20 V and uniform distribution random noise with a variance of 20 V, both with zero mean. The two types of sinusoidal signals tested here were a sinusoidal signal with an arbitrarily chosen 130 Hz frequency and the other with a frequency equal to that of the first resonant mode of the acrylic window, both with ±20 V peak amplitude.
The resulting objective speech perception quality indicators are given in Table 2 for the four different countersurveillance signals. The indicator most consistent with the subjective speech quality evaluation of the authors is PESQ. Regrettably, the rest of the indicators, that is NIST [45] and SNR [43] show no clear correlation with the subjective quality and intelligibility of the audio signal.
Table 2Evaluation of the objective speech quality with different types of semi-active signals
Gaussian | Uniform | Sinusoidal | Modal | |
NIST | 79.3 dB | 80.3 dB | 83.3 dB | 80.5 dB |
SNRvad | –6.2 dB | –1.4 dB | 5.1 dB | 4.2 dB |
PESQ | 1.3 (–) | 1.7 (–) | 2.0 (–) | 1.2 (–) |
Effective | Yes | Yes | No | Yes |
Noise | 90.5 dB(A) | 87.5 dB(A) | 62.3 dB(A) | 54.8 dB(A) |
The sinusoidal signal with the arbitrarily chosen frequency did not sufficiently degrade surveillance data quality, the filtered signal was almost identical to the one without the countersurveillance system enabled. The random signals proved to be more effective in masking the speech signal, however, still failed to completely eliminate recognizable phrases or words from the surveillance data. Of the two random approaches, the Gaussian signal was slightly better than the signal with uniform distribution. The best of the four considered methods was the harmonic signal with a frequency equal to the first resonant frequency of the window. Neither the raw unfiltered displacement data nor the filtered surveillance data contained recognizable speech.
Using mechanical and audio masking techniques to prevent laser listening, the surveillance countermeasure device may generate disturbing levels of ambient noise, which may render holding conversations difficult [1, 4]. The piezoelectric transducer combined with the window acts as a speaker generating audible noise as well. While increasing the amplitude of the masking signal and thereby increasing displacements of the window provided good results even considering the Gaussian and uniform random noise, the countersurveillance unit became increasingly noisy. The last line in Table 2 shows A-weighted sound pressure level measurements performed with a TENMA 72-860A sound level meter, which were carried out approximately ~0.2 m away from the window surface. Compared to the ambient noise level of 53.1 dB(A), the modal countersurveillance signal caused no significant increase in the noise. The perceived noise was also virtually nonexistent since the driving frequency used was well below the human hearing threshold. The rest of the evaluated methods show higher noise levels, while the sound pressure from the random masking signals proved to be very bothersome.
Naturally, the noise levels may vary depending on the material properties and geometric dimensions of the target object. The stiffness of the simulated acrylic window is less than that of glass, therefore the results on noise levels cannot be generalized. The perceived noise from the modal masking was low partly because the resonant frequency of the window was near the lower hearing threshold.
Fig. 9Illustration of the waveform of the filtered surveillance data without counter-measures (grey), and with the Gaussian (green) and modal blocking strategy (blue). Active voice segments are marked with a red line
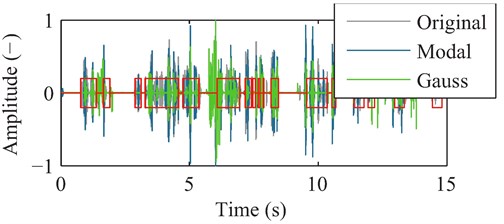
a) Waveform comparison
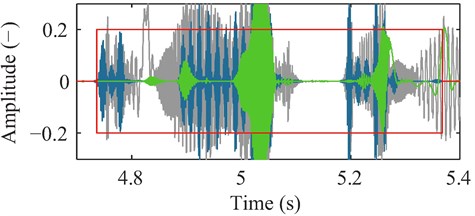
b) Detail of the waveform comparison
Fig. 10Illustration of the mean energy of the active voice segments (solid lines) and noise (dashed lines) in the surveillance data without countermeasures (grey), Gaussian blocking strategy (green) and modal strategy (blue). All signals were post-processed and filtered to enhance the information content of the speech
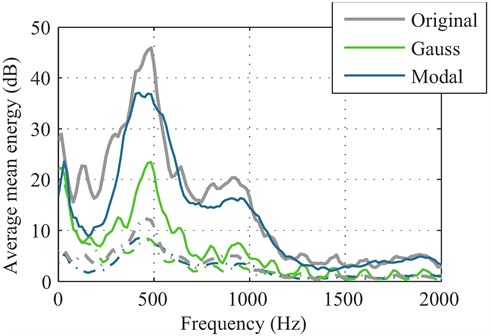
The visualization of the surveillance data using different signals passed into the piezoceramic transducer is given in Fig. 9 and Fig. 10. The results of the experiment using a sinusoidal signal with an arbitrary frequency and normally distributed noise are omitted from these illustrations to preserve clarity. The waveform of the filtered simulated surveillance data (grey) is compared to the Gaussian noise (green) and modal sinusoidal (blue) countermeasure strategies in Fig. 9, with a detail section of the waveform presented in Fig. 8. The simulated surveillance data is compared in the frequency domain as well, Fig. 10 shows the mean energy of the active voice segments (solid lines) and noise segments (dashed line) without an active countersurveillance (grey), with the Gaussian strategy (green) and the proposed modal signal (blue). Similarly, to the visualized recordings in Section 4.1, the significance of these illustrations is limited. The time-domain waveform illustrates the degradation of the information content of the signal with the countermeasures engaged, however, for a more informative comparison the reader is referred to the recordings of the tests [40].
3.3. Properties of the modal signal blocking method
After a small reconfiguration of the experimental system and a repeated identification procedure, the modal properties of the window have been slightly altered, with the first mode now located at the somewhat higher 35.22 Hz.
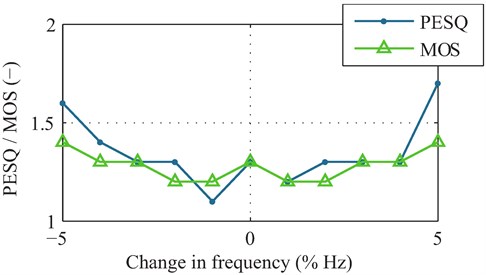
The required precision of driving the piezoceramic actuator with the first resonant frequency necessary to achieve good signal blocking results was evaluated by introducing a small error in the supplied sinusoidal signal. This test evaluated subjective speech quality after performing filtering on the surveillance signal for the range of a 5 % deviation from the first resonant frequency, given in 1 % increments and decrements to both sides. For the qualitative measurements neither the NIST nor the SNRvad methods provided results showing useful correlation with subjective speech quality, therefore only the results of the PESQ algorithm by Ellis [43] (blue line) and Brookes [44] (green line) are shown in Fig. 11.
According to the subjective evaluation of the authors, a more than ±5 % deviation from the experimentally identified first resonant frequency renders the blocking signal completely inefficient and the surveillance signals start to contain recognizable words and phrases sporadically. A deviation of ±10-±20 % from the first mode renders the interference completely ineffective and the surveillance signal will be intelligible after filtering. The PESQ indicators in Fig. 11 at the extreme ends of this deviation range seem to confirm this finding.
Fig. 11Evaluation of the objective speech quality with variations in the modal frequency using different methods
Higher modes – now shifted upwards in comparison with the previous experiment – were also tested to compare their effect in disrupting the surveillance signal. While the second modal frequency located at 74.1 Hz still provided good masking of the speech signal in the surveillance data, driving the piezoceramic transducers at the third mode located at 102.3 Hz did not indicate positive results, i.e. the countersurveillance method was largely ineffective. This phenomenon is expected, since the vibration amplitude tends to decrease with higher modes, therefore the speech signal will be less disrupted by exciting the window to higher modes.
4. Conclusions
This paper evaluated the semi-active blocking of optical surveillance attempts by various mechanical disturbance signals induced by a piezoceramic transducer. Following a subjective and objective analysis of speech quality, it has been found that the proposed modal response-based semi-active counter-intelligence method can be effectively used in protecting critical infrastructure against covert surveillance via light-intensity laser microphones. According to the findings presented here, supplying the piezoceramic transducer mounted on the windowpane with high amplitude random mechanical noise may block the speech signal from the surveillance data effectively, but the side effect of the blocking is audible noise which can be bothersome to the occupants of the protected room. While the use of an arbitrarily chosen sinusoidal signal has been found largely ineffective, a sinusoidal disturbance with a frequency equal to the first resonant frequency of the windowpane may prevent surveillance attempts very effectively while generating only minimal added noise. The novel technical countersurveillance measure against improvised or low-end laser microphones set forth in this article expands the range of currently available methods.
Of course, there are certain negative aspects and uncertain properties of the considered blocking mechanism. As there is no suitable laser Doppler velocity measurement available to the authors, the conclusion on the effectiveness of the approach cannot be entirely generalized. Although it proved to provide very efficient masking in the experiment presented here, the sinusoidal signal introduced to the piezoceramic patch is deterministic, which leaves room for speculation whether it would be possible to recover audio from the signal injected with this pure-tone mechanical noise. In case linearity is assumed, specialized equipment with higher dynamic measurement range could possibly extract a useful speech signal. Furthermore, newer and more advanced laser surveillance technology may pass through the window and register other vibrating objects in the room [2] – the efficacy of the proposed approach in this case is questionable.
The proposed method also requires using a separate system tuned to the first resonant frequency of each individual window pane in the protected room. Since the objective indicators of speech perception quality considered here characterized the different semi-active blocking methods somewhat unreliably, it is desirable to find or propose a different measurement metric in upcoming work.
To provide answers to these questions, further research is necessary. Future work shall contrast the commercially available technical countersurveillance products – such as audio generators [1, 37, 38], mechanical devices [1, 4] and protective films [2, 35, 36] – to the proposed modal blocking method. To our knowledge, no similar systematic studies exist as of today. One of the shortfalls of the experiments presented here is that they feature a plastic window instead of glass and instead of a laser interferometer an industrial triangulation system. This, and the need to analyze the possibility of recovering signals from the disrupted surveillance data shall be addressed in future studies. An additional countersurveillance method could involve the use of the feedforward adaptive x-LMS algorithm [49, 50] to actively compensate for the audio in the room using a reference microphone and an error accelerometer that should be mounted on the windowpane in addition to the piezoceramic actuator.
References
-
Wilhelm Thomas, Andress Jason Ninja Hacking: Unconventional Penetration Testing Tactics Techniques. Syngress, Boston, 2011.
-
Gold Steve Electronic countersurveillance strategies. Network Security, Vol. 2, Issue 2013, 2013, p. 15-18.
-
Jones Andrew Industrial espionage in a hi-tech world. Computer Fraud and Security, 2008, p. 7-13.
-
Chanaud Robert Protecting Sensitive Conversations with Soundmasking. Whitepaper, Dynasound, Inc., http://www.soundmasking.com/whitepapers/SecWhitePaper.pdf, 2007
-
Mims III Forrest M. Surreptitious interception of conversations with lasers. Optics News, Vol. 11, Issue 11, 1985, p. 6-12.
-
Solomon Joel, Prigo Robert Eavesdropping with a laser. American Journal of Physics, Vol. 55, Issue 4, 1987, p. 381.
-
Galeyev Bulat M. Light and shadows of a great life: in commemoration of the one-hundredth anniversary of the birth of Leon Theremin, pioneer of electronic art. Leonardo Music Journal, Vol. 6, 1996, p. 45-48.
-
Glinsky Albert Theremin: Ether Music and Espionage. University of Illinois Press, Urbana, IL, 2000.
-
Arthur Charles Laser spying: is it really practical? Government sources said conversations about Snowden leaks could have been monitored by foreign agents. The Guardian, http://www.theguardian.com/world/2013/aug/22/gchq-warned-laser-spying-guardian-offices, 2013.
-
Wallace Robert, Melton H. Keith, Schlesinger Henry R. Spycraft: The Secret History of the CIA’s Spytechs, from Communism to Al-Qaeda. Dutton/Penguin Group, New York, NY, 2008.
-
Pike John All Things Considered: CIA Used Satellites to Prep for Bin Laden Raid. Online, Radio Segment. National Public Radio, http://www.npr.org/2011/05/04/135995089/cia-used-satellites-to-prep-for-bin-laden-raid, 2011.
-
Turley Johnatan The rapid decline of transparency and privacy in America. The Future of Freedom Foundation Conference, 2008.
-
Melton Keith, Yeates Eames, Klein Janis W. SpyTek. TV Interview. TV Documentary, http://www.youtube.com/watch?v=Ylo72DyapVY, 2008.
-
Gadkari Pia Laser listening: could you eavesdrop on the Guardian? BBC News, Technology Section, http://www.bbc.com/news/technology-23793465, 2013.
-
Gordon Sarah, Mansfield-Devine Steve Flaws and patching in Las Vegas. Network Security, Vol. 8, Issue 2009, 2009, p. 1-2.
-
Barisani Andrea,BiancoDaniele Sniffing Keystrokes with Lasers/Voltmeters: Side Channel Attacks Using Optical Sampling of Mechanical Energy and Power Line Leakage. DEF CON 17 Hacking Conference, Las Vegas, Nevada, http://www.blackhat.com/presentations/bh-usa-09/BARISANI/BHUSA09-Barisani-Keystrokes-SLIDES.pdf, 2009.
-
LemayMichael Acoustic Surveillance of Physically Unmodified PCs. http://www.ccrllc.com/Acoustics/Office-Acoustics-Guidelines/DMChapter6.pdf, 2006.
-
Jillette Penn, Golden Teller Penn and Teller Tell a Lie: You Can Blow Out a Forest Fire (Laser Pointer Listener? – Episode 2). TV Documentary, https://www.youtube.com/watch?v=tXC9ykA0HFs, 2011.
-
Moses James M., Trout K. P. A simple laser microphone for classroom demonstration. The Physics Teacher, Vol. 44, Issue 12, 2006, p. 600-603.
-
Williamson Glen A. Pro Laser Spy Device. http://www.williamson-labs.com/laser-mic.htm, 2009.
-
Pro Laser Spy Device. LucidScience, http://lucidscience.com/pro-laser\%20spy\%20device-1.aspx, 2010.
-
KrasnowBen Laser Microphone for Audio Surveillance Via Window Panes. http://benkrasnow.blogspot.sk/2011/11/monetize-edit-annotations-edit.html, 2011.
-
Long-Range Laser Listening Device Model AA79106. Argo-A Security, http://www.argoasecurity.com/product_detail.aspx?productID=239, 2009.
-
Laser Listening Systems. Electromax International, Inc., http://www.electromax.com/laser.html, 1998.
-
StealthLaser P Laser Listening Device. StealthTronic, http://www.stealthtronic.com/laser-listening-device/, 2014.
-
Office Acoustics Guidelines: Secure Facilities. CCR Associates LLC, http://www.ccrllc.com/Acoustics/Office-Acoustics-Guidelines/DMChapter6.pdf, 2010.
-
RSV-150 Remote Sensing Vibrometer. Polytec GmbH Waldbronn, http://www.polytec.com/eu/products/vibration-sensors/special-application-vibrometers/rsv-150-remote-sensing-vibrometer, 2013.
-
Wang Chen-Chia, et al. A new kind of laser microphone using high sensitivity pulsed laser vibrometer. Conference on Lasers and Electro-Optics, and Conference on Quantum Electronics and Laser Science, 2008, p. 1-2.
-
Wang Chen-Chia, et al. High sensitivity pulsed laser vibrometer and its application as a laser microphone. Applied Physics Letters, Vol. 94, Issue 5, 2009, p. 051112.
-
Mackin Charles Remote Listening Device: Creation of a Covert IR LaserMicrophone. Bachelor’s Thesis, Univeristy of Arizona, Tucson, Arizona, United States of America, 2012.
-
Abe Davis, et al. The visual microphone: passive recovery of sound from video. ACM Transactions on Graphics, Vol. 33, Issue 4, 2014, p. 051112.
-
Richelson Jeffrey The Wizards of Langley: Inside the Cia’s Directorate of Science and Technology. Basic Books, New York, 2002.
-
Anderson Ross J. Security Engineering: A Guide to Building Dependable Distributed Systems. Wiley, Indiapolis, IN, 2008.
-
Bryant Chris Q&A: Laser Microphone Surveillance. Financial Times, http://blogs.ft.com/the-world/2013/08/qa-laser-microphone-surveillance/, 2013.
-
The Directory of INFOSEC Assured Products. The United Kingdom National Technical Authority for Information Assurance (CESG), http://www.ia.nato.int/Documents/CC-Directory.pdf, 2010.
-
Sen Taner Reflection Properties of a Gaussian Laser Beam from Multilayer Dielectric Films. Master’s Thesis. Izmir Institute of Technology, Urla Izmir, Turkey, 2009.
-
AJ-34 Audio Jammer Instruction Manual. CounterTek, 2010.
-
SV-LASERD Laser Countermeasure Surveillance Protection Device. ASIN: B00383Z5L0, ASR Tactical, 2013.
-
Lerner K. Lee, Wilmoth-Lerner Brenda Encyclopedia of Espionage, Intelligence and Security. Thomson-Gale, Detroit, United States of America, 2003.
-
Takács Gergely, Otčenáš Jakub Simulated Laser Microphone Surveillance Test. https://soundcloud.com/gergelytakacs/sets/laser-microphone-surveillance, 2013.
-
McLoughlin Ian Applied Speech and Audio Processing: with Matlab Examples. Cambridge University Press, Cambridge, 2009.
-
Hu Yi, Loizou P. C. Evaluation of objective quality measures for speech enhancement. IEEE Transactions on Audio, Speech, and Language Processing, Vol. 16, Issue 1, 2008, p. 229-238.
-
Ellis Dan Objective Measures of Speech Quality/SNR. http://labrosa.ee.columbia.edu/projects/snreval/, 2013.
-
Brookes Mike VOICEBOX: Speech Processing Toolbox for MATLAB. http://www.ee.ic.ac.uk/hp/staff/dmb/voicebox/voicebox.html, 2013.
-
Fiscus Jon NIST Speech Signal to Noise Ratio Measurements: The NIST Speech SNR Measurement. http://www.nist.gov/smartspace/nist_speech_snr_measurement.html, 2013.
-
Ma Jianfen, Hu Yi, Loizou Philipos C. Objective measures for predicting speech intelligibility in noisy conditions based on new band-importance functions. The Journal of the Acoustical Society of America, Vol. 125, Issue 5, 2009, p. 3387-3405.
-
Kim Chanwoo, Stern Richard M. Robust signal-to-noise ratio estimation based on waveform amplitude distribution analysis. INTERSPEECH, 9th Annual Conference of the International Speech Communication Association, Brisbane, Australia, 2008, p. 2598-2601.
-
Plapous C., Marro C., Scalart P. Improved signal-to-noise ratio estimation for speech enhancement. IEEE Transactions on Audio, Speech, and Language Processing, Vol. 14, Issue 6, 2006, p. 2098-2108.
-
Elliott S. J., Stothers I., Nelson P. A. A multiple error LMS algorithm and its application to the active control of sound and vibration. IEEE Transactions on Acoustics, Speech and Signal Processing, Vol. 35, Issue 10, 1987, p. 1423-1434.
-
Elliott S. J., Nelson P. A. Active noise control. IEEE Signal Processing Magazine, Vol. 8, Issue 10, 1993, p. 12-35.
Cited by
About this article

The authors would like to gratefully acknowledge the financial support granted by the Slovak Research and Development Agency (APVV) under the contracts APVV-14-0399 and APVV-14-0244. The authors would also like to thank the Scientific Grant Agency (VEGA) of the Ministry of Education, Science, Research and Sport of the Slovak Republic for their financial support provided under the contract 1/0144/15. The authors would like to thank for the financial assistance from the STU Grant scheme for the Support of Excellent Teams of Young Researchers.
This work or its authors are not affiliated, associated, authorized, endorsed by, or in any way officially connected with defense related research projects and are motivated strictly by scientific and technical curiosity. The central research theme of this work is not a subject of any ongoing or future contractual agreements, instead is a spinoff project of research in the field of active vibration and noise control.
