Abstract
The gaseous jet of the solid rocket motor running under water is influenced by both gravity and buoyancy, which will have a significant influence on the flow field structure and thrust of the motor, especially in the initial period when vehicles are launching horizontally. The work in this paper consists of three parts: firstly, to understand the mechanism of the thrust oscillation characteristics and the jet structure of a solid rocket motor running under water, as affected by gravity and buoyancy, a 3-d numerical simulation using the volume of fluid (VOF) model was established. Compared with those results neglecting gravity and buoyancy, conclusions were obtained that the jet structure, considering gravity and buoyancy, are more consistent with the experimental results. Secondly, the principle of momentum was used to analyze the flow field structure and the thrust oscillating characteristics in the initial period of operation. Finally, after analyzing the density gradient along the axis of the motor, results indicated that the length of jets under the influence of gravity and buoyancy varies linearly and the slope of the line is related to the working conditions. Comparing the trajectories under different conditions, a common theme emerged. The laws of thermodynamics are also used to simulate the jets as gas-water-vapor, three-phase, systems. The effect of phase transitions on the structure of jets and the characteristics of their thrust form the key conclusions.
1. Introduction
Solid rocket motors used in the propulsion systems of high-speed vehicles travelling in deep water require mobility and flexibility, which is conducive to long-term operations [1]. S. Garimella [2] worked with an Experimentally Validated Model for Two-Phase Pressure Drop. Tang [3] et al. compared the results of a spherical bubble model and that of the CFD method, and they found that this model can effectively reflect the characteristics of the thrust of the motor after ignition, as well as its advantages such as simplicity and rapidity of calculation. Wang [4] et al. adopted a VOF two-phase flow model and a dynamic mesh model to simulate the complicated flow structure of gaseous jets underwater, the results illustrated the vortex motion and the phenomenon of the compression, and expansion, waves. Zhu [5, 6] et al. also adopted the VOF model to get numerical results from a simulation of isothermal high-speed hot gaseous jets, and it was revealed that the changes in some flow parameters, such as the pressure and Mach number in the bubble, were important. Ni [7] studied the deformation mechanism of bubbles and the vortex behind the bubbles under the influence of buoyancy. He found the rising velocity of the balanced bubble and discussed the relationship between circulation inside the bubble and the vortex behind the bubbles. Feng and Leal [8] studied the different trajectories of different bubbles under the influence of gravity and buoyancy. Bewsbury [9] et al. studied the relationship between large bubbles and the floating velocity in a non-Newtonian fluid. In most research, the trajectories of small bubbles are linear, while that of the large bubbles tends to zig-zag because of the innate instability. Other much larger bubbles undergo spiral motion [10]. Wu and Gharib [11] studied the moving trajectories of spherical and ellipsoidal bubbles underwater. They concluded that when the equivalent diameter of the bubbles reaches 1cm, ellipsoidal bubbles move spirally while spherical bubbles move in zig-zags. Saffman [12] found that bubbles with a radius of less than 1 mm rise in water in a zig-zag motion, but bigger bubbles exhibit both spirally and zig-zag trajectories. According to Feng and Leal’s [13] research, when 600, the trajectory of a single bubble is a zig-zag accompanied by vortex shedding. Under the same experimental conditions, Yoshida and Manasseh [14] pointed out that the trajectories of bubbles are spiral and no vortex shedding occurs. Shew and Pinton [15] find that the trajectories in a polymer liquid are obvious at the beginning, and the separating of trajectories of increasing numbers of bubbles is slower than in water. Dewsbury [16] et al. studied the terminal velocity of bubbles in a non-Newtonian fluid. Tsuge and Hibine [17] found that the trajectories of spherical and ellipsoidal bubbles are the same in a flow of high Reynolds number.
In previous research about hypersonic gaseous jets, the models widely used are one-dimensional or axisymmetric. Although a few studies adopted three-dimensional models, such research is merely a qualitative validation without considering the specificity of the model. Hence, it cannot precisely describe the appearance of the bubble with gravity and buoyancy effects in an underwater gaseous jet. The solid rocket motor working underwater is moving with the body vehicles, so the axis of the motor is not always the same direction with gravity and buoyancy, which will keep an angle sometimes. This paper studies the motor injected horizontally underwater with the influence of gravity and buoyancy. The flow structures, thrust oscillation characteristics, the length of the jets, and their trajectories are presented. These results offer guiding significance to engineering practice.
2. Fundamental equations
In this research, the gas is considered to be an ideal compressible gas, and the water is an incompressible fluid. The shape of the bubbles is influenced by inertial forces, surface tension, and buoyancy. Phase transitions are ignored in the model. The VOF multi-phase flow model is adopted to simulate the interface between gas and water.
2.1. Governing equations
The high-temperature and high-pressure gas is regarded as the control fluid. Hence, the governing equations based on the VOF model involving mass conservation equation, momentum conservation equation, energy conservation equation and volume transfer equation are presented as follows [18]:
where, is a physical property of the mixture, , the volumes of the phases satisfy .
The density of the two phases is as follows:
The Froude number in the gaseous jets is (103). The body force in the momentum conservation Eq. (2) cannot be neglected. The energy is as follows:
2.2. Gravity equation
The average velocity and pressure in the multi-phase model is described through the Reynolds averaged N-S equations [19]:
where, is calculated through the continuous surface tension equation.
3. Model
To overcome the influence of the boundary conditions on the main flow in the jet cross-sectional area, the total length of the 3-d computational domain of the model is 500 times the nozzle inlet diameter, and the width is 330 times the diameter of the outlet nozzle. The grid of the horizontal jet is shown in Fig. 1, where mesh refinement is applied to the wall, throat, and core of the jets. The boundary in the four horizontal directions is the wall, while the pressure outlet forms the upper and lower boundary, as does the pressure inlet in the engine intake. The direction of action of gravity is perpendicular to the direction of the outlet pressure, at 9.81 m/s2.
Fig. 13-d model and grid
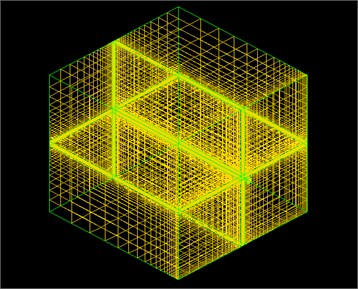
a) Model and grid
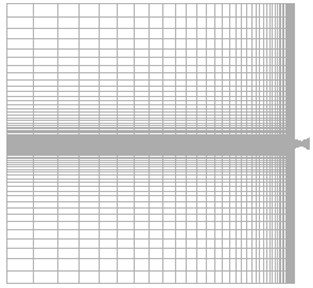
b) The section of the vertical plane
The computational mesh is generated by mapping a structured mesh with 1,558,400 cells. Ideal air is used as a high-pressure gas, the water is regarded as incompressible, and the vapor is regarded as ideal. The Prandtl number of gas is 0.712, and that of water is 5.43. The thermal conductivities of gas and water are 0.025 W/m·K and 0.6 W/m·K respectively. The specific heat of the gas is 1.4. The time step used during computation is 10-6 s. The total pressure of the free outlet boundary is the ambient pressure, which is calculated according to the depth of water, and the temperature is 300 K. The field wall boundary is under a stationary wall condition, no-slip and adiabatic rules pertain. The whole flow field is symmetrical. The initial condition of the nozzle is gaseous, while the outer field is water. These two parts are relatively static. The total pressure at the nozzle inlet is the initial pressure of the combustion chamber . The initial pressure of the water is that of the depth of water considered as , where is the depth of water, is the atmospheric pressure (0.101 MPa). Upon starting the calculation, these two fields connect immediately. In this paper, the governing equations are discretized using the finite volume method, and the SIMPLE scheme is utilized. Considering the difficulty in ensuring the accuracy of gas-liquid two phase simulation, the two-order upwind scheme is used for interpolation.
4. Results and discussion
4.1. Basic flow structure
When the pressure of the combustion chamber, with a certain nozzle, increases, the jets will change from subsonic floating flow to supersonic flow: the structure of the floating flow is shown in Appendix A. This paper is focused on supersonic flow structures and the characteristics of thrust, so the jets referred to all exhibit supersonic flow. The basic jet structure considers the influence of gravity and buoyancy. The characteristics of the structure involving initial section, transition section, and main section are presented. During the initial period, when the jets and bubbles first formed, the jets became hypersonic upon the exhausting of hot gas. Three parts are thus formed: in the initial section, the jet is mainly controlled by the initial momentum, and this section is the region starting at the blending of the jet boundary but not yet developing to the entire flow field. Here the axial speed is equal to the velocity at the exit in the jets. The transition section is a blended region with a gas jet and liquid water, and in this region, with the effect of the damping of initial momentum, and the huge inertial forces, there are intense energy exchanges between gas and water, as well the internal gas. The main section is the section where the damping of initial momentum is often at a rate 10-1. Meanwhile, the damping rate is axisymmetric. In addition, in this region, since the initial momentum has decreased, buoyancy played a full role in the gas jet physics, and any gas bubbles float upwards. The simulation results are consistent with that of the experiment in [20] and the free jet theory propounded in [21].
4.2. Typical processes
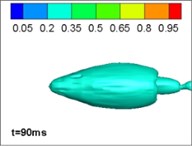
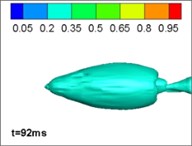
Comparing different jet structure results neglecting, and considering, the effects of gravity and buoyancy, we reached our key conclusions. The structure with no gravity and buoyancy is the same as that from an axisymmetrical model in 2, which thus validates the model. However, when considering the influence of gravity and buoyancy, the jet structure is different. This phenomenon is mainly caused by the limitation of the gas jet when running underwater. The forces on the surface of the jet are inhomogeneous. In the initial section of the jet, the momentum of the gas is large and the jets are narrow so that the gravity and buoyancy can be ignored; however, with the development of the jets, the volume of bubbles increases, so the influence of gravity and buoyancy cannot be ignored. Moreover, the momentum of the gas decreases so that the gravity and buoyancy dominate. The bubbles move upward. The simulation of four typical procedures namely: expansion, bulging, necking/breaking, and back-attack is shown in Figs. 2 and 3. The process is consistent with the experimental results in [22] (as [23]).
Fig. 2Results with gravity and buoyancy
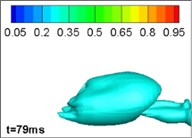
a) Expansion
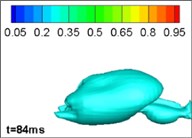
b) Bulge
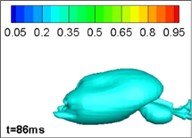
c) Necking/breaking
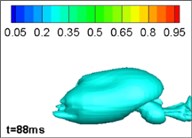
d) Back-attack
Fig. 3Results without gravity and buoyancy
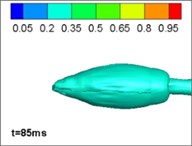
a) Expansion
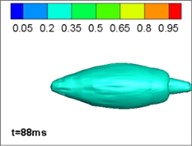
b) Bulge
c) Necking/breaking
d) Back-attack
4.3. Initial perturbation analysis
The distributions of pressure in the wall of the motor and plane 0 show that there is a small perturbation of the pressure, so the bubble changes slightly. As is known, the deeper the water, the greater the pressure. Hence, the reason for this phenomenon is the high density medium (the water) changes the direction of motion as the momentum of the gas is small in the initial period. The specific explanation is as follows: in the initial period, the momentum of the gas is small, so the buoyancy of the gas is large, which results in the movement of gas. The pressure of the section and the wall of the motor in this period are shown at (0.005 s, 0.006 s). Then, with the increasing of momentum of the gas, the high-speed flow will rebound due to the inertial resistance of the water. The direction of the flow will turn downwards (0.007 s, 0.008 s). At last, with the development of gas bubbles, the momentum of the gas downstream reduces, which results in the floating of the bubble in an upwards direction induced by buoyancy (0.009 s, 0.010 s). Under the same grid and boundary conditions, the flow field without gravity and buoyancy does not manifest any disturbance phenomena. So it is considered that the disturbance process is caused by the gravity and buoyancy.
This physical phenomenon in the simulation is consistent with movement of gas in the initial period of jets in [24]. Jet gas appeared to swing with the joint effect of the inertia of the higher density of water and associated buoyancy. With the change in momentum of the gas jet, the gas generates a corresponding reflection phenomenon, and the gas jet is reflected in the inertia of the continuous water, while the momentum of the gas jet decreases. When the momentum of the gas is reduced to a certain extent, the gas bubble began to rise perpendicularly under the effect of buoyancy.
4.4. Characteristics of underwater thrust oscillation
The typical process of pressure change induced by gravity and buoyancy appearing for the fifth time is presented: the pressure on the wall without gravity and buoyancy effects is concentric in its distribution, while that with gravity and buoyancy oscillates vertically. This is because the axis of the jets will turn upwards under the effects of gravity and buoyancy. In the period of expansion and bulging, because of the effects of gravity and buoyancy, the distribution of pressure on the wall is inhomogeneous (0.61 s to 0.63 s); however, during the necking/breaking stage, since the flow of gas is blocked, the momentum of the gas decreases, which leads to the changes in the pressure distribution (0.70 s). With the increase of momentum of the gas flow, the distribution of pressure on the wall changes again. Comparing the pressure distribution on the wall of the motor, it can be found that the changes to the pressure distribution are the same in the four typical processes. This phenomenon reveals that changes in the pressure are caused by gravity and buoyancy.
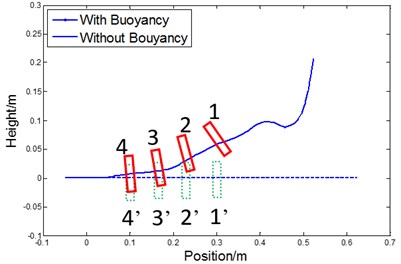
It was found that the gas jet under the effect of gravity and buoyancy is considerably different. The path of jets with no gravity and buoyancy acting is linear. The process of the knocking of the back-attack gas is shown as 1-4 in Fig. 4. The gas back-attack arrives at the wall almost simultaneously, so the impact of the gas pressure distribution on the wall is substantially symmetrical. However, when considering gravity and buoyancy effects, the path of the gas jet is shown as 1’ to 4’ in Fig. 4. As shown in the process, the plane of back-attack gas and the wall of the motor form a unique angle. So the arrival time of the gas is not the same, which will induce a torque effect on the motor as shown in Fig. 4.
Fig. 4Processes in underwater jets showing five typical pulses and the wall pressure distribution
4.5. The effect of working conditions on initial jet range
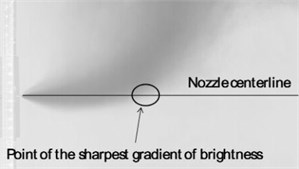
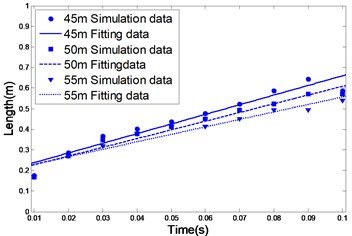
The interaction of gas and water in the jets with gravity and buoyancy is complicated. Under the effects of gravity and buoyancy, the trajectory of a bubble is no longer horizontal and it will deflect upwards. In previous studies, the length of a jet is defined as the distance along the centreline of the nozzle from the outlet to where the maximum gradient of intensity occurs [25], as shown in Fig. 5.
The length of jets in different working conditions is shown in Fig. 5. The data are linear, which is consistent with the conclusion in [24]. The figure shows that, with the change of parameters of different conditions, the slope of the fitted line changes monotonically. Therefore, it can be concluded that the length of the jets underwater is related to the working parameters. The numerical simulation in this paper is consistent with the experimental data.
Fig. 5Definition of jet length
The rate of increase of the length of horizontal jets occurs as follows:
(1) The deeper the water, the smaller the rate of increase in jet length, as shown in Fig. 6 (a). This is because the greater the depth of water, the larger the resistance of the external aqueous medium requiring to be overcome in the initial conditions or when the jet engine is otherwise in a similar state;
Fig. 6The jet length under different working conditions
a)
b)
c)
d)
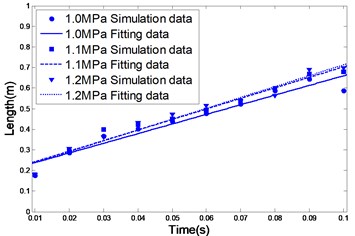
(2) The larger the total pressure on the combustion chamber, the greater the rate of increase in jet length, as shown in Fig. 6(b). This is because, when the initial conditions in the external environment are the same, the greater the combustion chamber pressure, the easier the gas jet can overcome the resistance imposed by the external aqueous medium;
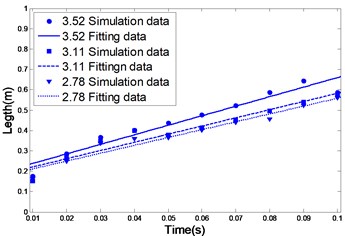
(3) The larger the expansion rate of the nozzle, the greater the rate of increase of the jet engine power (see Fig. 6(c)). This is because, under the same initial conditions, the larger the expansion ratio of the engine, the bigger the total momentum of the jet, which will increase the ability to overcome the resistance imposed by the external aqueous medium;
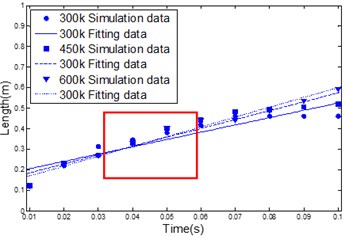
(4) The higher the combustion temperature, the greater the rate of increase of the jet engine power, as shown in Fig. 6(d). This is because, at a high temperature, the mass flow rate of the jets will decrease and the instantaneous momentum of the jet will increase. So the ability to overcome the resistance of the external aqueous medium will improve (see Fig. 6(d) tag A).
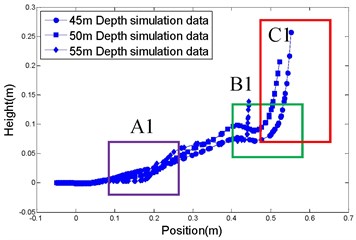
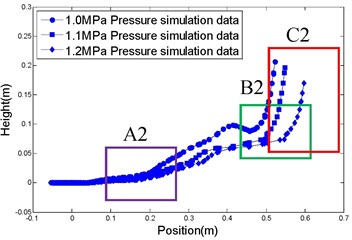
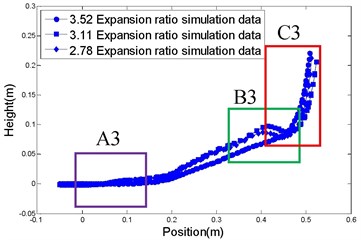
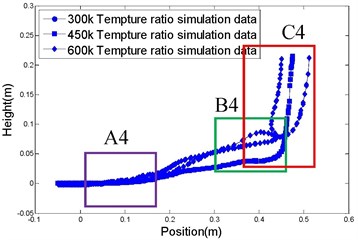
4.6. The effect of working conditions on jet buoyancy
The floating trajectories of bubble in horizontal jets at 0.1 s under different working conditions are shown in Fig. 7. The figure shows that, with increasing working depth, the floating height of the bubble decreases, as shown in Fig. 7(a). The larger the total pressure on the engine, the smaller the floating height of bubbles, as shown in Fig. 7(b). The larger the expansion ratio, the smaller the floating height of bubble, as shown in Fig. 7(c). The higher the temperature, the smaller the floating height of the bubble, as shown in Fig. 7(d). The reason for this phenomenon is described as follows: when the total pressure and temperature of the combustion chamber are constant, the working conditions of the motor are more onerous, the inertial resistance of the water is greater and the rate of momentum damping of the gas is faster. Thus the length of the jets is smaller and their floating height is smaller. When the working depth and temperature of the combustion chamber are constant, the greater the total pressure on the combustion chamber increases, the larger the momentum of the gas, which resulted in an increased jet length. The floating depth is small because the buoyancy is small. When the temperature increases, the velocity of the gas flow increases and the flux decreases so that the jet length increases. The depth of floating is small because the volume of the bubble is small so the effective area on which the buoyancy acts is small. When the nozzle expansion ratio of the motor is increased, the gas flow rate and momentum increases, the length of jets in the axial direction of motor increases and the depth of floating decreases.
Fig. 7Comparison of simulation, and experimental, results
a)
b)
c)
d)
From Fig. 7, it can be seen that the flow field of the underwater jet is divided into three sections (A, B, and C): A1 to A4 shows the initial section in which the momentum of the jet flow is large so that the deflection is small; B1 to B4 is the transition section. Under the influence of the refraction at the air-water interface, the jets appear to undulate, and C1 to C4 represents the main section, influenced by the effect of buoyancy and thus soaring to the top.
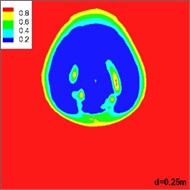
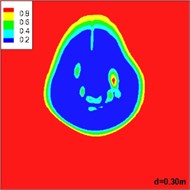
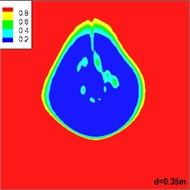
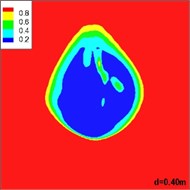
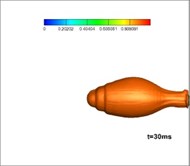
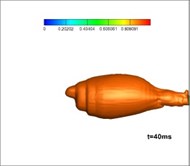
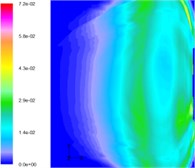
Fig. 8 shows the distribution of volume of gas in different sections of the horizontal jets as they flow away from the exit of the underwater motor. It is shown that the gas injected from the nozzle shows an upward trend under the influence of buoyancy. At the same time, the gas takes on an arcuate path due to the inertia of the water. Finally, the gas mingles with the incoming flow and buoyancy plays a dominant role. The change in the gas matches the floating curve.
Fig. 8Distribution of volume of gas in different sections of a horizontal jet flowing away from the exit of the underwater motor
4.7. Underwater jets and their phase transitions
Only the interaction between gas and water is considered in the simulation of gas-water two-phase flow, but heat and mass exchange are ignored. In fact, as long as the gas is mixed with water, there are complicated processes for blending both heat and mass. Gas is cooled by water, and the water vapor, when reached its evaporating point, and vice versa. The state of the water is mainly determined by the local pressure and temperature. Here, the standard principle of vaporization and condensation of water is used for simulation. After comparing the local temperature and pressure, the state of each local cell is decided. During heat transfer, the enthalpy transferred is a function of the local temperature gradient, and hence, the phase transition is quantified.
The gas produced in the burning process by a solid rocket motor is at a high temperature, so its interaction with the water will result in a complex process of phase transitions. Fig. 9 shows the developing structures of gas-water two-phase flow, while Fig. 10 shows the gas-water-vapor as a three-phase flow. Comparing these simulations it can be seen that the flow structures of jets, when considering phase transitions, are larger and wider than that without phase transitions. This is mainly because the phase transitions accelerate the exchange of energy and momentum among gas, water, and vapor, which is reflected in the expansion of bubble volume. According to the law of conservation of energy, the decreasing thrust is reasonable as the length of the jets in water, and the volume of the bubbles increases, whereas the thrust of a motor in a closed launching canister is increased.
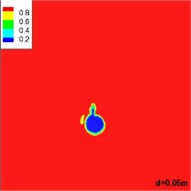
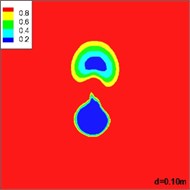
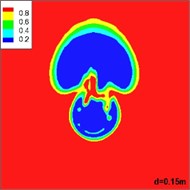
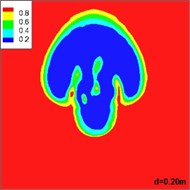
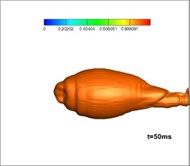
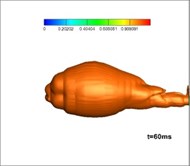
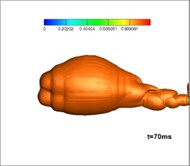
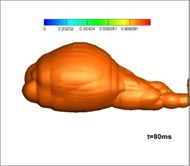
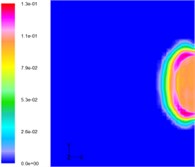
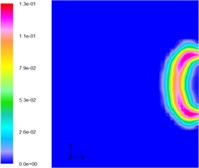
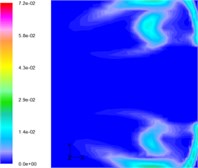
Fig. 11 shows the distribution of the volume of vapor in the flow structure of gaseous jets running underwater when considering phase transitions: when the motor starts working, there is a large amount of energy exchange between the gas and the water, which contributes to the production of vast vapor clouds surrounding the nozzle. With the development of gaseous jets, the vapor moves upwards along the gas-water interface under the effect of buoyancy due to its lower density. Eventually, when the jet is steady, the gas is surrounded by sufficient cold gas and the vapor floats and gather upwards continuously to the top of bubble until cooling to liquid water.
Fig. 9Developing structures of gas-water two-phase flow
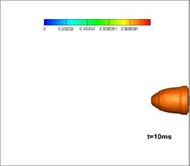
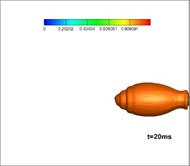
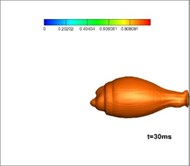
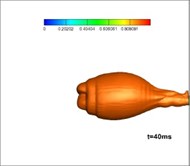
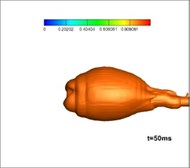


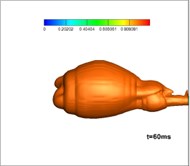
Fig. 10Developing structures of gas-water-vapor three-phase flow


The experimental installation used in this research is a high-pressure sealed container, which includes an experimental cabin and a balanced cabin. These two cabins are separated by a dam board. The test motor and transducer are placed in the experimental cabin. The balanced cabin is designed to control the pressure through valve and reduce interference to the experiment. The pressure could be controlled through a valve and gas cylinder to achieve different depths. Moreover, there is a closed-loop control system between the transducer in the water and the valve to keep the pressure stable, the detailed experimental process is as follows: fix the test gas generator with a nozzle on the test stand; connect and debug the measuring circuit; inject water and adjust the pressure; ignite and record data; open the drain valve; then analyze the data. The parameters of the experiment are as follows: depth of water: 30 m, total pressure in the gas generator: 8 MPa, temperature: 3000 K; expansion ratio: 6. The diameter of the nozzle exit is 100 mm.
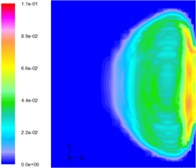
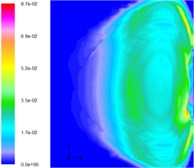
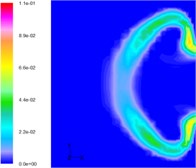
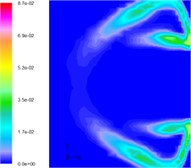
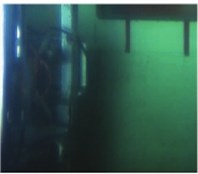
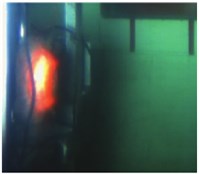
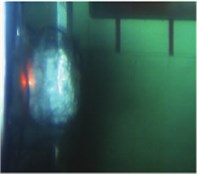
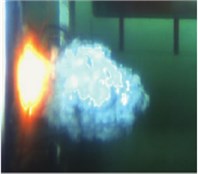
Fig. 12 shows the development of vapor in the simulation of three-phase jet flow at the onset of operation of the solid rocket motor. It is shown that at first, after making contact with the water, the burning gas is encompassed by the generated vapor forming a closed gasbag. With the exhausting of vast amounts of hot gas, a high-pressure area grows downstream of the jet. Thermodynamics dictates the difficulty of vapor formation herein, hence, the gas finally rushes out from the layered vapor. Fig. 13 shows the experimental results for three-phase jets [26]: the milk white gas is vapor, the development of which is consistent with that found in the numerical studies.
Fig. 11Distribution of the volume of vapor
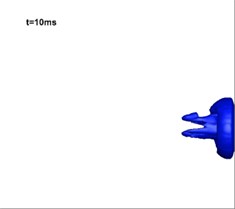
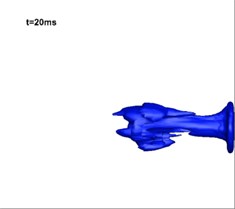
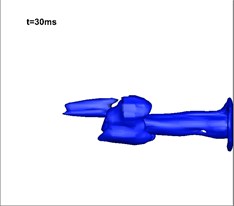
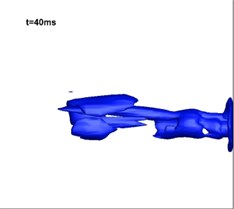
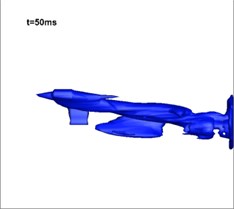
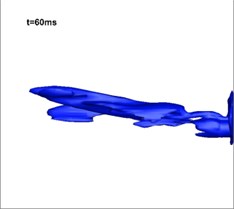
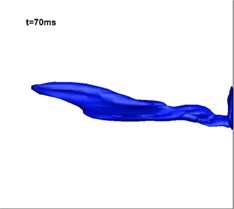
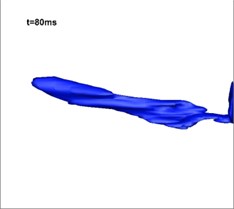
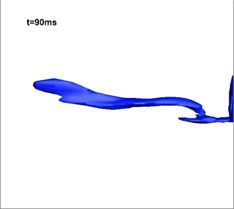
Fig. 12Development of vapor in the simulation of three-phase jet flow (numerical results)
From Fig. 13 (taken by a high-speed camera), it can be found that there is light emitted at the exit of the nozzle because the temperature of the gas is very high. However, downstream, there is no such light. This is because the water cools the hot gas, and so after absorbing the heat, the state of the water may change. In the initial period there is a layer of white vapor on the gas-water boundary and as seen in Fig. 13, this vapor surrounds the gas, and changes with the development of the flow. The simulation results verify this phenomenon. The closed vapor layer is struck by the hot gas flow. Hence, it can be concluded that the simulation results are consistent with those obtained experimentally.
Fig. 13Development of vapor in the simulation of three-phase jet flow (experimental results)
5. Conclusions
The jets considering gravity and buoyancy are more complex than those without gravity and buoyancy effects.
1) Theory predicts that the bubbles in a jet are different in three parts of the jet, namely the initial section, the transition section, and the main section. The numerical results in this paper agree with the experimental phenomena observed.
2) The four typical processes: expanding, bulging, necking/breaking, and back-attack in jets with gravity and buoyancy effects are the same as in those analyses neglecting these two forces. However, the shape of the bubbles under the action of gravity and buoyancy is different, and they now (obviously) float upwards.
3) The interaction between the jet gas and the water is more complicated. In the initial period, the jet gas will move towards the low pressure area and the momentum of the jet gas is low. With increasing momentum, the jet gas will rebound due to the inertial influence of the water. At the same time, bubbles in the main section will float, which will lead to thrust oscillation in the motor.
4) From distribution of pressure seen on the wall, we know that the pressure reverses over its height. After completing the four typical processes once, the distribution of water pressure will change in a manner akin to that of the initial perturbations. The timing/duration of the four typical processes differs with, and without, the effects of gravity and buoyancy.
5) The torque, in cases with gravity and buoyancy, is larger than that without gravity and buoyancy. According to the definition of the jet length, we compared jets under different working conditions and found that the parameters thereof influence the development of the jets.
6) The trajectories of gas jets float upwards under the influence of gravity and buoyancy. The trajectories, under different working conditions, are as follows: at the same time, the deeper the working conditions, the smaller the floating height; the larger the total pressure in the motor, the smaller the floating height; the larger the expansion ratio, the smaller the floating height; and the higher the temperature, the smaller the floating height.
7) Compared with the jets undergoing phase transitions, it can be concluded that the length of jets increases, as well the expansion volume of bubbles, while the thrust decreases, which is just the opposite of what happened in a closed zone (launching canister). An analysis based on the density of gas shows that the newly formed vapor will move upwards along the gas-water interface, which forms a closed area of vapor upon operation of the motor. With the exhausting of hot gas therefrom, the closed vapor area will be broken through some distance downstream.
References
-
Qian B. S., Yang B. Applied analysis for solid rocket motor used in the underwater vehicle. Torpedo Technology, Vol. 12, 2004, p. 21-23.
-
Garimella S., Killion J. D., Coleman J. W. An experimentally validated model for two-phase pressure drop in the intermittent flow regime for circular micro channels. Journal of Fluids Engineering, Vol. 125, 2003, p. 887-894.
-
Tang J. N., Wang N. F., Wei S. Flow structures of gaseous jets injected into water for underwater repulsion. Acta Mechanica Sinica, Vol. 27, 2011, p. 461-472.
-
Wang L. Q., Hao Z. R., Wu D. Z. Numerical simulation of initial flow field of underwater gas jet. Journal of Engineering Thermophysics, Vol. 30, 2009, p. 1131-1135.
-
Zhu W. B., Chen H. Computations for exhausted gas bubble of underwater solid rocket motor. Journal of Solid Rocket Technology, Vol. 32, 2009, p. 486-491.
-
Zhu W. B., Chen H., Huang S. Numerical study of the process of the evolution of bubble of high-speed jet underwater. Journal of Propulsion Technology, Vol. 31, 2010, p. 496-502.
-
Ni M. J. Bubble rising driven by buoyancy with deformation and standing vortex. Journal of Engineering Thermophysics, Vol. 30, 2009, p. 76-80.
-
Feng Z. C., Leal L. G. Nonlinear bubble dynamic. Annual Review of Fluid Mechanics, Vol. 29, 1997, p. 201-243.
-
Dewsbury K., Karamanev D. G., Margaritis A. Rising solid sphere hydrodynamics at high Reynolds numbers in non-Newtonian fluids. Chemical Engineering Journal, Vol. 87, 2002, p. 129-133.
-
Shew W. L., Poncet S., Pinton J. F. Viscoelastic effects on the dynamics of a rising bubble. Journal of Statistical Mechanics Theory and Experiment, Vol. 1, 2006, p. 01009-01024.
-
Wu M. M., Gharib M. Experimental studies on the shape and path of small air bubbles rising in clean water. Physics of Fluids, Vol. 14, 2002, p. 49-52.
-
Saffman P. G. On the rise of small air bubbles in water. Journal of Fluid Mechanics, Vol. 1, 1956, p. 249-279.
-
Feng Z. C., Lea L. G. Nonlinear bubble dynamic. Annual Review of Fluid Mechanics. Vol. 29, 2010, p. 201-249.
-
Yoshida S., Manasseh R. Trajectories of rising bubbles. The 16th Japanese Multiphase Flow Symposium, Hokkaido, Japan, 1997.
-
Shew W. L., Pinton J. F. Dynamical model of bubble path instability. Physical Review Letters, Vol. 97, 2006, p. 144508.
-
Dewsbury K., Karamanev D. G., Margaritis A. Hydrodynamic characteristics of free rise of light solid particles and gas bubbles in non-Newtonian liquids. Chemical Engineering Science, Vol. 54, 1999, p. 4825-4830.
-
Tsuge H., Hibino S. The motion of single gas bubbles rising in various liquids. Proceedings of the Fujihara Memorial Faculty of Engineering Keio University, Vol. 35, 1971, p. 65-71.
-
Gan X. S., Jia Y. J., Lu C. J., et al. Research on numerical simulation of combustion gas jet under water. Journal of Solid Rocket Technology, Vol. 32, 2009, p. 23-26.
-
Liu J. T., Qin S. J., Miao T. C., et al. Three-dimensional numerical simulation of air exhausted from submerged nozzles. International Symposium of Cavitation and Multiphase Flow, Vol. 72, 2015, p. 042038.
-
Shi H. H., Wang J., Chen S., et al. Experimental study on flow characteristics at the initial injection stage of underwater supersonic gas jets. Journal of University of Science and Technology of China, Vol. 44, 2014, p. 233-237.
-
Guo Q., Shi H. H., Wang C., et al. Study on gas-liquid complex flow induced by submerged supersonic GA jets. Journal of Engineering Thermophysics, Vol. 33, 2012, p. 809-802.
-
Wang C., Wang J. F., Shi H. H. Numerical simulation and experiments on submerged supersonic gas jets. CIESC Journal, Vol. 65, 2014, p. 4293-4300.
-
Tang Y. L., Li S. P., Liu Z., et al. Study on the initial characteristics of the underwater rocket in the horizontal jet. Act Physica Sinica, Vol. 23, 2015, p. 185-197.
-
Shi H. H., Wang J. F., Chen S., et al. Experimental study on flow characteristics at the initial injection stage of underwater supersonic gas jets. Journal of University of Science and Technology of China, Vol. 44, 2014, p. 233-237.
-
Someya S., Uchida M., Li Y. R., et al. Entrained droplets in underexpanded gas jet in water. Journal of Visualization, Vol. 14, 2011, p. 225-236.
-
Zhang X. Y., Tang Y. L., Tang J. N., et al. Impact of phase transitions on the flow structure of gaseous jets injected into water. 51st AIAA/SAE/ASEE Joint Propulsion Conference, Orlando, Florida, 2015.
Cited by
About this article

The authors thank the National Natural Science Foundation of China for their support (under Grant No. 11272055).
