Abstract
To improve the power generation efficiency, the parameters matching analysis method for the downhole generator with asymmetric turbine is established on basis of the experimental design theory, response surface methodology and orthogonal experimental design. Firstly, according to the theoretical analysis, the computational domain model is built by the three-dimensional modeling software. Based on the calculation results by Computational Fluid Dynamics (CFD), the blade parameters of stator and rotor which affect the objective function a lot are screened out by the single-factor experimental design. Then, to get the optimal design results, these parameters are analyzed and determined by the Box-Behnken design and response surface methodology. Once the approximation model of objective function is constructed, the interplay between these parameters is discussed in this paper. Furthermore, the secondary factors are analyzed to obtain the more reasonable matching by orthogonal experimental method. Finally, the experimental study is conducted on the optimal design point of the new asymmetric turbine. The results show that CFD simulations are in good accordance with the calculations based on response surface method. The relative error of experimental value is smaller compared with the predictive value, and the trends of performance curves are almost the same. What’s more, the efficiency of new asymmetric turbine increases by 10 % after optimizing matching. It declares that the design method based on Box-Behnken and the orthogonal design experiments can be used in the matching analysis of asymmetric turbine’s parameters. The research in this paper provides reliable guidance in turbine blade design and technological parameters optimizing.
1. Introduction
Turbine generator can adapt high temperature and high pressure in the downhole environment. It has many advantages in underground power supply, for which using drilling fluid flow to make long-term and persistent electricity. Due to the limitation of the installation size, the spiral blade is often adopted for downhole turbine generator [1, 2]. Scholars and research institutions had discussed the analysis methods and relevant test methods theoretically and experimentally for the turbine [3-6]. XianYong Z. and Jin F. studied the performance difference of three kinds of turbines with the spiral blade, which are uniform-pitch, varying-pitch and the changing-width-blade turbine, respectively. They also studied the turbine with uniform thickness and uniform pitch, and gained the simple theoretical calculation formula. Due to lack of the stator basin calculation model and analysis of the inlet angle of the rotor, the theoretical calculation method is only applicable to the turbine with a single rotor [7-9]. BaoDe J. et al. focused on blades improvement of the turbine, which is the key component of downhole turbine generator [10, 11]. In recent years, some optimization methods have been applied to the design of centrifugal impeller. Ashimara studied the performance of pump impeller by inverse problem method and combining gradient optimal method with exploratory technique [12]. Wahabi W. et al. used multi-objective genetic algorithm and the CFD for optimization of impeller’s guide blade [13, 14]. Lei Z. and Chunlin W. et al. carried out optimization design on fire pump and centrifugal impeller blades based on the theory of experimental design and response surface approximate methods [15, 16]. Photene K. and Nan Z. et al. employed Box-Behnken experimental design to optimize different objective functions, and all these studies proved that Box-Behnken experimental design can be correctly, quickly presented the relationship between factors and responses in the form of functions and intuitive graphs. On the other hand, the calculation of the design process can be effectively reduced [17-20]. Improvement design of blade profile is more usual in current research, and few studies have examined the interaction of parameters between the stator and rotor. Different matching types of structure parameters will significantly affect the performance of the turbine. Therefore, matching analysis method of structure parameters for the asymmetric turbine, which based on the experimental design, response surface methodology and the orthogonal design method was proposed for the first time. In this paper, the optimal matching combination was obtained. Also the hydraulic efficiency of the turbine was improved without changing or redesigning the blade structure. Then the power generation efficiency of the downhole turbine generator was increased.
2. Downhole turbine generator design theory and modeling
When the peripheral parts are removed, the structure diagram of downhole mud turbine generator is shown in Fig. 1(a). Turbine is one of the most important parts of downhole turbine generator. This study focuses on the turbine with spiral blades, which is composed of a stator and rotor in Fig. 1(b). The stator acts as a guide roller, which is fixed in front of the turbine, and adjusts the mud flow direction of shocking to blade surface to improve the efficiency. The rotor is the power component. Drilling fluid impacts the turbine blades to produce circumferential force which makes turbine rotate, thus promoting the generator to achieve power generation.
Fig. 1The structure of downhole turbine generator
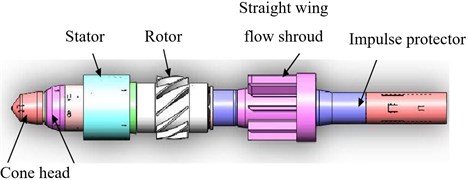
a) The structure diagram of downhole mud turbine generator
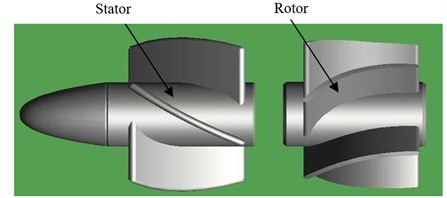
b) The turbine composed of a stator and rotor
2.1. Design theory of downhole turbine
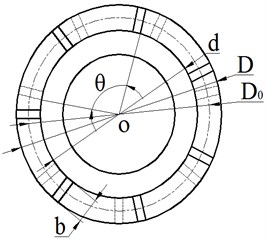
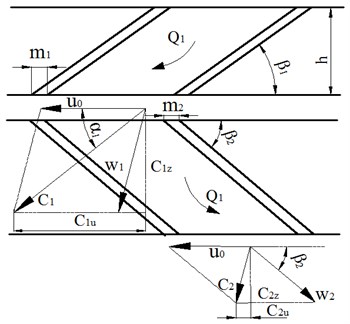
The theoretical basis of this paper is the design theory of spiral blades that have uniform pitch and blade thickness. Because the structure of the stator and rotor is the same, a 3-d model of the rotor or stator is shown in Fig. 2(a). Meanwhile, the top view of the 3-d model is shown in Fig. 2(b). In order to analyze conveniently, the characteristic plane is unfolded through the characteristic cylindrical layers with a diameter of . So, when the characteristic cylindrical layers of stator’s and rotor’s are all unfolded on a plane like above method, the velocity triangle of drilling fluid at the inlet and outlet of rotor can be shown in Fig. 2(c).
Fig. 2Drilling fluid velocity triangle at the inlet and outlet of the rotor: Q1 – actual flow through turbine channel; w – relative velocity of flow fluid through blades; u0 – circumferential velocity of liquid rotating with rotor blades; c – absolute velocity of flow fluid; α1 – inlet flow angle of rotor; β – spiral angle; 1 –parameters of footnotes at outlet of stator and inlet of rotor; 2 – parameters of footnotes outlet of rotor; z –parameters of footnotes axial velocity; u – parameters of footnotes circumferential velocity; d – the inner diameter of blade; D – outer diameter of blade; D0 – medium diameter; θ – wrap angle at blade section or rotation angle of blade; b – the radial height of blade; m1, m2 – blade thickness of the stator and rotor
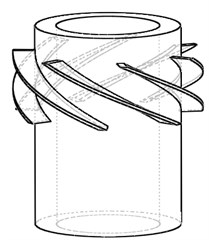
a) 3-D model of the rotor
b) The top view of the rotor
c) Drilling fluid movement in stator and rotor of the turbine
In the Fig. 2, is the inlet velocity of rotor, which is determined by the axial velocity . is the inlet flow angle of the stator, is the spiral angle of stator and it can be obtained: through the geometric definition. Once drilling fluid enters the rotor channel, it will rotate with the rotor and the circumferential velocity can be expressed by:
In the Fig. 2(c), and represent the circumferential components of and , which are the absolute speed at the inlet and outlet of the rotor, respectively. They can be calculated by:
where is the spiral angle of stator, is the circular velocity, is the spiral angle of rotor, is the actual axial velocity of fluid in stator and is the actual axial velocity of fluid in rotor.
By the liquid velocity triangle at inlet and outlet of rotor, the liquid impacts blades to produce torque , which can be calculated by:
where is the density of water, is the flow rate, for axial flow turbine, there is .
From Eqs. (1-3), the torque can be expressed by:
The output power of turbine blades is:
where is the rotation speed, is the angular velocity.
Because blades have a certain thickness and number, excretion coefficient should also be considered for the influence of the axial velocity, so, the actual axial velocity should be calculated as:
here, is the theoretical axial velocity, and are the excretion coefficient:
where , are the blade number of stator and rotor, respectively, is the blade thickness.
The theoretical axial velocity can be expressed by:
where is the radial height of blade.
By Eqs. (3-8), they can be converted to:
According to Eq. (9), if the flow rate , output power , rotational speed are given by design requirements, the relation between the spiral angle of and can be calculated with a known number of blades (, ) and blade thickness (, ). Because the theoretical calculation is suitable for the ideal model that the rotor and stator should completely be symmetrical structure. That is, , , .
Initial design parameters: the outer diameter of blade 128 mm, the inner diameter of blade 98 mm, the radial height of blade 15 mm, the medium diameter 113 mm, the blade thickness 5 mm, the blade number 7.
Design requirements: the output power 1000 W, the flow rate 27-35 L/s, the rotation speed 1500-2500 r/min. In this paper the initial flow rate is 27 L/s, the rotation speed is 1500 r/min and 1000 W. Taking the known parameters into Eq. (9), it can be obtained: 44.71°.
Another indirect calculation parameter of blade structure, shown in Fig. 1(b) is wrap angle or rotation angle. It can be expressed by:
where is the overlap coefficient, is the blade number.
The axial height h of blade can be expressed by:
Assuming that 90°, where and represent rotation angle of stator and rotor, respectively. When the rotation angle and spiral angle are known, the axial height can be identified according to Eq. (11). Hence, a 3d model can be presented based on the known parameters of the turbine. After being modified and improved, the three-dimensional grids of the turbine model embracing the global grid is shown in Fig. 3.
Fig. 3Grid computing model
3. Objective function definition
The main function of the turbine in the generator is to convert the hydraulic power into mechanical energy, which is transferred to the generator rotor to achieve power by the shaft. The main performance parameters that determine the properties of turbine include torque, output power, pressure drop and efficiency. When the turbine works under the rated condition, the loss of energy is minimum and the efficiency is maximum. In this paper, the maximum turbine efficiency, which has a linear relation with torque and pressure drop, is selected as the objective function. The objective function is:
where is the maximum efficiency of turbine, represents the output power described as , and is the torque at maximum efficiency, is the corresponding rotation speed at maximum efficiency, , which is the input power, is the pressure drop and is the flow rate at maximum efficiency.
4. Single-factor experiment design and parameters selection
The symmetry turbine is selected as the initial model. , , and are the parameters of the stator, and , , and are the parameters of the rotor. The control parameters of initial model are determined by the above theoretical analysis, so the relevant parameters of initial model are set as: 44.71°, 90°, 5, 5 mm. Table 1 shows the schemes arrangement of sensitive analysis based on single-factor design method.
Table 1Single-factor experiment design
Number | / (°) | / (°) | / (°) | / (°) | / mm | / mm | ||
Turbine0 | 44.71 | 44.71 | 5 | 5 | 90 | 90 | 5 | 5 |
Turbine1 | 38 | 44.71 | 5 | 5 | 90 | 90 | 5 | 5 |
Turbine2 | 44.71 | 38 | 5 | 5 | 90 | 90 | 5 | 5 |
Turbine3 | 44.71 | 44.71 | 8 | 5 | 90 | 90 | 5 | 5 |
Turbine4 | 44.71 | 44.71 | 5 | 13 | 90 | 90 | 5 | 5 |
Turbine5 | 44.71 | 44.71 | 5 | 5 | 60 | 90 | 5 | 5 |
Turbine6 | 44.71 | 44.71 | 5 | 5 | 90 | 120 | 5 | 5 |
Turbine7 | 44.71 | 44.71 | 5 | 5 | 90 | 90 | 3 | 5 |
Turbine8 | 44.71 | 44.71 | 5 | 5 | 90 | 90 | 5 | 3 |
Fig. 4Comparisons of torque
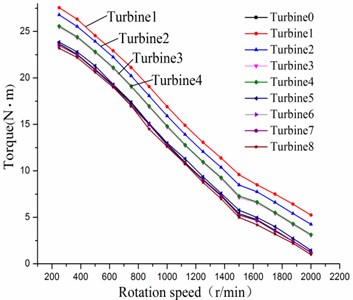
Fig. 5Comparisons of efficiency
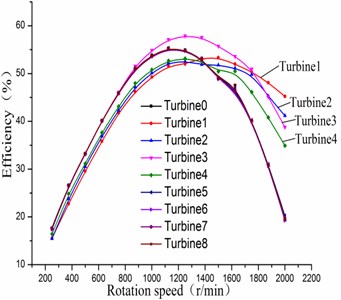
Fig. 6Comparisons of pressure drop
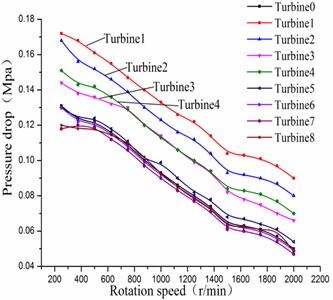
Fig. 7Comparisons of power
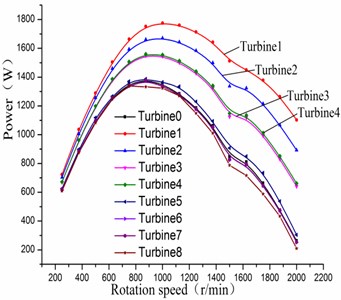
Figs. 4-7 show the comparisons of the performance for sensitive analysis of blade variables. It can be seen that , , and have a greater impact on the turbine performance at a certain speed range. However, , , and have little effect on the turbine performance, showing that the value of those four parameters can be chosen in a wide range. When the stator’s spiral angle is small, the turbine efficiency is less than the efficiency of the initial turbine. In addition, by increasing the stator blade number, it can make the turbine efficiency close to 60 % when the rotation speed is 1200 r/min. The changing of the rotor’s spiral angle will have great influence on the turbine efficiency. When the blade number of the rotor increases, the maximum efficiency of the turbine is not improved but reduced instead. So, it is visible that rotor blade number is unfavorable for overmuch. The four significant factors which are , , , respectively, can be obtained. Meanwhile, they will be selected as the objects for the later design and analysis based on response surface method.
5. Box-Behnken design and the response surface analysis
In order to conduct the combination design of blades parameter, the Box-Behnken method is adopted. On account of multiple factors of blades and the characteristic of the method, it is chosen four factors and three levels arranged in Table 2. The values of other control parameters are selected from the initial model.
Table 2Impact factors and level of Box-Behnken method
Factor | Level | ||
–1 | 0 | 1 | |
/ (°) | 20 | 33 | 46 |
/ (°) | 20 | 33 | 46 |
5 | 10 | 15 | |
5 | 10 | 15 | |
Table 3The evaluation precision of response surface
Sample number | C.V. % | ||
29 | 0.9929 | 0.9857 | 1.91 |
According to the Box-Behnken design method, 29-group schemes were determined. To calculate the experimental error repeatedly, 24-group schemes were for factorial points and others for the center point. The influence between the objective function and control parameters was obtained by the Design Expert software. The evaluation coefficients of response surface are shown in Table 3. The values of and are close to 1, indicating that the response surface fitted by experimental sample can be a very good approximation of the real value.
The relationship between the objective function and the blade variable can be expressed through the established mathematical model, namely the response surface regression equation for the significant factors as follows:
Fig. 8Impacts of β1 and β2 on efficiency
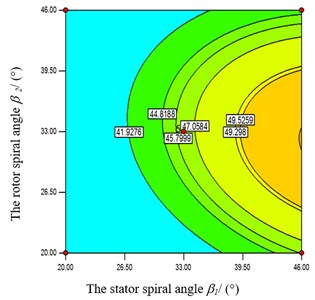
Fig. 9Impacts of β1 and Z1 on efficiency
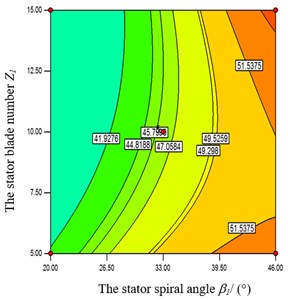
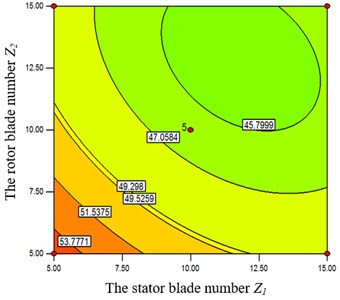
In the Fig. 8, when the rotor’s spiral angle is at a middle level, the objective function value increases accordingly with the augment of stator’s spiral angle . Also the objective function value has a bigger value when is at the high level. Meanwhile, the objective function is strongly influenced by stator’s spiral angle from Figs. 9-10. When and take a certain value, the objective function value increases with the augment of . From Fig. 9, when takes the high level, the objective function has a greater value at both ends of the high and low level of . From Fig.10, when takes the high level, the objective function has a greater value at a low level of . From Figs. 11-12, when the rotor’s spiral angle is at the middle level, the objective function value increases gradually along with the augment of the and . In the Fig. 13, the objective function decreases with the increasing of and at the same time.
Fig. 10Impacts of β1 and Z2 on efficiency
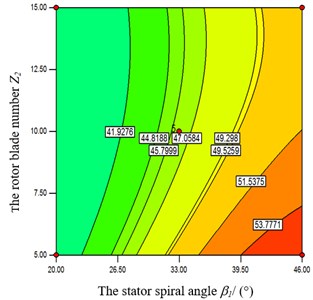
Fig. 11Impacts of β2 and Z1 on efficiency
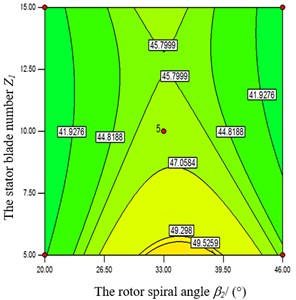
Fig. 12Impacts of β2and Z2 on efficiency
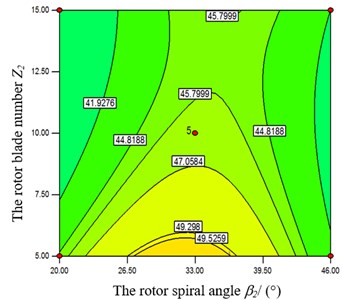
Fig. 13Impacts of Z1 and Z2 on efficiency
Optimization variables within the scope of high and low levels in the above Table 2 are obtained by Design Expert. Then the optimization results obtained by response surface method were compared with the simulation results calculated by CFD in the same condition, as shown in Table 4. After the optimization matching, the objective function value is obviously improved. The predicted values of the fitting formula and the CFD calculation values are very close, showing that the response surface method is reliable. Therefore, response surface method can be used for matching analysis of turbine parameters to improve the efficiency of the turbine generator.
Table 4Optimal parameters and result verification
Preferred parameters | Predicted efficiency / % | Simulation efficiency / % | Initial value / % | |||
/ ° | / ° | |||||
46 | 29.18 | 15 | 5 | 58.3574 % | 56.72 % | 49.06 % |
6. Orthogonal experimental design and analysis of the secondary control parameters
The factors and levels of secondary control parameters in orthogonal experiments are shown in Table 5. As seen from Table 6, the maximum efficiency is obtained through the experiment 1 with a level combination of (The superscript denotes a certain level of the corresponding factor). The average value of 1, 2 and 3 are respectively the experimental results for a certain factors in the three levels. The optimal level in theory is the combination of from Table 6. However, the optimal result of the experiment is not fit with the optimal level combination in theory, indicating that it also needs to further comparison. The turbine efficiency of optimal combination in theory is 61.69 % by further simulation analysis, which is bigger than the efficiency of experiment 1. Thus, the optimal combination is the level combination of . That is to say, the values of secondary control parameters are 2 mm, 5 mm, 60°, respectively.
Table 5Second significant impact factors and level of Orthogonal design method
Number | 1 | 2 | 3 | 4 |
Factors | / mm | / mm | / ° | / ° |
Level 1 | 2 | 2 | 60 | 60 |
Level 2 | 3.5 | 3.5 | 90 | 90 |
Level 3 | 5 | 5 | 120 | 120 |
Table 6Orthogonal experiment of second significant impact factors
Number | 1 | 2 | 3 | 4 | |
Factors | / mm | / mm | / ° | / ° | Result (%) |
Experiment1 | 2 | 2 | 60 | 60 | 61.62 |
Experiment 2 | 2 | 3.5 | 90 | 90 | 60.2 |
Experiment 3 | 2 | 5 | 120 | 120 | 57.03 |
Experiment 4 | 3.5 | 2 | 90 | 120 | 55.52 |
Experiment 5 | 3.5 | 3.5 | 120 | 60 | 58.36 |
Experiment 6 | 3.5 | 5 | 60 | 90 | 59.77 |
Experiment 7 | 5 | 2 | 120 | 90 | 54.44 |
Experiment 8 | 5 | 3.5 | 60 | 120 | 55.27 |
Experiment 9 | 5 | 5 | 90 | 60 | 57.7 |
Average1 | 59.617 | 57.193 | 58.887 | 59.227 | |
Average 2 | 57.883 | 57.943 | 57.807 | 58.137 | |
Average 3 | 55.803 | 58.167 | 56.610 | 55.940 |
7. Experimental verification and results
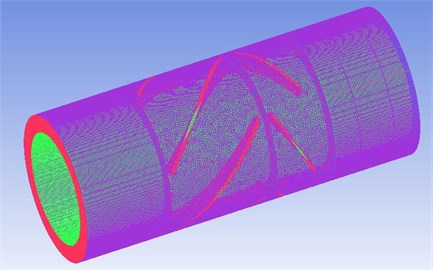
An optimal design point is selected as the optimal turbine model, and the control parameters are 46°, 29.18°, 15, 5, 2 mm, 5 mm, 60°, respectively. After the optimization design, parameters of rotor and stator are matched rationally to process molding turbine to conduct a test. The test is proceeded in a performance test bench with 10 levels of turbodrill in the lab of Southwest Petroleum University, and the test system diagram is shown as Fig. 14. It shows the structure of the turbine bench, which mainly consists of pumping device, loading device, the body of bench, automatic control and data acquisition. In order to ensure a constant of the displacement of fluid, the closed-loop control system of displacement in multistage centrifugal pump is adopted. And the magnetic powder brake is chosen as a loading device controlled by the computer automatically. Then automatic control is conducted by the closed-loop device including the flow measurement, adjustment and execution part. Finally, the data acquisition and processing are accomplished by the computer and data processing software. To verify the reliability of the simulation model, the bench test of ten-stage turbines (Fig. 15) is performed with water instead of drilling fluid at a certain flow rate and different speeds for the characteristic of torque , pressure drop and efficiency , and the flow rate at the inlet is set to 27 L/s, which can make the same normal speed to the simulation boundary condition. Then the testing instruments should be preheated by electricity more than 15 minutes, and the turbines are started at a low speed to make the bearings running in for 15 minutes.
A numerical flow field simulation of the design and the off-design turbine model is carried on, which is compared with experimental results. From Figs. 16-17, the initial value is the numerical simulation results of turbine with a symmetric structure. The predictive value denotes the numerical simulation results of turbine after optimizing design and matching. The experimental value is the result of the external characteristic test of the optimized turbine model.
Fig. 14Diagram of turbine bench: 1 – magnetic powder brake; 2 – coupling; 3 – torque speed sensor; 4 – the pressure gauge; 5 – bench; 6 – pressure transmitter; 8 – electric control valve; 9 – lwgb; 10 – manual station; 11 – servo amplifier; 12 – flow totalizer; 13 – electric indicating controller; 14 – impedance converter; 15 – multistage centrifugal pump; 16 – water tank; 17 – printer; 18 – data sampling board; 19 – computer; 20 – torquemeter; 21 – stabilized current supply (Tunableness)
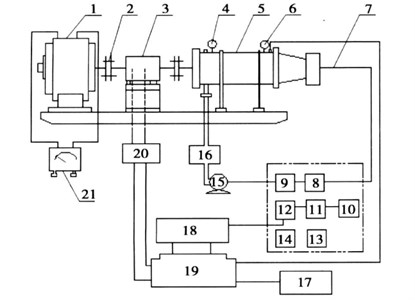
Fig. 15Testing bench of ten-stage turbines
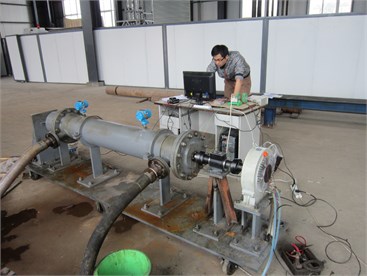
Fig. 16Comparisons of efficiency
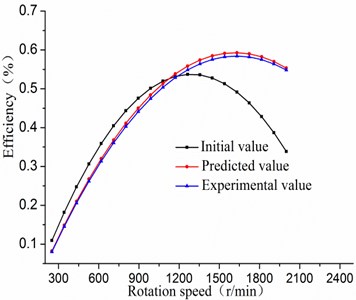
Fig. 17Comparisons of torque
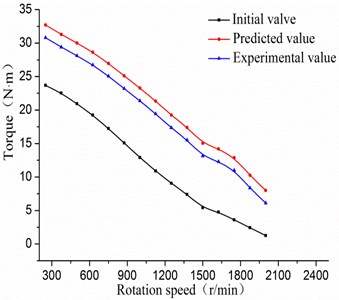
In the Figs. 16-17, the maximum initial efficiency value is about 55.309 %, and the corresponding torque value is 9.068 N·m when the rotation speed is 1250 r/min. The maximum predicted efficiency can be up to 64.824 % when the rotation speed is 1750 r/min, and its corresponding predictive torque value is 12.89 N·m. Hence, the efficiency value after optimizing match is increased by 10 % than the initial value. From Fig. 16, turbine efficiency is obviously improved when the rotation speed is bigger than 1200 r/min, and the high efficient area moves to the right. This is due to that the total number of turbine blades increasing after optimizing match, and the pressure loss is large in the low speed region, which leads to low efficiency. From the two diagrams, the relative error of experimental value is smaller compared with the predictive value, and the trends of performance curves are almost the same. It declares that the design method based on Box-Behnken and the orthogonal design experiments can be used in the matching analysis of asymmetric turbine’s parameters.
8. Conclusions
(1) The symmetrical turbine model was selected as the initial model and its parameters were determined through the theoretical calculation. With the single-factor experimental design, sensitive analysis on the structural parameters was conducted. As a result, four significant factors of blades influencing efficiency were screened out, which included the stator’s spiral angle , the rotor’s spiral angle , the stator’s blade number and rotor’s blade number . Also the four secondary factors can be obtained: the stator’s blade thickness , the rotor’s blade thickness , the stator’s blade rotation angle and the rotor’s blade rotation angle .
(2) Based on the Box-Behnken design and response surface method, the mathematical model relating to the objective function and the blade variables was exactly established for the optimum combinations of parameters. Combined with orthogonal experiment, the influence of four secondary control parameters on the turbine performance was analyzed. Moreover, the final eight parameter values are 46°, 29.18°, 15, 5, 2 mm, 5 mm, 60°, respectively.
(3) The experimental study was conducted on the optimal design point of the asymmetric turbine. The results show that CFD simulations are in good accordance with the calculations based on response surface method, and the efficiency value after optimizing match is increased by 10 % than the initial value. The relative error of experimental value is smaller compared with the predictive value, and the trends of performance curves are almost the same. It declares that the design method based on Box-Behnken and the orthogonal design experiments can be used in the matching analysis of asymmetric turbine’s parameters.
References
-
Yue S., Yinao S., Lin L., et al. Design of downhole turbine alternator for measurement while drilling and its performance analysis. Journal of Acta Petrolei Sinica, Vol. 29, Issue 6, 2008, p. 907-912.
-
Jin J., Weibing C., Yingna G. Control and optimization of the generator electromagnetic torque of rotary steering drilling tools. Journal of Acta Petrolei Sinica, Vol. 32, Issue 6, 2011, p. 1055-1060.
-
Hoschek J., Müller R. Turbine blade design by lofted B-spline surfaces. Journal of Computational and Applied Mathematics, Vol. 119, Issue 1, 2000, p. 235-248.
-
Bernard M., Maryse P., Anne M., et al. Improving efficiency of a 195 MW Francis turbine using numerical simulation tools. Proceedings of the 20th IAHR Symposium, Charlotte, North Carolina, USA, 2000.
-
William H. B., Edward C. F., Henry M. Fluid-Driven Alternator Having an Internal Impeller. Patent, US 6607030, 2003.
-
Ruprecht A. Unsteady flow analysis in hydraulic Turbma Chinery. Proceedings of the 20th IAHR Symposium, Charlotte, North Carolina, USA, 2000.
-
Xianyong Z., Jin F. Hydraulic behaviour research of three types of under-well helical turbine. Journal of Machinery, Vol. 37, Issue 11, 2010, p. 11-19.
-
Guanyun L., Xianyong Z., Jin F., et al. A turbine design and test for a downhole generator. Journal of Oil and Gas Technology, Vol. 33, Issue 5, 2011, p. 152-155.
-
Xianyong Z., Jin F. Hydraulic behaviour research of under-well variable-pitch turbine. Journal of Machinery, Vol. 36, Issue 2, 2009, p. 26-28.
-
Baode J., Zhiming W., Haile Q., et al. Turbine design of turbine generator system for LWD. Journal of Optics and Precision Engineering, Vol. 20, Issue 3, 2012, p. 616-624.
-
Zhiming W., Zhijun J., Yun G. The turbine parameter study of down-hole turbine generator of while drilling for exploring of China Sea. International Ocean and Polar Engineering Conference, Vol. 15, Issue 20, 2014, p. 906-908.
-
Ashimara K., Goto A. Turbomachinery blade design using 3-D inverse design method, CFD and optimization algorithm. Proceedings of ASME Turbo Expo, New Orleans, 2001, p. 1-9.
-
Wahba W. A., Tourlidakis A. A genetic algorithm to the design of blade profiles for centrifugal pump impellers. AIAA Paper, 2001, p. 2001-2582.
-
Benini E., Tourlidakis A. Design optimization of vaned diffusers of centrifugal compressors using genetic algorithms. AIAA Paper, 2001, p. 2001-2583.
-
Chunlin W., Haibo P., Jian D., et al. Optimization for s-type blade of fire pump based on response surface method. Journal of Mechanical Engineering, Vol. 49, Issue 10, 2013, p. 171-176.
-
Lei Z., Haibo P., Lei H., et al. Optimization of impeller for hydrodynamic turbine based on response surface method. Journal of Hydraulics Pneumatics and Seals, Vol. 3, Issue 3, 2014, p. 7-11.
-
Photene K., Evdokea V., Spyros G., et al. A green ultrasound-assisted extraction process for the recovery of antioxidant polyphenols and pigments from onion solid wastes using Box-Behnken experimental design and kinetics. Journal of Industrial Crops and Products, Vol. 77, Issue 1, 2015, p. 535-543.
-
Nan Z., Ming J., Tao P., et al. Application of box-behnken design in optimization of allelopathic effects of potamogeton pectinatus against microcystis aeruginosa. Journal of Transactions of Tianjin University, Vol. 20, Issue 5, 2014, p. 344-349.
-
Wenjun G., Yunpeng Z., Yijun Z., et al. Optimization strategies for separation of sulfadiazines using Box-Behnken design by liquid chromatography and capillary electrophoresis. Journal of Central South University of Technology, Vol. 14, Issue 2, 2007, p. 196-201.
-
Jaya Sre V.C., Devlina D., Nilanjana D. Optimization of parameters for cerium (III) biosorption onto biowaste materials of animal and plant origin using 5-level Box-Behnken design: equilibrium, kinetic, thermodynamic and regeneration studies. Journal of Earths, Vol. 32, Issue 8, 2014, p. 745-758.
Cited by
About this article

This work was supported financially by Applied and Basic Research Project in Sichuan Province of China (2014JY0229).
