Abstract
This study aimed to investigate the effects of increasing and decreasing crossflow velocities on the fluid-elastic instability behaviors of cylinder arrays. The responses of an elastically mounted cylinder in a rigid normal square cylinder array in a water tunnel subjected to crossflow were tested. The responses were simultaneously obtained from both in-line and transverse vibrations. Results show that the responses under increasing freestream velocity differ from those under decreasing freestream velocity. Under decreasing freestream velocity, fluid-elastic instability was accompanied by nonlinear hysteresis, and the cylinder exhibiting this instability can remain in this state for a certain range of flow velocities. Added mass coefficients were also obtained. Two criteria for fluid-elastic instability were applied.
1. Introduction
Flow-induced vibrations, especially the crossflow-induced vibration of cylinder arrays, are important phenomena for numerous engineering applications. Fluid-elastic instability is a self-excited vibration generally recognized as a flow-induced vibration mechanism that most likely results in cylinder failure in cylinder-like structures [1]. Fluid-elastic instability can destroy cylinders in a short time. Two mechanisms are generally responsible for fluid-elastic instability: the damping mechanism [2, 3] and the stiffness mechanism [4]. Understanding the phenomenon of fluid-elastic instability is necessary for the designers of cylinder-like structures to predict and avoid dangerous flow conditions.
Considerable theoretical and experimental research efforts have been conducted by many scholars over the last several decades to discover the fluid-elastic instability behaviors of cylinder arrays. Connors [5] proposed the first criterion for fluid-elastic instability. Thereafter, Pettigrew and Gorman [6], Païdoussis [7], and Weaver and Fitzpatrick [8] introduced criteria for different conditions. In recent years, Khalifa, et al. [9] modeled the phase lag causing fluid-elastic instability in a parallel triangular tube array. Yan, et al. [10] tested the shell side flow-induced vibration of a conical spiral tube array. Shinde, et al. [11] simulated the fluid-structure interaction in a tube array under crossflow at moderate and high Reynolds numbers. Sawadogo and Mureithi [12, 13] measured the fluid force and time delay of a rotated triangular tube array in the state of fluid-elastic instability.
Operating equipment with cylinder arrays involves the increase and decrease of crossflow velocity. However, numerous scholars often only pay attention to the effort of increasing crossflow velocity and neglect the effort of decreasing this parameter on cylinder arrays in the state of fluid-elastic instability. Studying the effort of decreasing crossflow velocity is also very important to understand the nature of fluid-elastic instability and reduce the cost and risk of operating cylinder-like structures in industrial applications. This study comprehensively investigated the effects of increasing and decreasing flow velocities on the fluid-elastic instability behaviors of cylinder arrays. In specific, this study observed the responses of an elastically mounted cylinder in a rigid normal square cylinder array with a pitch-to-diameter ratio () value of 1.67 in a water tunnel under both increasing and decreasing crossflow velocities. The responses in both in-line and transverse directions were obtained. Then, the response amplitude, power spectral density functions, response frequencies, and added mass coefficients were analyzed. Our research contributes to the field of flow-induced vibration and provides insights into the fluid-elastic instability of cylinder arrays under decreasing flow velocity. This research is beneficial for designing and operating equipment with cylinder arrays and for further understanding the fluid-elastic instability of cylinder arrays.
2. Experimental details
2.1. Experimental apparatus and instrumentation
Fig. 1 shows a schematic of the experimental loop used in the present work. This setup has been extensively applied to research on the crossflow-induced vibration of cylinder arrays [12-17]. The working fluid was water. Water was pumped through a tank, an electromagnetic flowmeter and two valves, and flowed past steady flow plates to stabilize the incoming flow before entering the test section. The parameters of the hardwares of the experimental setup are shown in Table 1-4.
Fig. 1Schematic of the experimental loop
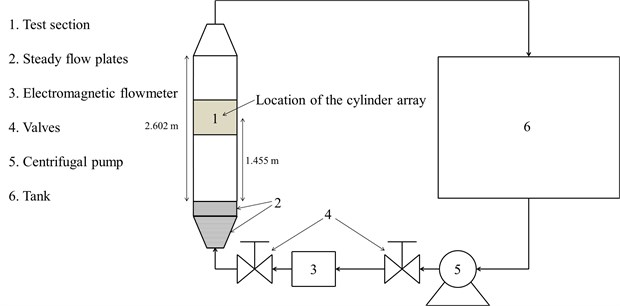
Table 1Parameters of the test section
Length | 2.602 m |
Size of the cross section | 0.140 m×0.140 m |
Table 2Parameters of the electromagnetic flowmeter
Measuring range | 0-200 m3/h |
Table 3Parameters of the centrifugal pump
Head | 20 m |
Measuring range | 0-65 m3/h |
Table 4Parameters of the tank
Capacity | 0.260 m3 |
Fig. 2Schematic of the cylinder array installed in the test section of the experimental apparatus
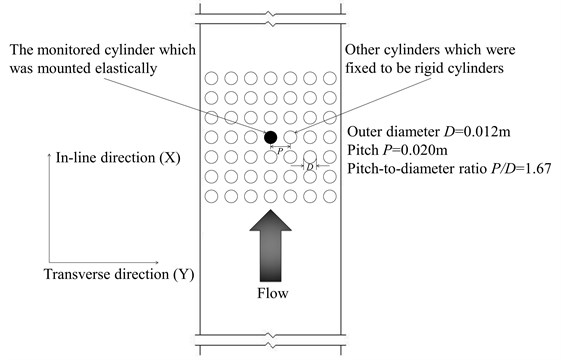
The test section is a 2.602 m long stainless steel rectangular water tunnel with a 0.140 m×0.140 m cross section containing a normal square cylinder array as shown in Fig. 2. The center of the cylinder array is at 1.455 m downstream of the top of the steady flow plates. The normal square cylinder array, which comprised an array of aluminum cylinders with an outer diameter of 0.012 m, an inner diameter of 0.010 m, and a height of 0.130 m, had a value of 1.67. The array contained seven rows each with seven cylinders to provide a uniform flow profile. The problem of instability behaviors of cylinder arrays is affected by numerous parameters; thus, modeling a fully flexible cylinder array is very complex and requires a large number of empirical coefficients [2,3]. Reducing the problem complexity and the amount of empirical coefficients required for a fundamental study is necessary to gain insights into the physics of the phenomenon. Weaver and Lever [18] and Lever and Weaver [19, 20] verified that an ordinary simplified method to solve this problem is to use a single elastically mounted cylinder in a rigid array. They showed that a single flexible cylinder placed in a rigid array of cylinders undergo fluid-elastic instability at essentially the same stability threshold as the same array with all the cylinders flexible. Studies by Price and Païdoussis [21], Marn and Catton [22], and Harran [23] have been conducted on this basis. With this background, the monitored cylinder was elastically mounted in the center of the cylinder array, whereas others were fixed at the channel walls of the test section with bolts at two ends to be rigid cylinders.
Fig. 3Half-side view of the installation schematic of the monitored cylinder
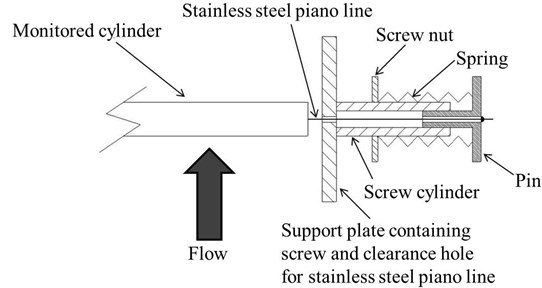
As shown in Fig. 3, the monitored cylinder was elastically mounted and was equipped with two stainless steel piano lines, two screw cylinders, two screw nuts, two springs, and two pins. One endpoint of each stainless steel piano line was fixed to the monitored cylinder, and the other endpoint was fixed to a pin. Screw nuts were used to adjust the springs and, consequently, the natural frequency of the vibration system. The displacement mechanism of the monitored cylinder was derived from Joo and Dhir [24], Mitra [25], and Cagney and Balabani [26]. The measured cylinder was freely moving simultaneously in both the in-line and transverse directions. Prior to the water tunnel tests, the natural frequency and damping ratio of the monitored cylinder were measured by using the logarithmic decrement technique. The data are summarized in Table 5.
According to Blevins [27], the mass per unit length of the cylinder and the mass ratio are calculated by using the equations below:
where is the added mass, is the added mass coefficient, is the mass of the displaced fluid, is the density of the fluid, is the outer diameter of the cylinder, and is the length of the cylinder. can be thought to be 1 in still water [28].
Table 5Monitored cylinder data without flow
Items | Data |
Natural frequency in air in the in-line direction, | 14.639 Hz |
Natural frequency in air in the transverse direction, | 14.639 Hz |
Damping ratio in air in the in-line direction, | 0.832 % |
Damping ratio in air in the transverse direction, | 0.847 % |
Natural frequency in still water in the in-line direction, | 10.547 Hz |
Natural frequency in still water in the transverse direction, | 10.547 Hz |
Damping ratio in water in the in-line direction, | 5.100 % |
Damping ratio in water in the transverse direction, | 5.130 % |
Structural mass (including acceleration transducers inside), | 0.02213 kg |
Mass per unit length of the cylinder, | 0.2831 Kg/m |
Mass ratio | 2.508 |
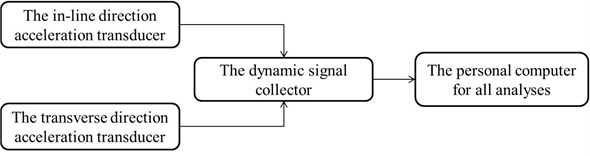
Acceleration transducers with a sensitivity of 1.71 pC/g and a frequency response of 1 Hz-20 kHz were chosen to obtain the displacement signals directly and simultaneously [16, 29-31]. The output signal was calibrated to have a linear relationship to the input signal. Two acceleration transducers installed inside the monitored cylinder at mid-span were treated as part of the monitored cylinder during the experiment. The orientations of the two acceleration transducers were adjusted such that they were sensitive to cylinder vibrations only in the in-line () and transverse () directions, respectively. The collection and analyses of signals are shown in Fig. 4. The output signals of the two acceleration transducers were collected by using a dynamic signal collector with a 24-bit analog-to-digital converter. The dynamic signal collector first transformed the output signals into voltage signals and then integrated the voltage signal twice to provide a displacement signal. All signals were high-pass filtered in post-processing at 1.2 Hz to prevent a “blow-up”, which commonly occurs because of low frequency noises during acceleration-to-displacement conversion. The cut-off frequency of 1.2 Hz is significantly lower than the response frequencies obtained from the entire experiment.
Fig. 4Collection and analyses of digital signals process
2.2. Experimental procedure
The freestream velocity in the test section is calculated by using the equation:
where is the freestream velocity in the test section with a unit of “m/s”, is the flow rate with a unit of “m3/h”, is the length of the cross section of the test section (equal to 0.140 m), and is the width of the cross section of the test section (equal to 0.140 m).
When the experiment began, the flow rate initially increased stepwise until the obvious fluid-elastic instability occurred. Thereafter, the flow rate decreased to zero stepwise in the same way. The maximum flow rate in this experiment was 22 m3/h, which made the maximum average water freestream velocity in the test section reached 0.3118 m/s through Eq. (5). The corresponding maximum Reynolds number was 0.3703×10⁴, based on the maximum inlet flow velocity and the outer diameter of the experimental cylinders. After reaching a steady state for each flow rate, the measurement was initiated. At each given flow velocity, the in-line and transverse displacement signals were simultaneously digitized at a sampling frequency of 200 Hz, and the recorded frequency spectra and response amplitudes were the results of 64 sample averages, which was found adequate to insure excellent repeatability. Meanwhile, the anti-aliasing filter was turned on throughout the experiment. All data were transmitted to a personal computer for data storage and further processing. The software MATLAB was used in data analyses.
3. Results and discussion
3.1. Response amplitude
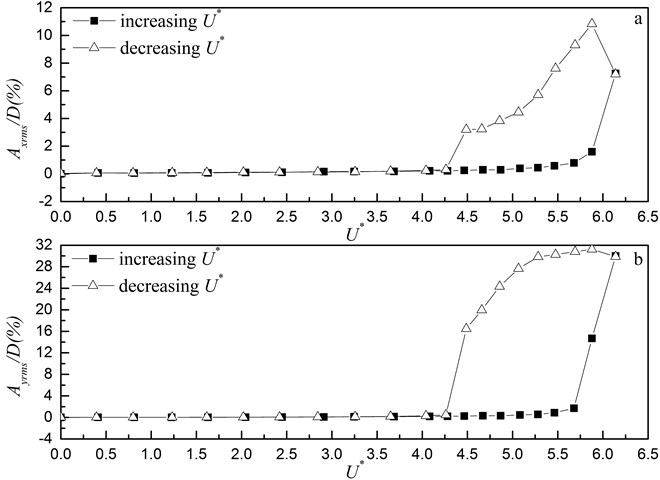
Fig. 5 shows the amplitude responses of the monitored cylinder in the in-line and transverse directions. The RMS cylinder amplitude expressed as a percentage of the cylinder diameter is plotted against the reduced pitch flow velocity obtained from the equations below:
where is the freestream velocity in front of the cylinder array in the test section, is the pitch of the cylinder array, is the outer diameter of the cylinder, is the pitch flow velocity, and is the natural frequency of the cylinder in still water
in the in-line or transverse direction. During the experiments, the Reynolds number was simply proportional to the reduced pitch flow velocity .
As shown in Fig. 5, whether the direction is in-line or transverse, all the amplitude curves have similar trends as increases. The vibration amplitudes are very small, slightly increasing with , as the value is below a critical value 5.680. These small-amplitude vibrations can be attributed to turbulent buffeting. After exceeds the critical value, the vibration amplitudes rapidly increase as the flow velocity continuously increases, with the amplitude obtained from the transverse vibration being larger than that obtained from the in-line vibration. This result indicates the occurrence of fluid-elastic instability. The flow velocity begins to decrease after reaching the maximum. As a result, the amplitudes obtained from the two directions also decrease with the flow, except for the range of 6.141 to 5.879. However, the vibration amplitude curves under decreasing gravely deviate from those under increasing in both the in-line and transverse directions. This result indicates that nonlinear hysteresis occurred and that the fluid-elastic instability is also a nonlinear phenomenon. When decreases from 4.487 to 4.262, the amplitudes suddenly considerably drop to nearly zero, indicating the end of fluid-elastic instability. After the critical 4.262 is reached under decreasing flow velocity, the amplitudes slightly decrease with the flow velocity, indicating the occurence of turbulent buffeting again.
The serious vibration in the fluid-elastic instability phenomenon could be explained as follows. The flow can export energy to the cylinder. When the flow velocity is beyond the critical flow velocity, the fluid has sufficient energy to overcome the damping of the cylinder, making it vibrate with certain amplitude at its natural frequency. Fluid-elastic instability occurs at this time. When fluid-elastic instability occurs in cylinder-like structures, the flow velocity should be decreased lower than the critical flow velocity corresponding to the case of increasing flow velocity to exclude the instability because nonlinear hysteretic effects can generate a lower stability threshold on decreasing the flow velocity from the unstable region.
Fig. 5R.M.S. response amplitude for the aluminum cylinder: a) in-line direction; b) transverse direction
3.2. Spectrum of cylinder vibration
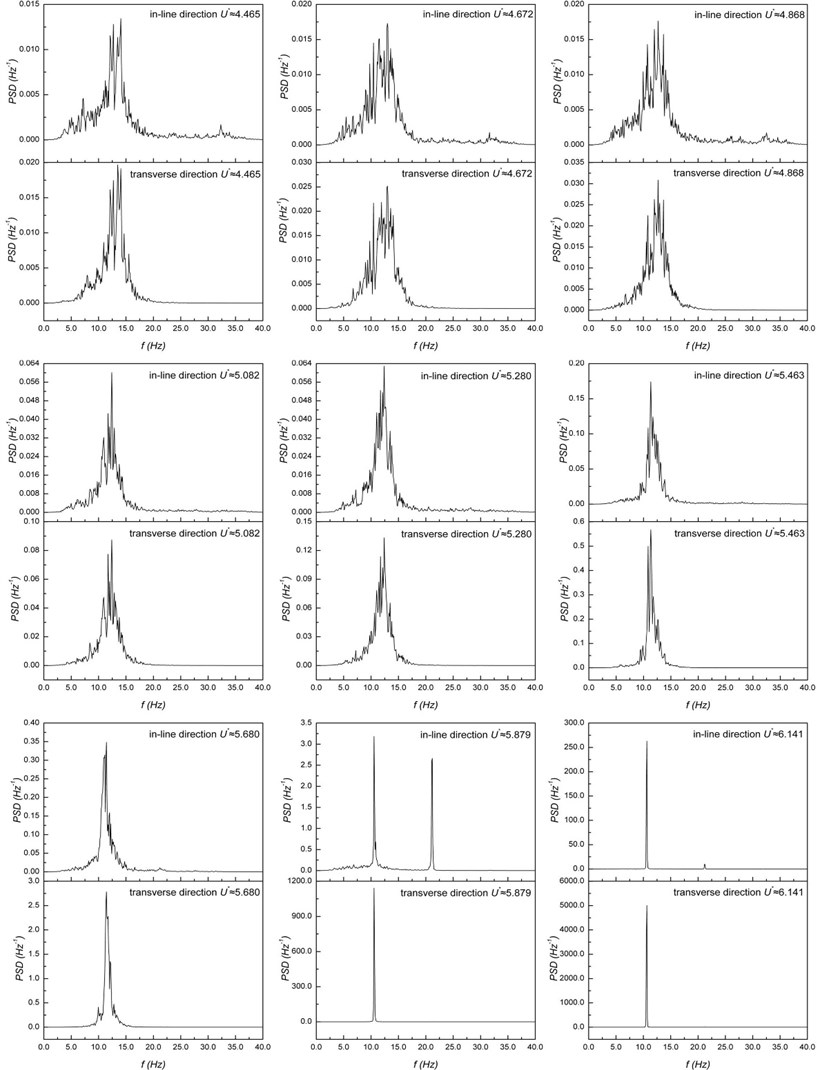
We calculated a series of power spectral density functions of the vibration signals in the ranges, wherein the response amplitude curves under increasing gravely deviate from those under decreasing (Fig. 5), to analyze further the difference between the instability behaviors under increasing and decreasing . Fig. 6 shows the power spectral density functions under increasing , which are obtained from both the in-line and transverse vibrations. Meanwhile, Fig. 7 shows the power spectral density functions under decreasing , which are obtained from both the in-line and transverse vibrations.
When 5.680 which is the critical value, the spectra of the monitored cylinder are broadband (Fig. 6). The broadband power spectral density functions reflect the random nature of the cylinder vibrations resulting from turbulent buffeting. Above the critical velocity, the spectra of the monitored cylinder suddenly become sharp, exhibiting the occurrence of fluid-elastic instability. When 5.879, two prominent sharp peaks can be observed in the power spectral density function obtained from the in-line vibration. According to Franzini, et al. [32] and Cetiner and Rockwell [33], the first prominent sharp peak is the dominant peak, and the second prominent sharp peak is the subharmonic peak. Moreover, the frequency corresponding to the subharmonic peak is nearly twice as high as that corresponding to the dominant peak. After the flow velocities further increase, the signal strength of the two peaks rapidly enhances; however, the dominant peak enhances much more evidently. When 5.879, only one single sharp peak (i.e., the dominant peak) exists in the power spectral density function obtained from the transverse vibration. After the occurrence of the fluid-elastic instability, the frequencies corresponding to the dominant peaks in the power spectral density functions obtained from the in-line vibration at 5.879 and from the transverse vibration at 5.879 are all consistent with the natural frequency of the cylinder in still water. This result indicates that the monitored cylinder is also vibrating in the resonance state and absorbing energy at its natural frequency and at the frequencies which are multiples of its natural frequency.
Fig. 6Power spectral density functions of cylinder vibrations under increasing flow velocity
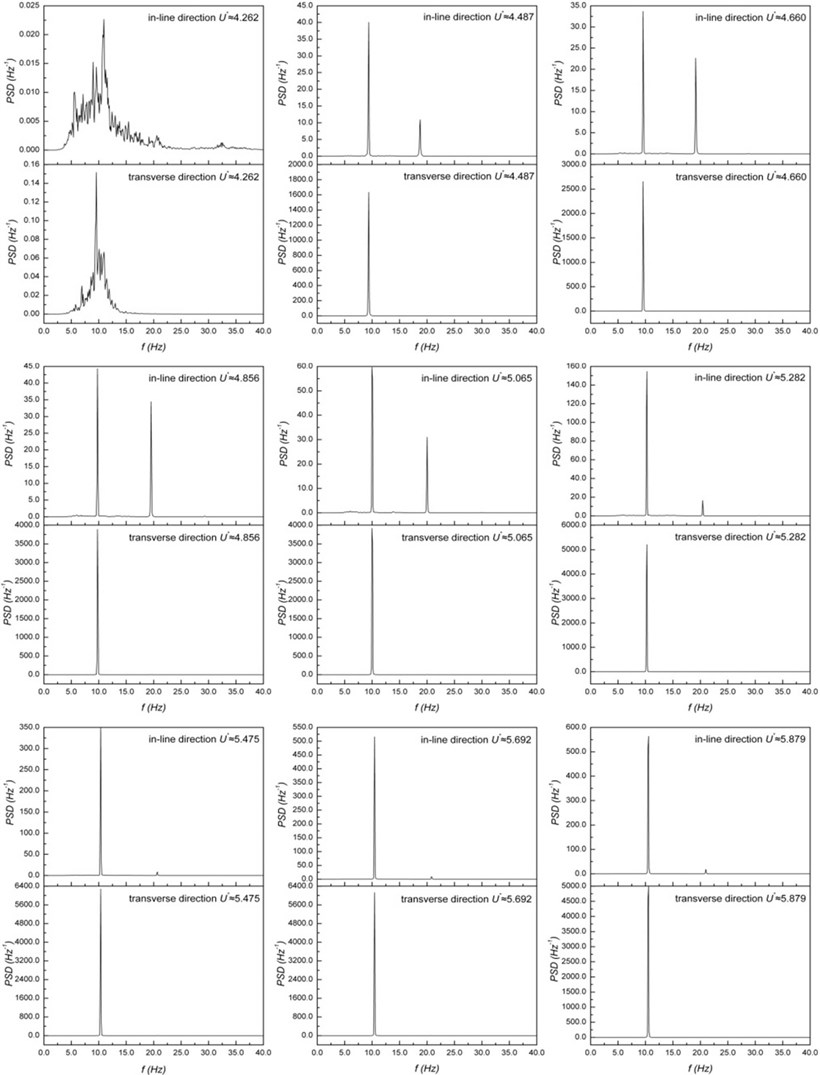
As shown in Fig. 7, fluid-elastic instability does not immediately disappear under decreasing flow velocity. The frequencies corresponding to the sharp peaks fluctuate within a very narrow range, which indicates that the resonance state found in the fluid-elastic instability phenomenon can sustain in a certain flow velocity range under decreasing flow velocity. The frequencies corresponding to the dominant sharp peaks obtained in both the in-line and transverse vibrations are the natural frequencies of the monitored cylinder in flow. This finding can further explain why the amplitude curves under decreasing flow velocity gravely deviate from those under increasing flow velocity in both the in-line and transverse directions in Fig. 5. It can also be viewed as the reason for the occurrence of hysteresis under decreasing flow velocity.
Fig. 7Power spectral density functions of cylinder vibrations under decreasing flow velocity
3.3. Response frequency
The dominant in-line and transverse frequencies in the range wherein the response amplitude curves under increasing gravely deviate from those under decreasing in Fig. 5 are shown in Fig. 8 in the form of their ratio to the natural frequency in still water. The trends of the response frequency curves are similar in both the in-line and transverse vibrations.
Fig. 8Response frequency: a) in-line direction; b) transverse direction
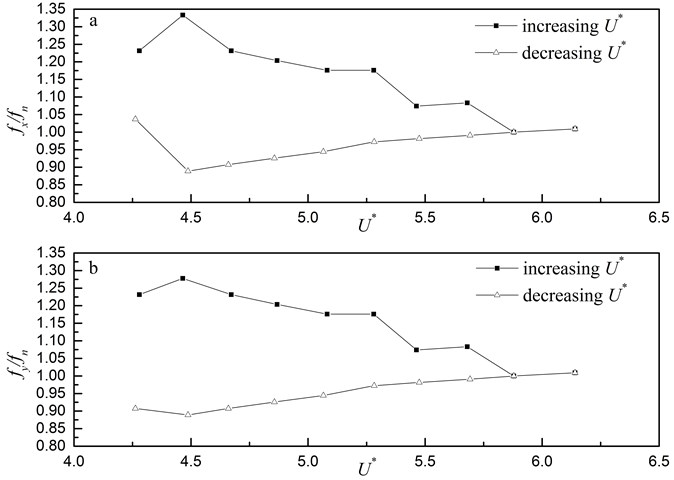
Under increasing flow velocity, the response frequencies first approach the natural frequency of the cylinder in still water continuously. When increases to 5.879, the response frequencies of the cylinder in the in-line and transverse vibrations are all 10.547 Hz, indicating that the cylinder vibrates at its natural frequency. The vibration frequency is not the vortex shedding frequency that is linearly related to flow velocity. The Strouhal number of the vortex shedding of the cylinder array applied in this experiment is estimated to be 0.26 according to the figure plotted by Fitz-Hugh [34]. The Strouhal number is defined below:
where is the vortex shedding frequency, is the outer diameter of the monitored cylinder, and is the pitch flow velocity in the cylinder array.
The vortex shedding frequency at this reduced pitch flow velocity 5.879 is about 16.121 Hz. This calculated vortex shedding frequency is not equal to 10.547 Hz, which is the dominant frequency obtained from both the in-line and transverse vibrations at the same flow velocity. It is even not equal to the frequency 21.191 Hz corresponding to the subharmonic peak of the power spectral density function obtained from the in-line vibration at 5.879 under increasing . Owing to the mismatch of these frequencies, vortex shedding is not likely responsible for the instability behaviors of the monitored cylinder in this cylinder array. The large-amplitude vibration of the monitored cylinder is due to fluid-elastic instability because the vibration amplitudes rapidly increase when the critical crossflow velocity is exceeded, as shown in Fig. 5.
Similar to Fig. 5, the response frequency curves under decreasing also seriously deviate from those under increasing in both the in-line and transverse directions. Under decreasing flow velocity, the response frequencies obtained from both the in-line and transverse vibrations first slightly decrease with the flow. The response frequencies can be treated as the natural frequencies of the monitored cylinder in flow because the cylinder is in the resonance state [35, 36]. When decreases to 4.262, the response frequencies all increase in a certain degree. At 4.262, the response amplitudes obtained from both the in-line and transverse vibrations considerably drop, the spectra of the cylinder obtained from the vibrations in the two directions all change into broadband, and the signal strength of dominant frequencies reduce in a large degree, indicating that the monitored cylinder has been in the state of turbulent buffeting (Figs. 5 and 7). When 4.487, the calculated vortex shedding frequency 12.305 Hz is not equal to 9.375 Hz, which is the dominant frequency obtained from both the in-line and transverse vibrations at the same flow velocity. It is even not equal to the frequency 18.750 Hz corresponding to the subharmonic peak of the power spectral density function obtained from the in-line vibration at 4.487 under decreasing . This result indicates that vortex shedding did not occur in the case of decreasing either. The trend of the response frequency curves under decreasing reflects that the natural frequency of the monitored cylinder in the state of fluid-elastic instability can change as the flow velocity changes.
3.4. Added mass coefficient
The natural frequencies of structures vibrating in flow are affected by the inertia of the fluid accelerated by the structures. The inertia of the fluid accelerated by the structures is treated as added mass , which can be generally determined by the Eq. (1) in Section 2.1.
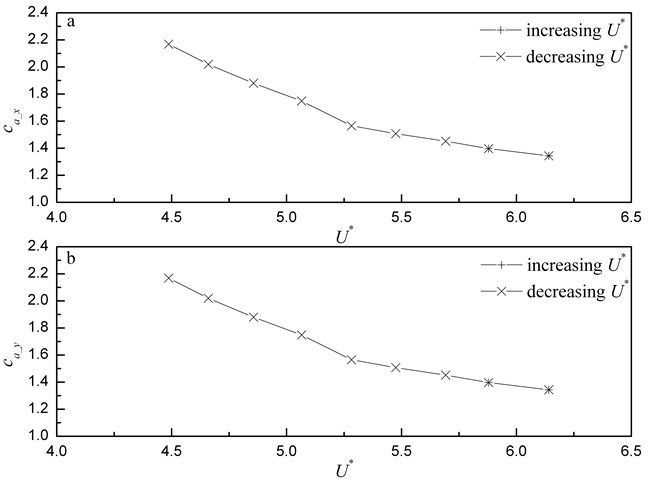
Fig. 9Added mass coefficients versus flow velocity: a) in-line direction; b) transverse direction.
For right circular cylinders in still fluid, the added mass coefficient can be thought to be 1 [28]. However, when the cylinder is vibrating in a confined space, the effective added mass is increased; as a result, the actual added mass coefficient becomes larger than 1. The added mass coefficient in flow can be calculated as follows [36]:
where is the natural frequency of a cylinder in vacuum (usually taken in air), is the natural frequency of a cylinder in flow, and and are the cylinder and fluid specific gravities, respectively.
The monitored cylinder was in the state of fluid-elastic instability in the ranges which are from 5.879 to 6.141 under increasing and from 6.141 to 4.487 under decreasing . The added mass coefficients in the in-line and transverse vibrations and corresponding to the two ranges above are plotted versus in Fig. 9. The curves corresponding to the in-line vibration are same as those corresponding to the transverse vibration because of the same dominant frequencies of the in-line and transverse vibrations obtained from the ranges in which the monitored cylinder was in the state of fluid-elastic instability. All added mass coefficients are larger than 1 because of the huge vibration of the monitored cylinder. As shown in Eq. (9), from another perspective, the natural frequency of the monitored cylinder in flow can be influenced by added mass. This finding can explain why the dominant frequencies of the monitored cylinder in the state of fluid-elastic instability decrease as the flow velocity decreases in Fig. 8. When the monitored cylinder is in the state of fluid-elastic instability, the added mass increases as the flow velocity decreases. According to Eq. (9), the natural frequencies of the monitored cylinder in flow decrease as the added mass coefficients increase.
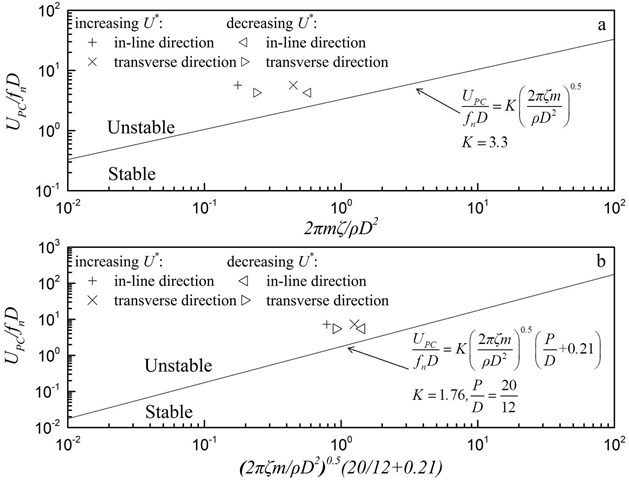
Fig. 10Criterion plots for fluid-elastic instability: a) Connors’ criterion and b) Païdoussis’ criterion
3.5. Fluid-elastic instability analysis
Two criteria [6, 7] for fluid-elastic instability have been applied in this experiment. As shown in Fig. 10, the data obtained from both the in-line and transverse vibrations at the two critical pitch flow velocities under increasing and decreasing all lay in the unstable regions determined by the two criteria. This result indicates that the large-amplitude vibration was a result of the fluid-elastic instability again. Table 6 presents a summary of the fluid-elastic instability results for the data corresponding to the critical pitch flow velocities. Corresponding dimensionless parameters are also given. The calculated values, which are consistent with this experiment, have been obtained by solving the two criterion equations with our data at the point 0.7189 m/s under increasing flow velocity and at the point 0.5394 m/s under decreasing flow velocity. The calculated values are all larger than the literature values shown in Fig. 10, considering that only one cylinder was elastically mounted in the rigid cylinder array.
Table 6Summary of fluid-elastic instability results
Items | Cases | |||
Increasing | Decreasing | |||
In-line direction | Transverse direction | In-line direction | Transverse direction | |
(m/s) | 0.7189 | 0.7189 | 0.5394 | 0.5394 |
5.680 | 5.680 | 4.262 | 4.262 | |
0.1756 | 0.4469 | 0.5734 | 0.2395 | |
calculated for Connors’ criterion | 13.55 | 8.497 | 5.628 | 8.709 |
calculated for Païdoussis’ criterion | 7.223 | 4.528 | 2.999 | 4.641 |
4. Conclusions
Fluid-elastic instability was studied through an elastically mounted cylinder in a rigid normal square cylinder array with a value of 1.67 under both increasing and decreasing freestream velocities. The following conclusions could be drawn from the present work:
1) Fluid-elastic instability occurred in both the in-line and transverse vibrations.
2) Under decreasing flow velocity, fluid-elastic instability was accompanied by nonlinear hysteresis. The vibration response characteristic under increasing freestream velocity differed from that under decreasing freestream velocity.
3) When the monitored cylinder was in the state of fluid-elastic instability, an obvious subharmonic peak was found in the power spectral density functions obtained from in-line vibrations.
4) The cylinder is in the state of resonance upon the occurrence of fluid-elastic instability. Under decreasing flow velocity, the cylinder in the state of fluid-elastic instability can remain in this state for a certain range of flow velocities.
5) Added mass coefficients corresponding to the state of fluid-elastic instability were all larger than 1.
6) The criteria of Connors and Païdoussis for fluid-elastic instability were applied. The data corresponding to the two critical flow velocities in cases of increasing and decreasing flow velocities all lay in the unstable region determined by the two criteria. The fluid-elastic instability constants, which are consistent with this experiment, were obtained by solving the two criterion equations with our data. These constants were all larger than the literature values because only one cylinder was mounted elastically in this rigid cylinder array.
References
-
Kumar K. K. S., Kumaraswamidhas L. A. Experimental investigation on flow induced vibration excitation in the elastically mounted square cylinders. Journal of Vibroengineering, Vol. 17, Issue 1, 2015, p. 468-477.
-
Chen S. S. Instability mechanisms and stability criteria of a group of circular cylinders subjected to cross flow. Part 1: Theory. Journal of Vibration, Acoustics, Stress and Reliability in Design, Vol. 105, Issue 1, 1983, p. 51-58.
-
Chen S. S. Instability mechanisms and stability criteria of a group of circular cylinders subjected to cross flow. Part 2: Numerical results and discussion. Journal of Vibration, Acoustics, Stress and Reliability in Design, Vol. 105, Issue 2, 1983, p. 253-260.
-
Paidoussis M. P., Price S. J. The mechanisms underlying flow-induced instabilities of cylinder arrays in crossflow. Journal of Fluid Mechanics, Vol. 187, 1988, p. 45-59.
-
Connors H. J. An Experimental Investigation of the Flow-Induced Vibration of Tube Arrays in Cross Flow. University of Pittsburgh, 1969.
-
Pettigrew M. J., Gorman D. J. Vibration of heat exchanger components in liquid and two-phase cross flow. Proceedings of the B.N.E.S. Conference on Vibration in Nuclear Plant, Keswick, U.K., 1978.
-
Païdoussis M. P. Fluidelastic vibration of cylinder arrays in axial and cross flow: state of the art. Journal of Sound and Vibration, Vol. 76, Issue 3, 1981, p. 329-360.
-
Weaver D. S., Fitzpatrick J. A. A review of flow-induced vibration in heat-exchangers. Proceedings of Internation Conference on Flow-induced Vibration, Bowness-on-Windermere, UK, 1987.
-
Khalifa A., Weaver D., Ziada S. Modeling of the phase lag causing fluidelastic instability in a parallel triangular tube array. Journal of Fluids and Structures, Vol. 43, 2013, p. 371-384.
-
Yan K., Ge P.-Q., Hong J. Experimental study of shell side flow-induced vibration of conical spiral tube bundle. Journal of Hydrodynamics, Ser. B, Vol. 25, Issue 5, 2013, p. 695-701.
-
Shinde V., Marcel T., Hoarau Y., Deloze T., Harran G., Baj F., Cardolaccia J., Magnaud J. P., Longatte E., Braza M. Numerical simulation of the fluid-structure interaction in a tube array under cross flow at moderate and high Reynolds number. Journal of Fluids and Structures, Vol. 47, 2014, p. 99-113.
-
Sawadogo T., Mureithi N. Fluidelastic instability study in a rotated triangular tube array subject to two-phase cross-flow. Part I: Fluid force measurements and time delay extraction. Journal of Fluids and Structures, Vol. 49, 2014, p. 1-15.
-
Sawadogo T., Mureithi N. Fluidelastic instability study on a rotated triangular tube array subject to two-phase cross-flow. Part II: Experimental tests and comparison with theoretical results. Journal of Fluids and Structures, Vol. 49, 2014, p. 16-28.
-
Chen S. S. Guidelines for the instability flow velocity of tube arrays in cross-flow. Journal of Sound and Vibration, Vol. 93, Issue 3, 1984, p. 439-455.
-
Rottmann M., Popp K. Influence of upstream turbulence on the fluid elastic instability of a parallel triangular tube bundle. Journal of Fluids and Structures, Vol. 18, Issue 5, 2003, p. 595-612.
-
Lin T.-K., Yu M.-H. An experimental study on the cross-flow vibration of a flexible cylinder in cylinder arrays. Experimental Thermal and Fluid Science, Vol. 29, Issue 4, 2005, p. 523-536.
-
Mitra D., Dhir V. K., Catton I. Fluid-elastic instability in tube arrays subjected to air-water and steam-water cross-flow. Journal of Fluids and Structures, Vol. 25, Issue 7, 2009, p. 1213-1235.
-
Weaver D. S., Lever J. H. Tube frequency effect on cross flow induced vibrations in tube array. Proceedings of the 5th Biennial Symposium on Turbulence, Missouri, USA, Vol. 1, 1977.
-
Lever J. H., Weaver D. S. On the stability of heat-exchanger tube bundles, part II: Numerical results and comparison with experiments. Journal of Sound and Vibration, Vol. 107, Issue 3, 1986, p. 393-410.
-
Lever J. H., Weaver D. S. On the stability of heat exchanger tube bundles, part I: Modified theoretical model. Journal of Sound and Vibration, Vol. 107, Issue 3, 1986, p. 375-392.
-
Price S. J., Païdoussis M. P. The flow-induced response of a single flexible cylinder in an in-line array of rigid cylinders. Journal of Fluids and Structures, Vol. 3, Issue 1, 1989, p. 61-82.
-
Marn J., Catton I. On stability analysis of a flexible cylinder in an array of rigid cylinders. Transactions of the ASME. Journal of Fluids Engineering, Vol. 114, Issue 1, 1992, p. 12-19.
-
Harran G. Influence of the mass ratio on the fluid elastic instability of a flexible cylinder in a bundle of rigid tubes. Journal of Fluids and Structures, Vol. 47, 2014, p. 71-85.
-
Joo Y., Dhir V. K. An experimental study of drag on a single tube and on a tube in an array under two-phase cross flow. International Journal of Multiphase Flow, Vol. 20, Issue 6, 1994, p. 1009-1019.
-
Mitra D. R. Fluid-Elastic Instability in Tube Arrays Subjected to Air-Water and Steam-Water Cross-Flow. University of California, Los Angeles, 2005.
-
Cagney N., Balabani S. Wake modes of a cylinder undergoing free streamwise vortex-induced vibrations. Journal of Fluids and Structures, Vol. 38, 2013, p. 127-145.
-
Blevins R. D. Flow-Induced Vibration. 1st Edition, Van Nostrand Reinhold, New York, 1977.
-
Khalak A., Williamson C. H. K. Motions, forces and mode transitions in vortex-induced vibrations at low mass-damping. Journal of Fluids and Structures, Vol. 13, Issues 7-8, 1999, p. 813-851.
-
Hara F. Vibration of a single row of circle cylinders subjected to two-phase bubble cross-flow. International Conference on Flow Induced Vibrations, Bowness-on-Windermere, England, 1987.
-
Marcollo H., Hinwood J. B. On shear flow single mode lock-in with both cross-flow and in-line lock-in mechanisms. Journal of Fluids and Structures, Vol. 22, Issue 2, 2006, p. 197-211.
-
Huang S., Khorasanchi M., Herfjord K. Drag amplification of long flexible riser models undergoing multi-mode VIV in uniform currents. Journal of Fluids and Structures, Vol. 27, Issue 3, 2011, p. 342-353.
-
Franzini G. R., Goncalves R. T., Meneghini J. R., Fujarra A. L. C. One and two degrees-of-freedom vortex-induced vibration experiments with yawed cylinders. Journal of Fluids and Structures, Vol. 42, 2013, p. 401-420.
-
Cetiner O., Rockwell D. Streamwise oscillations of a cylinder in a steady current. Part 1. Locked-on states of vortex formation and loading. Journal of Fluid Mechanics, Vol. 427, 2001, p. 1-28.
-
Fitz-Hugh J. S. Flow Induced Vibration in Heat Exchangers. Atomic Energy Research Establishment, 1973.
-
Mureithi N. W., Zhang C., Ruël M., Pettigrew M. J. Fluidelastic instability tests on an array of tubes preferentially flexible in the flow direction. Journal of Fluids and Structures, Vol. 21, Issue 1, 2005, p. 75-87.
-
Weaver D. S., Yeung H. C. The effect of tube mass on the flow induced response of various tube arrays in water. Journal of Sound and Vibration, Vol. 93, Issue 3, 1984, p. 409-425.
About this article

This research was supported financially by International S&T Cooperation Program of China, ISTCP (No. 2015DFR40910).
