Abstract
With the improvement of the speed, aerodynamic noises of trains also become more obvious. Reducing the aerodynamic noise has become a key factor to control noises of the high speed train. This paper uses large eddy simulation and boundary element method to compute the flow field and aerodynamic noises of pantographs and trains. The result presents that there are obvious eddies at the head, push rod, and base. Two obvious separation eddies can be found around the guide rod of the head and the push rod of pantographs. The front part of the base has a layer of shear flow, which leads to a separation eddy in the back of the base while the flow moves backward. Noises of pantographs mainly concentrate around the head, base and pushrod. With the increase of the analyzed frequency, the strength of pantograph noise source is weaker and weaker. When the analyzed frequency is 500 Hz, the noise source of pantographs is mainly around joints of several structures. By comparing the computational and the experimental result of aerodynamic noises of pantographs, this result presents that they are consistent with each other in the change tendency and value within the whole analyzed frequency. This indicates that the computational model of aerodynamic noises of pantographs is effective. Pantographs have an obvious influence on the distribution of the flow field around high speed trains, especially at the end of high speed trains. High speed trains with pantographs only have an eddy at the end, but high speed trains without pantographs have two eddies at the end. When this paper conducts on numerical computation for high speed trains, pantographs should not be ignored. In the low frequency, radiation noises of high speed trains can be found mainly around pantographs and at the end of trains. At the longitudinal symmetric plane of high speed trains, the sound pressure level at the end of trains is the highest. The radiation noise around pantographs mainly concentrates around the pushrod, then base, and the last is the head.
1. Introduction
With the development of high-speed trains and running speed, the fluctuation of air pressures acting on the surface of trains increases and aerodynamic noises become very obvious. Reference [1] points out that the dynamic environment of the high speed train has a qualitative change from machinery and electrical to aerodynamic, and the greatest change and limit is nothing more than noises. Reference [2] points out when the running speed of trains reaches 300 km/h, the aerodynamic noise will be more than the noise of wheel-rail and become the main noise source of high-speed trains. Therefore, the development of high-speed trains must study and control aerodynamic noises.
Aerodynamic noises of high-speed trains belong to inter-discipline between hydromechanics and acoustics. Currently, the researched method of aerodynamic noises of high-speed trains is mainly theoretical research, experimental investigation and numerical computation. In theoretical researches, the famous is Lighthill acoustics analogy theory [3-6], which has been applied to predicting aerodynamic noises of high-speed trains [7]. In experimental investigation, people have made a lot of experiments in order to learn about the aerodynamic noise, production mechanism and propagation of high-speed trains [8-12], which points out that pulsating pressures are the aerodynamic noise source and proposes some measures to reduce aerodynamic noises. In the numerical computation, T. Sassa adopts large eddy simulation and boundary element method to study the radiation noise of two-dimensional door of high-speed trains and analyzes noises [13]. Takehisa adopts large eddy simulation and green function method to study the distribution of dipole noise source on the surface of high-speed trains. The researched result has an important significance on recognizing the distribution of aerodynamic noises of high-speed trains [14, 15]. Reference [16] adopts multi-channel data collection system to make noise experiments of high speed trains and studies noise level outside high-speed trains, main noise source and distribution characteristics at the speed of 350 km/h, which has an important significance on studying and controlling aerodynamic noises of high-speed trains. Reference [17] adopts large eddy simulation and Lighthill acoustic analogy method to conduct the numerical computation of aerodynamic noises for the head of high-speed trains at the speed of 200 km/h and 300 km/h, and the computed frequency is 1000 Hz. However, aerodynamic noises of high-speed trains are broadband noises, so the frequency over 1000 Hz also need be studied. The mentioned researches of aerodynamic noises of high-speed trains mainly focus on head, tail and the surface of the middle train, while a few researches focus on pantographs with a complex structure.
The paper combines standard - turbulence model and boundary element method to conduct the numerical computation of aerodynamic noises on the surface of high-speed trains with pantographs, compares and analyzes spectral characteristics.
2. Computational method of aerodynamic noises of high-speed trains
The computation of aerodynamic noises of high-speed trains includes two stages: the first stage is computing flow field. Firstly, it adopts standard turbulence model to compute steady flow field, takes steady flow filed as the initial boundary condition, and adopts LES method to compute the transient flow field to obtain pulsating pressures on the surface of trains. The second stage is computing acoustics. Based on the steady flow field, it adopts boundary element method to compute the aerodynamic noise of high-speed trains.
2.1. Mathematical model of flow field of high-speed trains
For a high-speed train, the external flow filed can adopt the incompressible viscosity flow field, and the basic governing equation is as follows:
In the equation, and express air velocity component of flow field around the train. and express coordinate component, , 1, 2, 3, is air density of flow field around the train, expresses aerodynamic viscosity, and is time.
Steady flow field adopts standard - turbulence model and the governing equation is as below [19]:
In the equation, is turbulence kinetic energy, is turbulence dissipation rate, is turbulence viscosity coefficient, , is turbulence constant and usually 0.09. , , and are empirical constant, as shown in reference [19]. In this paper, 1.47, 1.92, 1.0 and 1.33.
Transient flow filed adopts LES technology, LES governing equation is still N-S equation of incompressible fluid. Large scale velocity in LES is the filtering velocity and the definition is as the following equation:
In the equation, is filtering velocity component, and is filtering function, which is used to standardize big vortex and filter the small vortex. and are spatial position. is the size of filtration meshes. Assuming filtration process and derivation process are interchangeable, and the function is used to solve N-S equation of incompressible viscosity fluid to obtain the following relation:
In order to close equations, according to the basic SGS model of Smagorinsky, SGS Reynolds stress can be expressed as the following form:
In the equation, is tensor, is sub-grid turbulence viscosity coefficient, is the component of strain tensor in the scale of solution:
2.2. Acoustics boundary element
Making fluctuation pressures as boundary conditions of aerodynamic loads, and then the sound filed distribution can be computed. The paper adopts the direct boundary element method and the pressure of sound field should meet Helmholtz equations:
In the equation, is pressures of sound filed, is volume velocity, is wave number, and is angular frequencies.
The relation between the sound pressure at any point in the external radiation sound field, sound pressures on the surface of sound source and sound pressure gradient is as follows:
In the equation, and represent sound pressures at and , is normal vector on the surface and is green function.
3. Numerical computation and verification of aerodynamic noises of pantographs
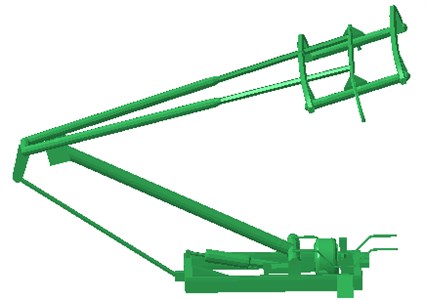
As can be seen from Fig. 1, the pantograph includes head, push rod and base. The model is symmetrical. The opening angle of pantographs can be changed through the push rod. Pantographs are installed on the top of high-speed trains to transmit power for high-speed trains. During operation, pantographs are open and generate strong aerodynamic noises, so it is necessary to study aerodynamic noises.
Fig. 1Geometric model of pantographs of high-speed trains
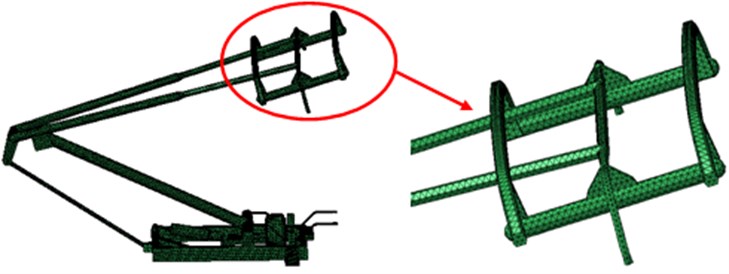
When the flow field is determined, the computational domain is infinite theoretically. However, in the actual computation, it can only select a finite domain for computation, because the bigger the determined flow filed domain is, the flow field meshes are more and the computational time becomes longer, which cannot reflect the advantage of the numerical computation. According to the experience of the numerical computation, when the computational domain of the external flow field increases to a certain degree, it doesn’t need to increase anymore, because the impact of the computational domain on the result of the numerical computation is very small. Generally speaking, when the external flow field of pantographs of high-speed trains is computed, the computational domain can be set as a cuboid, the length from entrance to exit is 8 times of pantographs. The distance from lateral side of the computational domain to pantographs is 1.5 times of pantographs. The distance from the upper computational domain to the head of pantographs is 2.5 times of pantographs. As shown in Fig. 2, it is aerodynamic mesh model of pantographs. There are 3584 elements and 3972 nodes totally in the model.
Fig. 2Aerodynamic mesh model of pantographs
The boundary conditions are different for different problems. The flow field of pantographs is simulated by the finite element method, so inflow and outflow boundaries are in the flow domain and it needs proper boundary condition to describe the characteristics of fluids. Static solid wall and obstacle wall in the computational domain also need proper boundary condition.
When aerodynamic characteristics of pantographs are computed, considering the action of wind to pantographs, air inlet is set in the front far away from pantographs and the speed is the same as that of running but reverse in direction. The outlet boundary is located in the direction of the head of pantographs. The outlet boundary is set to be a standard atmospheric pressure. Both sides and top of pantographs are set to be symmetrical boundary condition. For viscose flow problem, the fluid speed at the wall is required to be the same as that in the wall. Ground and pantograph are set to be non-slipping solid wall.
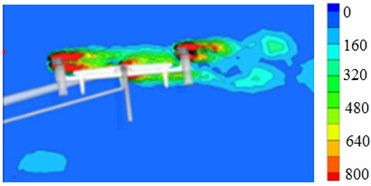
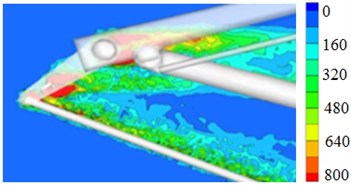
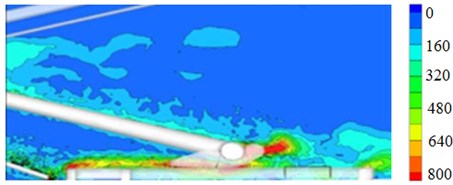
According to the computational model, aerodynamic characteristics of pantographs can be obtained, as shown in Fig. 3. According to Fig. 3, it can be seen that obvious vortex is at the position of head, pushrod and base, and it is mainly because the structure at these positions is complex. At the head of pantographs, the obvious vortex is on both ends of guide rod. When fluid touches the first guide rod, two obvious separation vortexes generate nearby guide rod and the vortexes continue moving, touch the second guide rod and then continue spreading. Two obvious separation vortexes also generate nearby pushrod. A layer of obvious shear flow is in front of base. When fluid continues spreading, one separated vortex will generate at the rear of base.
Fig. 3Vortex distribution of pantographs
a) Pantograph head
b) Pushrod
c) Base
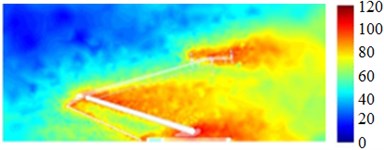
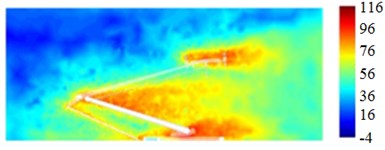
The fluid flow will certainly cause structural vibrations, while vibrations are the source of noises. Therefore, based on the aerodynamic characteristic, the paper continues to study the aerodynamic noise of pantographs. Save the result of aerodynamic characteristics as CGNS format and import it to Virtual.Lab and then compute aerodynamic noises. Then, the exterior surface of pantographs is extracted to establish an acoustic boundary element model, as shown in Fig. 4. When the acoustic boundary element model is established, there are at least six elements in a wave, and the mesh size of the acoustic boundary element should be uniform. The result of aerodynamic characteristics is mapped to the boundary element mesh. Therefore, boundary element meshes can obtain all the results of aerodynamic characteristics and realize the coupling between noises and structures. The computational frequency is 2000 Hz. Finally, solver in the software is used to obtain aerodynamic noises of pantographs, as shown in Fig. 5.
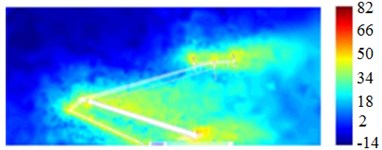
As shown in Fig. 5, it can be seen that the noise source of pantographs is mainly distributed nearby head, base and pushrod, which is related to aerodynamic characteristics of pantographs in Fig. 3. With the increase of the analyzed frequency, the noise source strength of pantographs decreases gradually. When the analyzed frequency is 500 Hz, the noise source of pantographs is mainly at the junction of several structures.
Fig. 4Acoustics boudary element model of pantographs
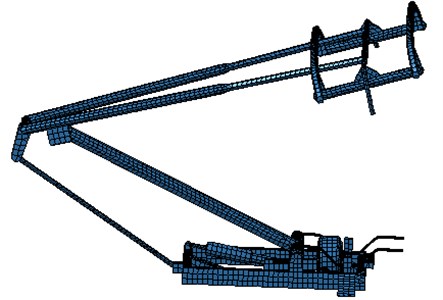
Fig. 5Sound source distribution of pantographs
a) 40 Hz
b) 140 Hz
c) 500 Hz
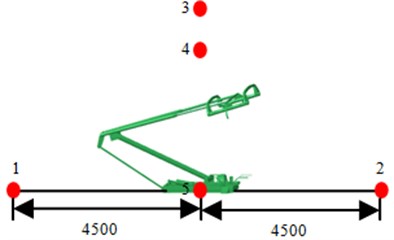
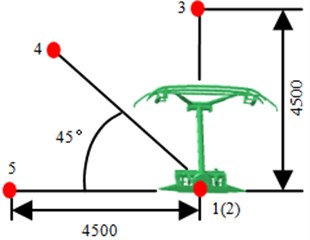
In order to analyze the aerodynamic noise of pantographs qualitatively, several observation points are set nearby pantographs, as shown in Fig. 6. Point 1 and Point 2 are on the symmetrical plane, 4500 mm away from the center of base. Point 3 is on the right above pantographs, 4500 mm away from the center of base. Point 4 is 4500 mm away from the center of base and formed 45° with the horizontal plane. Point 5 is on the lateral side of pantographs, 4500 mm away from the center of base. The sound pressure level of five observation points is extracted and compared, and the result is shown in Fig. 7. According to Fig. 7, it can be seen there is no obvious change regulation for sound pressure levels on several observation points, but obvious peak and valley are in sound pressure level curves of each observation point. The maximum sound pressure level is 78.2 dB and the corresponding frequency is 100 Hz. The minimum sound pressure level is 26.3 dB and the corresponding frequency is 966 Hz. Therefore, it can be seen the difference between maximum and minimum is great, so it will cause serious roar nearby pantographs.
The computational model of aerodynamic noises of pantographs is very complex, so the computational result is necessary to be verified by the experiment. As shown in Fig. 8, the pantograph is installed on the wind tunnel, and five microphones are arranged on the observation points in Fig. 6 to obtain sound pressure signals of pantographs. Then, sound pressure signals are imported into Pulse software for processing and obtain the sound pressure level of pantographs in the frequency domain. Take observation point 1 as an example, and experimental results are compared with the computational result, as shown in Fig. 9. It can be seen from Fig. 9 that the change trend and size between experiment and simulation in the analyzed frequency domain are basically consistent and the big difference only appears in several frequency points. The maximum difference is 8 dB at 1100 Hz, it’s because boundary condition is difficult to define accurately during simulation, which causes failure to ensure good consistence between simulation and experimental result.
Fig. 6Observation points of pantographs
a) Lateral view
b) Front view
Fig. 7Comparisons of sound pressure levels for observation points
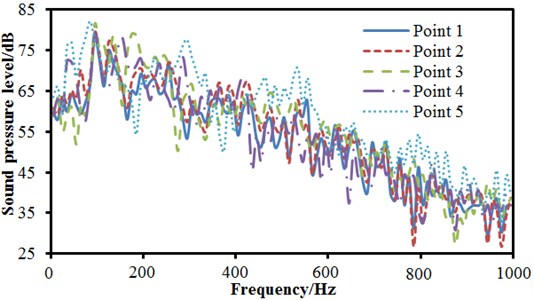
Fig. 8Experiments of aerodynamic noises of pantographs [18]
![Experiments of aerodynamic noises of pantographs [18]](https://static-01.extrica.com/articles/17204/17204-img13.jpg)
4. Numerical computation of aerodynamic characteristics of high-speed trains
Pantographs are installed on the top of high-speed trains, and aerodynamic noises of high-speed trains with pantographs are studied. Fig. 10 is a geometric model of high-speed trains. High-speed trains are divided into meshes according to the geometric model, as shown in Fig. 11. The model adopts structured and non-structured meshes. They are mainly triangular elements.
Fig. 9Comparisons of aerodynamic noises between simulation and experiment for pantographs
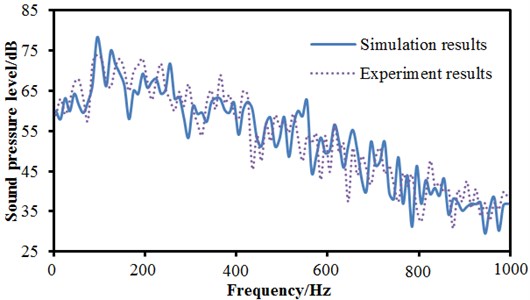
Fig. 10Geometric model of high-speed trains
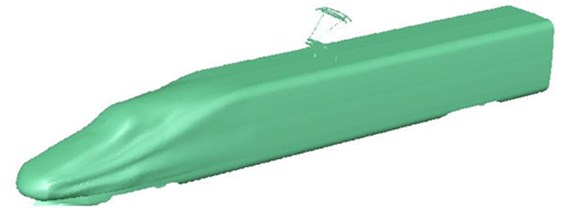
Fig. 11Aerodynamic mesh model of high-speed trains

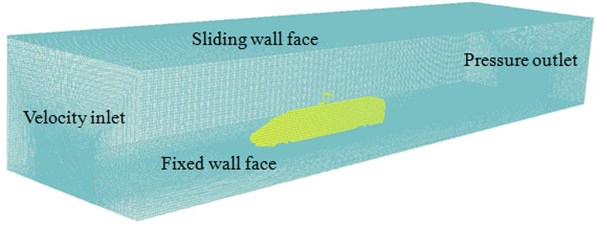
The computational domain and boundary condition are set as shown in Fig. 12. Hybrid meshes are adopted to divide the computational domain. Spatial meshes adopt tetrahedron, hexahedron and triangular prism, and there are 1 million elements. The running speed of the high-speed train in the paper is 350 km/h which is also commonly used at present. With the increase of the running speed of the high-speed train, the air pressure fluctuations acting on the surface of trains are increased, and aerodynamic noises become very obvious, which have been verified in many published papers. The paper only researches aerodynamic characteristics and radiation noises of the high-speed train under a single speed, and proposes a computational method and idea. Researches based on other speeds can also be conducted by this method. The computational model of aerodynamic characteristics of high-speed trains is shown in Fig. 13.
Based on the computational model of aerodynamic characteristics, the flow filed of high speed trains can be obtained, as shown in Fig. 14. Fig. 14(a) is aerodynamic pressure distribution of high-speed trains. It can be seen the largest aerodynamic pressure is at the position of noise tip. The aerodynamic pressure on the top of trains becomes uneven because of pantographs. Aerodynamic pressures become bigger at the position of pantographs. Fig. 14(b) is fluid velocity distribution of high-speed trains. It can be seen that pantographs have a great impact on flow of fluid. There is no fluid nearby the tail of high-speed trains. Fig. 14(c) is turbulence intensity distribution of high speed trains. It can be seen that the biggest turbulence intensity distribution is in the tail of high speed trains, because there is an obvious vortex, as is shown in Fig. 14(d). In addition, the turbulence intensity at the position of pantographs is obviously bigger than that at the other positions.
Fig. 12Computational domain and boundary conditions

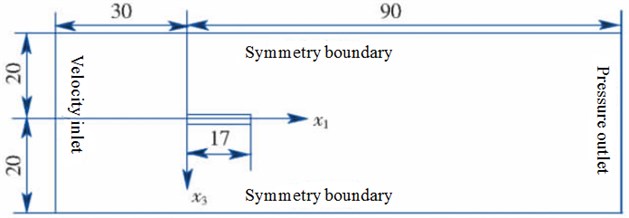
Fig. 13Computational model of aerodynamic characteristics of high-speed trains
The same method is also used to compute flow field of high-speed trains without pantographs, as shown in Fig. 15. Fig. 15(a) is pressure distribution of high-speed trains. It can be seen that the biggest pressure is still at the position of noise tip, while the pressure distribution on the top of trains is uniform, which is different from the result of Fig. 14(a). Moreover, due to the pantograph, the pressure distribution at the tail of trains is also affected obviously. Fig. 15(b) is flow velocity distribution of high-speed trains, it can be seen that there is a bigger region without fluids at the tail of high-speed trains and the flow velocity on the top of trains is symmetric, which is different from the result of Fig. 14(b). However, the flow velocity distribution at the position of noise tip is consistent. Fig. 15(c) is turbulence intensity distribution of high-speed trains. Compared with Fig. 14(c), it can be seen that turbulence intensity of high-speed trains at the tail becomes bigger. Pantographs have an obvious impact on turbulence intensity. The turbulence intensity at the tail of high-speed trains is not only big at the lower region but also big at the upper region, and it is mainly because two vortexes are at the tail of high-speed trains.
According to the analysis, it can be seen that pantographs have an obvious impact on flow field distribution of high-speed trains. As a result, when aerodynamic characteristics are computed, the high-speed train must include pantographs. Otherwise, the computational result is not reliable.
Fig. 14Flow filed of high-speed trains with panographs

a) Aerodynamic pressure distribution

b) Flow velocity distribution

c) Turbulence intensity distribution

d) Vortex distribution
5. Numerical computation of aerodynamic noises of high speed trains
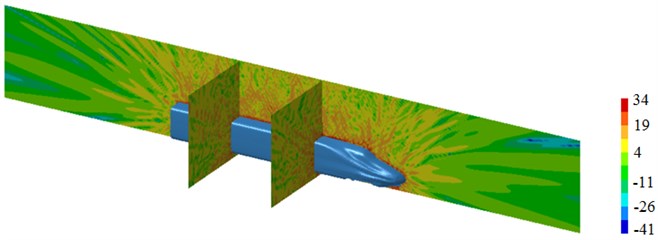
Based on the aerodynamic characteristics, this section continues to study aerodynamic noises of high-speed trains with pantographs. High-speed trains and pantographs are symmetrical structure, in order to reduce computational meshes and improve computational efficiency, so this section adopts half of the model to compute aerodynamic noises of high-speed trains. Fig. 16 is boundary element meshes of high-speed trains with pantographs. The size of meshes should meet six elements in a wave and the dimension of elements should be uniform. Then, the boundary element mesh and aerodynamic characteristics are imported into Virtual.Lab. In order to observe radiation noises of high-speed trains, three plane filed points on the longitudinally symmetrical surface and lateral surface are established, as shown in Fig. 17. Then, the result of aerodynamic characteristics is mapped to boundary element meshes to compute aerodynamic noises of high-speed trains, as shown in Fig. 18.
Fig. 15Flow filed of high speed trains without panographs

a) Aerodynamic pressure distribution

b) Flow velocity distribution

c) Turbulence intensity distribution

d) Vortex distribution
Fig. 16Boundary element models of high-speed trains

Fig. 18(a) is radiation noise contours of high-speed trains at 50 Hz. It can be seen that the position with higher noises is in pantographs and the tail of trains, it’s because serious structure change is in these two positions and disorder happens in the flow filed, which thus results in higher radiation noises. Fig. 18(b) is radiation noise contours of high-speed trains at 100 Hz. It can be seen that the position with higher noises is still pantographs and the tail of trains. Radiation noises have an obvious directivity in the longitudinally symmetrical plane. Fig. 18(c) is radiation noise contours of high-speed trains at 500 Hz. It can be seen that the position with higher noises is from transition position of head to pantographs. There are no higher radiation noises at the tail of trains, because no fluid flows at the tail of trains at this time. Fig. 18(d) is radiation noise contours of high-speed trains at 1000 Hz. It can be seen that radiation noises are higher on the surface of the train, and the dissipation is serious, but radiation noises on lateral side have obvious directivity.
Fig. 17Field points of high-speed trains

Fig. 18Sound pressure contours of high-speed trains at different frequencies

a) 50 Hz

b) 100 Hz

c) 500 Hz
d) 1000 Hz
Fig. 19Comparisons of SPLs at different observation points
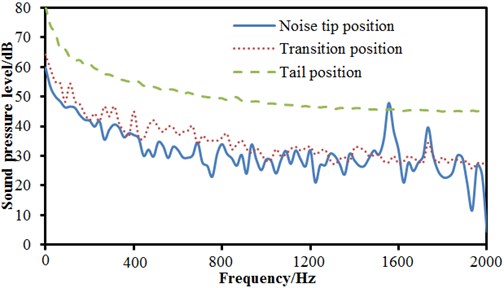
a) Comparisons of SPLs at the noise tip, transition and tail
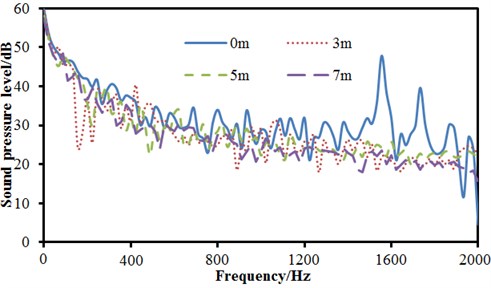
b) Comparisons of SPLs at the position with different distance away from noise tip
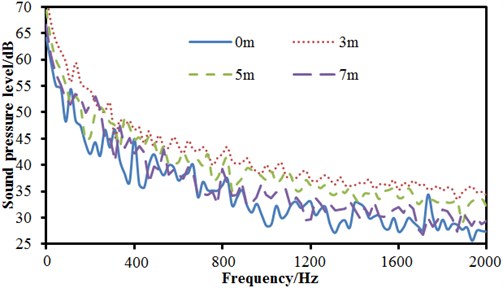
c) Comparisons of SPLs at the position with different distance away from transition
d) Comparisons of SPLs at the position with different distance away from tail
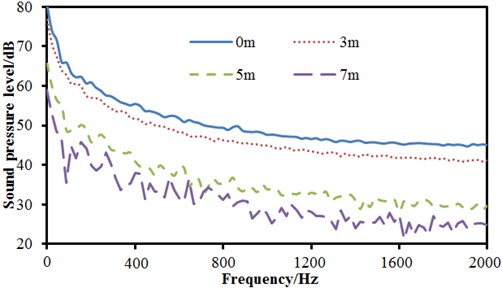
Sound pressure levels of each observation point of high-speed trains are extracted for comparison, as shown in Fig. 19. Fig. 19(a) is comparison of sound pressure levels at the position of noise tip, transition position and tail position. It can be seen that sound pressure levels at the position of tail are obviously higher than that at the position of noise tip and transition, and it’s mainly because the vortex at the tail causes serious vibrations. The sound pressure level curve at the tail is smooth, and there are no any peak and valley noises. Many peaks and valleys are in the sound pressure level at the position of noise tip, especially when the analyzed frequency is 1600 Hz, the peak noise is 52.3 dB. The change trend of sound pressure levels at three observation points is the same. When the analyzed frequency is lower than 800 Hz, sound pressure levels decrease gradually with the increase of the analyzed frequency. When the analyzed frequency is over 800 Hz, the sound pressure level fluctuates nearby a constant value. The observation point in Fig. 19(b) is in the same vertical plane. The distance from noise tip is 0 m, 3 m, 5 m and 7 m, respectively. It can be seen that the sound pressure level at the position of noise tip is the highest. With the increase of the analyzed distance, radiation sound pressure levels decrease gradually, but sound pressure levels at several frequency positions increase. Moreover, with the increase of the analyzed distance, the quantity of peak and valley of sound pressure level curves also decreases gradually. The observation point in Fig. 19(c) is in the same vertical plane. The distance from transition position is 0 m, 3 m, 5 m and 7 m, respectively. It can be seen that the change trend of sound pressure levels of all observation points in the frequency domain is the same. Sound pressure levels do not decrease gradually with the increasing of distances and the sound pressure level is the greatest at the position of 3 m. The observation point in Fig. 19(d) is in the same vertical plane. The distance from tail position is 0 m, 3 m, 5 m and 7 m, respectively. It can be seen that the change trend of sound pressure levels at the position of 0 m and 3 m is consistent, while the change trend at the position of 5 m and 7 m is different. There are a lot of peak and valley noises. Sound pressure levels at the position of 0 m and 3 m are obviously bigger than that at the position of 5 m and 7 m in the analyzed frequency.
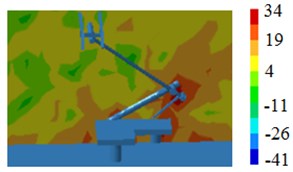
Fig. 20Radiation noise contours in pantograph position
a) 50 Hz
b) 100 Hz
c) 500 Hz
d) 1000 Hz
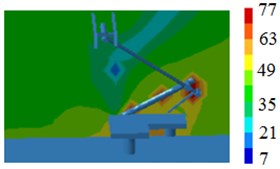
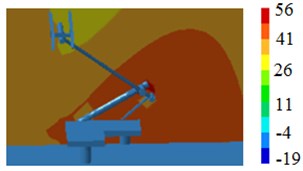
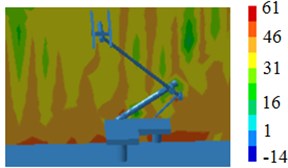
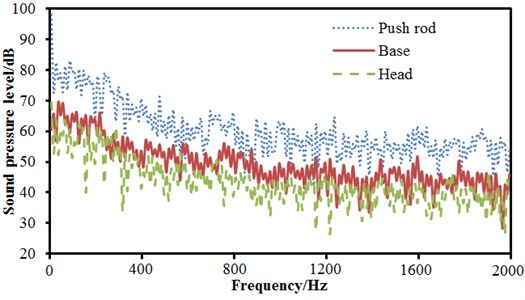
In order to observe the radiation noise, radiation noise contours nearby pantographs and sound pressure levels are extracted, the result is shown in Fig. 20 and Fig. 21. According to Fig. 20, the radiation noise at the position of pushrod is relatively higher, it’s mainly because pantographs bear leeward on the high-speed train, pushrod interacts with fluid firstly and two separation vortexes are at the pushrod of pantographs according to Fig. 3. The radiation noise at the head of pantographs is not very high, which is inconsistent with the conclusion from section 3. According to Fig. 21, it can be seen that radiation noises at the position of pushrod is obviously higher than that at the position of base and head of pantographs, and the noise at the position of head of pantographs is the lowest relatively, because base is connected with high-speed trains and may have interactive coupling vibration with high-speed trains, which causes the radiation noise at the position of base higher than that at the head of pantographs. In addition, the peak and valley of sound pressure levels at the position of base is not as obvious as that at pushrod and head of pantographs, it is mainly because the structural rigidity at the position of base is greater and density of modal is not intensive, thus there are few peak and valley radiation noises excited by the aerodynamic action.
Fig. 21Comparisons of SPLs at different positions of pantographs
6. Conclusions
1) This paper uses large eddy simulation and boundary element method to compute the flow field and aerodynamic noises of pantographs and high speed trains. The result presents that there are obvious eddies at the head, push rod, and base. Two obvious separation eddies can be found around the guide rod of the head. And two obvious separation eddies are also around the push rod of pantographs. The front part of the base has a layer of shear flow, which leads to a separation eddy in the back of the base while the flow moves backward. Noises of pantographs mainly concentrate around the head, base and push rod. With the increase of the analyzed frequency, strength of pantograph noise source is weaker and weaker. When the analyzed frequency is 500 Hz, the noise source of pantographs is mainly around joints of several structures.
2) By comparing the computational and experimental result of aerodynamic noises of pantographs, this paper presents that they are consistent with each other in change tendency and value within the whole analyzed frequency domain. This indicates the computational model of aerodynamic noises of pantographs is effective.
3) The aerodynamic characteristics of high-speed trains with pantographs and without pantographs are computed respectively. The result presents that pantographs have an obvious impact on distribution of flow field around the high-speed train, especially at the tail. There is only one vortex in the high-speed train with pantographs, while there are two vortexes in the high-speed train without pantographs. Therefore, when high-speed trains are numerically computed, pantographs cannot be neglected.
4) Through boundary element method, the paper computes the aerodynamic noise of high-speed trains with pantographs. In the low frequency, radiation noises are mainly nearby pantographs and tail of trains. Within the longitudinally symmetrical plane of high-speed trains, the sound pressure level at the tail is the biggest. Pushrod has the biggest radiation sound pressures nearby pantographs, the second is base and the last is head of pantographs.
References
-
Shen Z. Y. Dynamic environment of high-speed train and its distinguished technology. Journal of the China Railway Society, Vol. 28, Issue 4, 2006, p. 1-5.
-
Talotte C. Aerodynamic noise: a critical survey. Journal of Sound and Vibration, Vol. 231, Issue 3, 2000, p. 549-562.
-
Lighthill M. J. On sound generated aerodynamically. I. General theory. Proceedings of the Royal Society of London A: Mathematical, Physical and Engineering Sciences, The Royal Society, Vol. 211, Issue 1107, 1952, p. 564-587.
-
Curle N. The influence of solid boundaries upon aerodynamic sound. Proceedings of the Royal Society of London A: Mathematical, Physical and Engineering Sciences, The Royal Society, Vol. 231, Issue 1187, 1955, p. 505-514.
-
Williams J. E. F., Hawkings D. L. Sound generation by turbulence and surfaces in arbitrary motion. Philosophical Transactions of the Royal Society of London A: Mathematical, Physical and Engineering Sciences, Vol. 264, Issue 1151, 1969, p. 321-342.
-
Goldstein M. Unified approach to aerodynamic sound generation in the presence of solid boundaries. The Journal of the Acoustical Society of America, Vol. 56, Issue 2, 1974, p. 497-509.
-
King W. F. A precis of development in the aeroacoustics of fast trains. Journal of Sound and Vibration, Vol. 193, Issue 1, 1996, p. 349-358.
-
Noger C., Patrat J. C., Peube J., et al. Aeroacoustical study of the TGV pantograph recess. Journal of Sound and Vibration, Vol. 231, Issue 3, 2000, p. 563-575.
-
Fremion N., Vincent N., Jacob M., et al. Aerodynamic noise radiated by the intercoach spacing and the bogie of a high-speed train. Journal of Sound and Vibration, Vol. 231, Issue 3, 2000, p. 577-593.
-
Kitagawa T., Nagakura K. Aerodynamic noise generated by Shinkansen cars. Journal of Sound and Vibration, Vol. 231, Issue 3, 2000, p. 913-924.
-
Barsikow B. Experiences with various configurations of microphone arrays used to locate sound sources on railway trains operated by the DB AG. Journal of Sound and Vibration, Vol. 193, Issue 1, 1996, p. 283-293.
-
Mellet C., Létourneaux F., Poisson F., et al. High speed train noise emission: Latest investigation of the aerodynamic/rolling noise contribution. Journal of Sound and Vibration, Vol. 293, Issue 3, 2006, p. 535-546.
-
Sassa T., Sato T., Yatsui S. Numerical analysis of aerodynamic noise radiation from a high-speed train surface. Journal of Sound and Vibration, Vol. 247, Issue 3, 2001, p. 407-416.
-
Takaishi T., Sagawa A., Nagakura K., et al. Numerical analysis of dipole sound source around high speed trains. The Journal of the Acoustical Society of America, Vol. 111, Issue 6, 2002, p. 2601-2608.
-
Takaishi T., Ikeda M. Method of evaluating dipole sound source in a finite computational domain. Railway Technical Research Institute, Vol. 116, Issue 3, 2004, p. 1427-1435.
-
Zhang S. G. Noise mechanism, sound source localization and noise control of 350 km/h high-speed train. China Railway Science, Vol. 30, Issue 1, 2009, p. 86-90.
-
Xiao Y. G., Kang Z. C. Numerical prediction of aerodynamic noise radiated from high speed train head sources. Journal of Center South University (Science and Technology), Vol. 39, Issue 6, 2008, p. 1267-1272.
-
Zhang Y. S., Jia Y., Lv L. X. Experimental study of high-speed train pantograph in wind tunnel. Journal of Experimental Mechanics, Vol. 29, Issue 1, 2014, p. 105-110.
