Abstract
With global climate and environment deterioration, the desertification is getting worse and the phenomenon of wind-sand flow frequently occurs in many areas. Hangers of suspension bridges may suffer the impact from wind-sand flow and be damaged. In this study, the riding-type hangers with four strands which are the commonly used hanger of long-span suspension bridges are taken as an example to investigate the influence of wind-sand flow on the hangers. The aerodynamic interference effect can occur among the four strands under the action of wind-sand flow. In order to explore the influence of wind-sand flow on the hangers, the wind-sand flow field around the riding-type hangers of a long-span suspension bridge is simulated within the FLUENT software on the basis of the numerical simulation of computational fluid dynamics. The pressure and velocity contour, aerostatic coefficients and forces produced by the wind-sand flow under different wind attack angle and volume fractions of sand phase are analyzed from the simulation. Results indicate that the forces exerted by the wind-sand flow on riding-type hangers are greater than the forces exerted only by wind. In the wind and wind-sand flow field, the drag and lift coefficients of the front two strands of hangers exhibit minor changes with increasing wind attack angle, whereas those of the back two strands increase first and then decrease to a small value. The volume fraction of the sand phase has an insignificant effect on the drag and lift coefficients, but has a significant effect on the force exerted on the hanger, and the force exerted on the hangers multiplies when the volume fraction of the sand phase multiplies. The results lay a theoretical foundation for the corrosion fatigue analysis of riding-type hangers for large-span suspension bridges under the action of wind-sand flow.
1. Introduction
With global climate and environment deterioration, desertification has become one of the most prominent environmental problems in the world [1, 2]. The Chinese desertification situation is very serious, and China has become one of the most severely desertification countries in the world, with up to 3.3 million km2 desertification lands [3-5]. Land desertification provides the source material for wind-sand flow. And the wind-sand flow occurred in Midwest China has become more and more frequent and serious, and causes huge losses to the country every year. As for the research of desertification, it mainly focused on the prevention and control of desertification itself. For example, Sun et al. [6] inspected the relationship between spatial and temporal distribution of vegetation and climate, and studied the ecological restoration in the Loess Plateau of China. Cheng et al. [7] presented an alternative way to prevent water loss and soil erosion and for prevention and revitalization by using microbial biopolymers. Yang et al. [8] studied the changes of soil organic carbon in soil aggregates associated with different stages of desertification process in the ordos sand land of Inner Mongolia and analyzed the distribution and aggregate changes of soil combined humus. The study of Rocio et al. [9] presented a way that integrated a set of indices on behalf of four desertification factors (vegetation, soil, climate and anthropic disruptors) to analyze desertification risk in the semi-arid highlands of central Mexico. Xie et al. [10] studied the formation mechanism and the proper control methods of sand hazards at Honglianghe River section of Qinghai-Tibet Railway. However, very few studies have been reported on the influence of wind-sand flow produced by desertification on bridges, especially on the long-span suspension bridges.
Given the rapid economic development and increasing road traffic in Midwest China, the number of long-span bridges across rivers or canyons has been increasing day by day. A suspension bridge as a major bridge type to overcome great distances is required to against external and high intensity loads [11]. The hangers of cable system bridges are one of the members that have important effects on structural safety and are also damageable during the operation period of the bridges [12]. The limiting life of a suspension bridge can be mainly controlled by the aging of the cables and hangers [13, 14]. The riding-type hangers are the main sling form for suspension bridges. The juxtaposition of four strands shows not only the aerodynamic interference effect by the wind but also the effect of windblown sand on hangers in the desert area, which cannot be disregarded. For a long time, blown sand engineering has always been treated as the main study content of desertification and its governance. However, the current research level of blown sand physics is still far from meeting the various needs of engineering practice. The effect of blown sand on the riding-type hangers of a suspension bridge is unclear. The basic theory knowledge for the effect of wind-sand flow on hangers is insufficient, and the experiment research is complex. Therefore, numerical simulation has become one of the effective methods to research sandstorms.
At present, there has been much research on the bridge hangers. For example, in Qiu’s study [15], the influences of sudden breakage of hangers on the bridge due to corrosion are researched and analyzed in detail by using nonlinear dynamic analysis method and setting up the three-dimensional finite element model. Shao et al. [16] pointed out a regression equation which is helpful to calculate the hanger's dynamic stresses, and the regression equation is deduced from finite element method. Zeng et al. [17] took the hangers of Jiangyin Bridge as the research example, and pointed out an evaluation method based on S-N curve of suspenders fatigue damage, and the research results show that the fatigue life of long hangers is longer than the shorter ones, so the shorter hangers are the focus of maintenance. Gjelstrup et al. [18] analyzed aerostatic coefficients though the static wind tunnel tests on a bridge hanger represented by a circular cylinder with simulated thin ice accretions, while mean and fluctuating responses through the dynamic tests. Demartino et al. [19] also studied the influence of ice accretion on bridge hangers, and measured the aerodynamic force coefficients under different yaw Angle, different wind attack angles and wind speed through wind tunnel test. Zhan et al. [20] studied vortex-induced vibration of steel box hanger with varying wind attack angle by establishing two-dimensional bending fluid-structure interaction numerical model within secondary development of software FLUENT. Bai et al. [21] studied the vortex-induced vibration behavior of steel arch bridge hanger by developing a fluid-structure interaction numerical simulation technique which is based on CFD numerical simulation. However, the study of the effect of wind-sand flow on the damage of hangers has not attracted the attention of experts and scholars.
The current work focuses on the law of aerodynamic interference effect of four strands on a rectangular arrangement and the force of the windblown sand exerted on the four strands. To achieve this goal, we adopted computational fluid dynamics (CFD) on the basis of a previous research that refers to the riding-type hangers of a long-span suspension bridge. The wind-sand flow field around the hangers of a long-span suspension bridge is simulated within the FLUENT software. To start with, the drag and lift coefficients of a column section and a rectangular section are calculated to verify the reasonability and validity of the method. Thereafter, the same method is used to simulate the wind flow and wind-sand flow around the hangers of a suspension bridge, analyzed the influence of different wind attack angle and different sand phase volume fraction on the riding-type hangers are analyzed respectively. Finally, the influence mechanism of wind-sand flow on the riding-type hangers is analyzed. These studies can lay the foundation of the fatigue analysis of riding-type hangers for large-span suspension bridges.
2. The effect of sand volume fractions on the aerodynamic force on riding-type hangers
2.1. Numerical simulation method of the aerodynamic coefficients for four cylinders in a rectangular arrangement
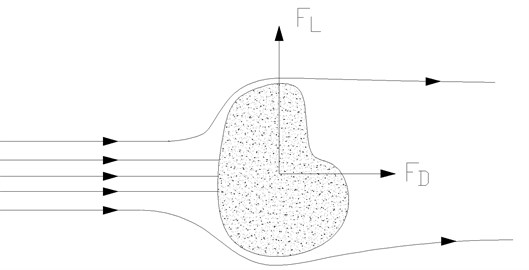
Drag and lift coefficients are the dimensionless form of drag and lift forces. The components of applied force for the bluff body downstream and cross flow are called drag and lift forces, respectively. Fig. 1 shows the diagram of the bluff body submerged in fluid. The drag and lift coefficients can be defined as follows [22]:
where and are the drag and lift force of the hangers section in the body axis coordinates, respectively; is the density of fluid; is the average velocity of fluid; is a characteristic length of the bluff body cross section along the wind dimension [23].
Fig. 1Lift and drag force on any bluff body
The mathematical model of incompressible Reynolds-averaged Navier-Stokes equations and the standard - two-equation turbulence model are adopted. The wind is treated as a 2D unsteady incompressible flow because of the high velocity of crosswind airflow, and the effect of temperature changes is not considered. The finite volume method is combined with the wall function method and use the second-order upwind scheme. The CFD software FLUENT is used to simulate the flow field around the model and the convection and diffusion terms are used to calculate single-precision data. The problem of the speed component in momentum equation coupling with the pressure is solved by the default SIMPLE algorithm.
The correctness of the model for numerical wind tunnel test has been verified by Lam et al. [24]. On the basis of the experimental data provided in literature, the data of the spacing ratio 3.83 is simulated in this paper ( is the center-to-center cylinder spacing and is their diameter) [24]. Fig. 2 shows the results of the CFD numerical simulation that are almost the same as those of related literature. However, a difference exists between the simulated results and experimental results mainly because of the assumption of that a planar flow field is a 3D flow field in nature. Furthermore, the similar ratio, unit number, and computational domain also have a certain influence to the result. The small difference indicates that the numerical simulation method is reasonable and valid. By contrast, the single-column model of wind flow is simulated with the same method by using a Reynolds number of 8×10⁴. Table 1 show that the drag coefficient of the column is 1.215, which is almost the same as that in the related literature. Therefore, the numerical simulation method for the wind flow is reasonable and valid.
Fig. 3 shows the layout of the riding-type hangers of a large-span suspension bridge. The riding-type hangers include the general sling, short sling, and long sling near the tower. The general sling is taken as the research object because it is mostly used in the hangers of a suspension bridge. The slings are in a rectangular arrangement, and the spacing is 600 mm across the bridge and 300 mm along the bridge. Fig. 4 shows the constructed diagram of a general riding-type hanger. Given that the length of the sling is larger than its diameter, the calculation problem of the flow field is approximated into a plane problem, i.e., the flow is calculated around four cylinders that are in rectangular arrangement.
Fig. 2Results of the numerical simulation and related literature [24]
![Results of the numerical simulation and related literature [24]](https://static-01.extrica.com/articles/17247/17247-img2.jpg)
a) Drag coefficients
![Results of the numerical simulation and related literature [24]](https://static-01.extrica.com/articles/17247/17247-img3.jpg)
b) Lift coefficients
Table 1Force calculation results compared with experimental results
Author | Re | Drag coefficients |
Simiu et al. [22] | 10×104 | Approximately 1.22 |
Lam et al. [24] | 6×10⁴ | 1.217 |
This study | 8×10⁴ | 1.215 |
Fig. 3Layout of the riding-type hangers of a large-span suspension bridge

Fig. 4A photo of the riding-type hangers
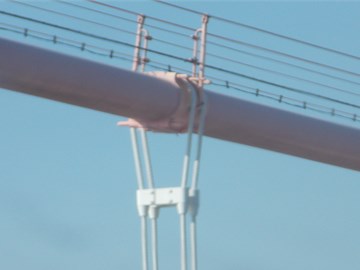
Fig. 5Diagram of the wind field around the hangers
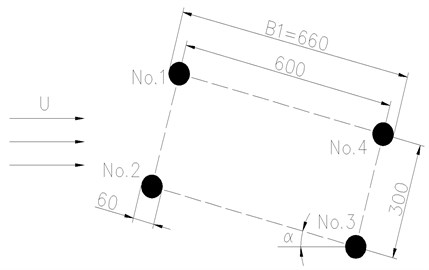
In Fig. 5, is the wind speed and is the wind attack angle. Four slings are named No. 1, No. 2, No. 3, and No. 4, respectively. The distance between No. 1 and No. 2 correspond to the distance of the sling along the bridge, whereas the distance between No. 2 and No. 3 correspond to the distance of the sling across the bridge. The sling diameter is 60 mm. Referring to the simulation results of the bluff body with a rectangular section. Fig. 6 shows the distance of the center to the upstream boundary (5 B1), downstream boundary (10 B1), and top and bottom boundaries (both 5 B1). B1 is the width of the circumscribed rectangle section of the four slings. By adopting the massive grids, Fig. 7 shows that the minimum size of the grid is 0.0036 B1, and the total number of the grid is 181,500.
Fig. 6Computational domain for wind-sand flow around the riding-type hangers
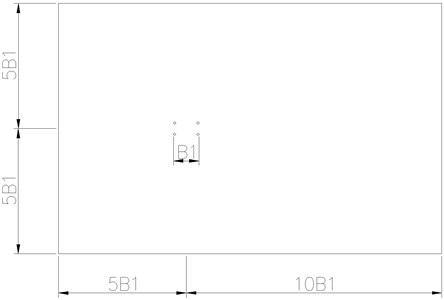
Fig. 7Mesh of the wind-sand flow on the riding-type hangers
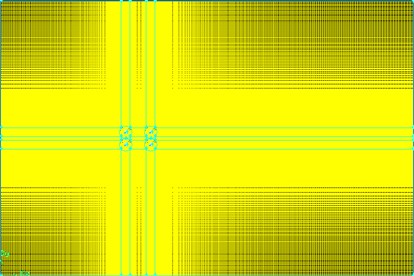
a) Mesh of the wind-sand flow field used in the calculation
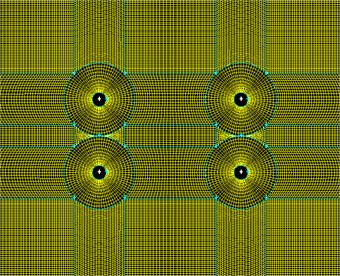
b) The detailed figure of Fig. 7(a)
2.2. Aerodynamic performance comparative analysis of the riding-type hangers in wind and wind-sand flow field
According to the wind resistance design specification for highway bridges (JTG/T D60-01-2004) on the basis of the effect of the maximum wind speeds and wind forces of different reproduced periods on highway traffic meteorological condition grades, the entrance wind-sand flow speed is 20 m/s [25]. The outlet boundary is outflow. The threshold boundary is outflow. The surface of the hanger section is treated as no-slip wall boundary conditions, and the top and bottom boundary conditions are symmetry boundary.
On the basis of the numerical simulation of the single-phase wind field of the hanger section, we introduce the second phase, i.e., the sand phase. The density of the sand is 2000 kg/m3, and the diameter is 5×10⁻⁶ m. The speed of the wind-sand flow is 20 m/s. The mixture model is used as a multiphase flow model because of the simplicity and stability of the simulation result of the mixture model [26]. By adding only 2 % of the particle phase volume fraction, FLUENT is used to numerically simulate the wind flow and the windblown sand flow field under different wind attack angles.
Fig. 8 and Fig. 9 show the pressure contour and velocity contour of the four cylinders under 0° wind attack angle, respectively. It can be found that the shapes of pressure contour and velocity contour in the numerical simulation of wind-sand two phase flow are almost the same, but the maximum pressure in wind-sand flow field is about 30 times of wind field, so the effect of wind-sand flow on cables is exerted considerable. From the velocity contour, we can see that the velocity of mixture, air phase and sand phase are almost the same. Compared with the velocity contour in wind flow field, the velocity contour affected by the cable cross section area is larger, but the maximum velocity is smaller. The magnitude of pressure contour in wind-sand flow field is greater than it in wind flow field, because the density of sand is much largest than the density of air. Since the numerical simulation of wind-sand two phase flow is mixture model, and without considering the coupling effect between each phase.
Fig. 8Pressure contour under 0° wind attack angle
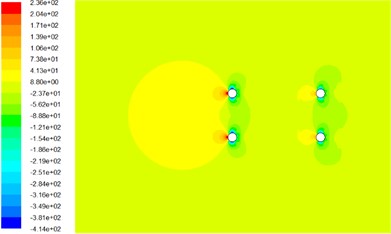
a) In wind flow field
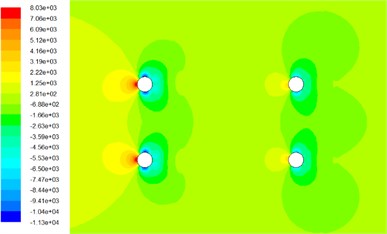
b) In wind-sand flow field
Fig. 9Velocity contour around the cable under 0° wind attack
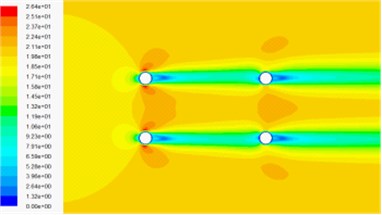
a) Velocity contour in wind-sand flow field
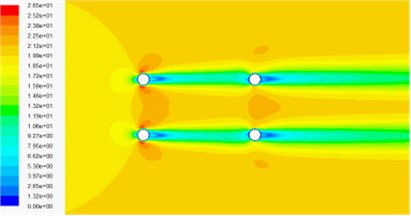
b) Velocity contour of air phase in wind-sand flow field
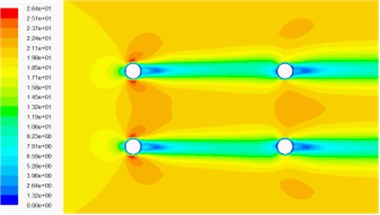
c) Velocity contour of sand phase in wind-sand flow field
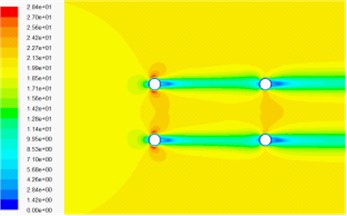
d) Velocity contour in wind flow field
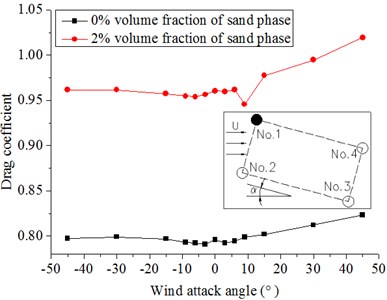
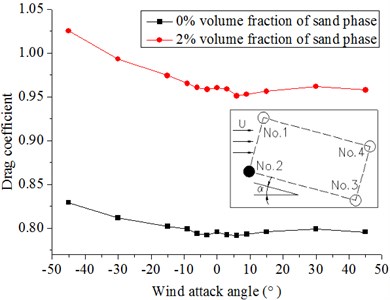
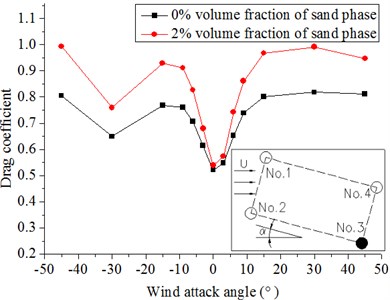
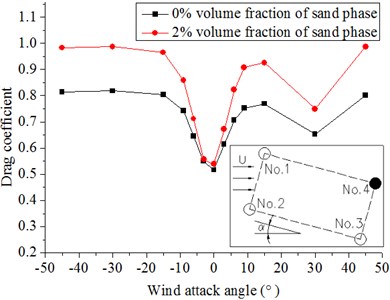
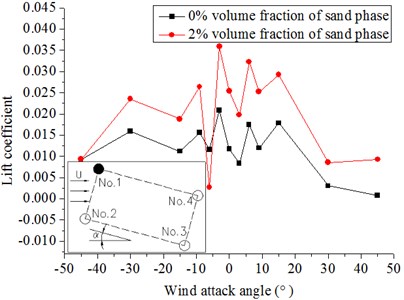
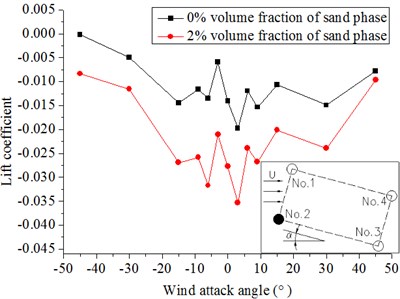
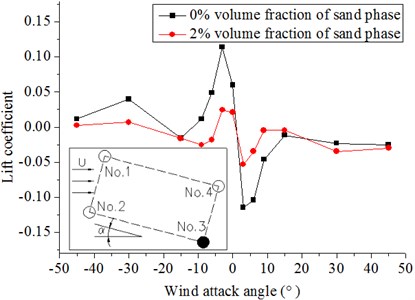
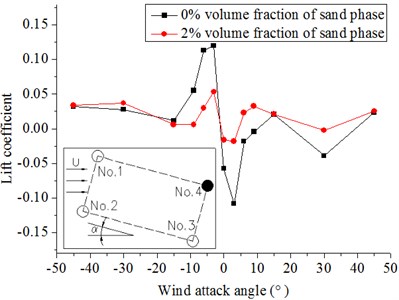
Fig. 10 and Fig. 11 show that the drag and lift coefficients of the four cylinders in the wind flow and windblown sand flow field that vary with the wind attack angle. From these diagrams, we can get the results as follows:
(1) The wind attack angle has a small effect on the drag and lift coefficients of No. 1 and No. 2, whereas the effect on No. 3 and No. 4 is larger. The lift coefficients of No. 1 and No. 2 decrease with increasing wind attack angle in the range of a small particle size. On the contrary, a fluctuation arises when the wind attack angle greatly increases. The absolute values of the lift coefficients of No. 3 and No. 4 firstly increase and then decrease at a small wind attack angle, but the fluctuation is not obvious when the wind attack angle becomes large.
(2) The drag coefficients in the windblown sand flows are approximately 1.2 times to 1.3 times higher than those in the wind flow. The lift coefficients in the windblown sand flow are also higher than those in the wind flow. Thus, the effect of sand is significant.
(3) Difference of the drag and lift coefficients between the front and back columns is large under the action of the sand flow. In the model of riding-type hangers, the forces of the back two columns in the wind and wind-sand flow field are approximately 0.5 times to 0.7 times of that of the front two columns when the wind attack angle is from 0° to ±9°. The difference of the force on four cylinders becomes small with increasing wind attack angle (±15° to ±45°).
Fig. 10Drag coefficients of hangers under different wind attack angles in the 20 m/s wind field and 20 m/s windblown sand field
a) No. 1
b) No. 2
c) No. 3
d) No. 4
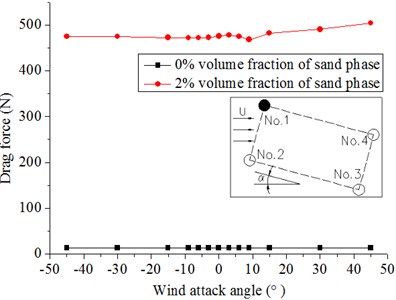
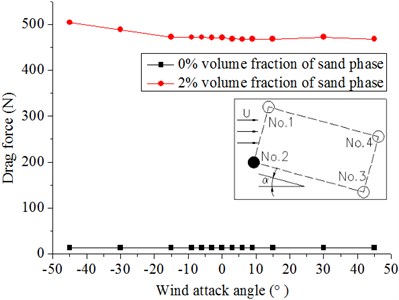
Fig. 12 shows the drag force on the hangers. The results indicate that the force on the hangers in windblown sand flow with a 2 % volume fraction of sand phase is considerably larger than that in the wind flow. The reason is that the introduction of sand increases the force on the columns. The former is approximately 40 times of the latter. Therefore, the effect of sand in the windblown sand flow on the force of the hanger cannot be disregarded.
Fig. 11Lift coefficients of hangers under different wind attack angles in the 20 m/s wind field and 20 m/s windblown sand field
a) No. 1
b) No. 2
c) No. 3
d) No. 4
Fig. 12Forces on No. 1 and No. 2 under different wind attack angles in the 20 m/s wind field and 20 m/s windblown sand field
a) No. 1
b) No. 2
2.3. The effect of the different volume fractions of sand phase on the aerodynamic force on riding-type hangers
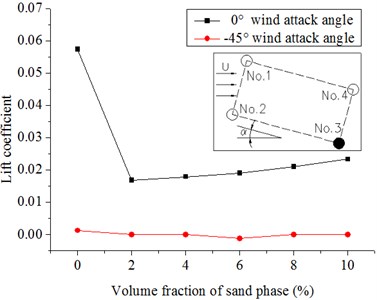
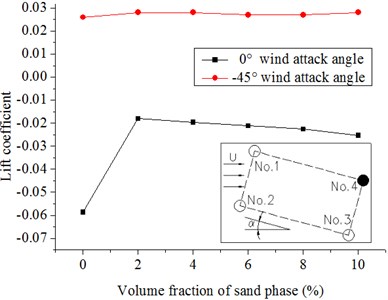
On the basis of previous analysis, the effect of the different volume fractions of the sand phase on the force exerted on four cylinders in a rectangular arrangement is simulated and analyzed under two different wind attack angles. The computational model of the 0° and −45° wind attack angle is calculated by changing the volume fractions of the sand phase only (0 %, 2 %, 4 %, 6 %, 8 %, and 10 %).
Fig. 13 and Fig. 14 show that the sand phase volume fraction has no effect on the shape of pressure contour and velocity contour, but has effect on the magnitude of pressure contour. With the increase of the sand phase volume fraction, the magnitude of pressure contour is also increased. Different wind attack angle has little impact on the magnitude of pressure contour.
Fig. 13Pressure contour in wind-sand flow field
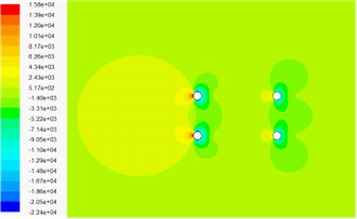
a) 4 % volume fraction of sand phase under 0° wind attack angle
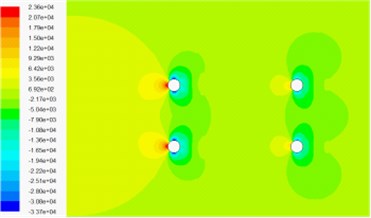
b) 6 % volume fraction of sand phase under 0° wind attack angle
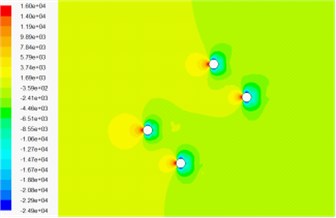
c) 4 % volume fraction of sand phase –45° wind attack angle
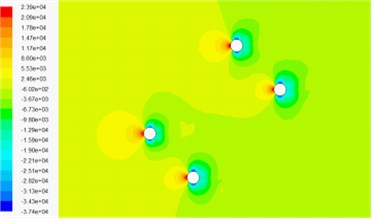
d) 6 % volume fraction of sand phase –45° wind attack angle
Fig. 14Velocity contour in wind-sand flow field
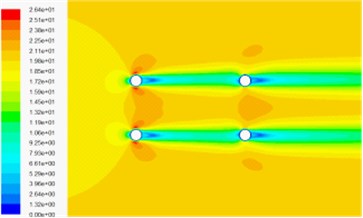
a) 4 % volume fraction of sand phase under 0° wind attack angle
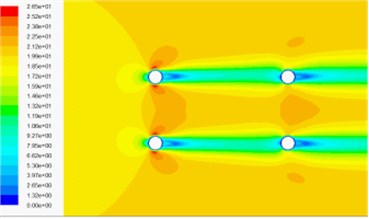
b) 6 % volume fraction of sand phase under 0° wind attack angle
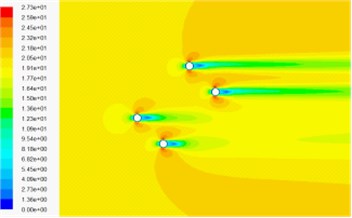
c) 4 % volume fraction of sand phase under –45° wind attack angle
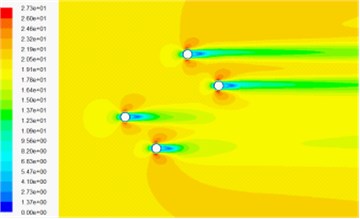
d) 6 % volume fraction of sand phase under –45° wind attack angle
Fig. 15 and Fig. 16 show the results. The drag coefficients of the two columns in the front increase with the introduction of the sand phase and decrease gradually with increasing volume fraction of the sand phase. The reason is because the drag coefficient varies with drag force and the density of the flow in our specific model. When introducing the sand phase, the drag force on the column and the density of the flow increases. However, the increase in drag force is larger; thus, the drag coefficient increases as the sand is introduced. With an increase in sand, and the densities increase although the drag coefficient increases at the same time. The densities increase quickly; thus, the drag coefficients decrease slowly. With the increasing volume fraction of the sand phase, the drag coefficients of the back two columns almost remain invariant whether the wind attack angle is 0° or −45°. The absolute values of the lift coefficients of the front columns are larger with the introduction of the sand phase, whereas the lift coefficients almost remain the same or have a tendency to decrease slowly with the increasing volume fraction of the sand phase. The drag and lift coefficients of the back columns are affected not only by the volume fraction of the sand phase but also by the wind attack angle. With the introduction of the sand phase and the increase in volume fraction of the sand phase, the absolute values of the lift coefficients of No. 3 at a 0° wind attack angle and No. 4 at a −45° wind attack angle slowly decrease; by contrast, the lift coefficients of No. 4 at a 0° wind attack angle and No. 3 at a −45° wind attack angle almost remain invariant. The introduction of the sand phase significantly increases the force on the hangers, and the magnitude is greater than that of the densities of the windblown sand flow. With the increasing volume fraction of the sand phase, the densities of the flow increases largely, whereas the drag and lift coefficients have a tendency to decrease.
Fig. 15Drag coefficients of hangers under the different volume fractions of sand phase in the 20 m/s wind field and 20 m/s windblown sand field
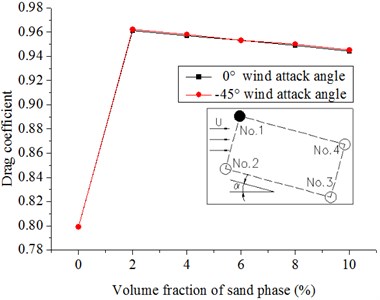
a) No. 1
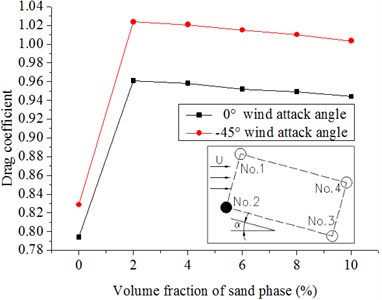
b) No. 2
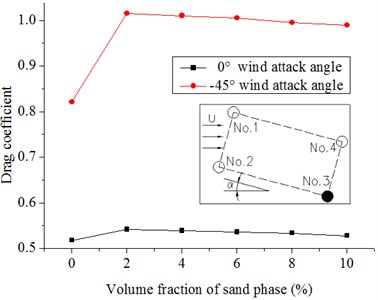
c) No. 3
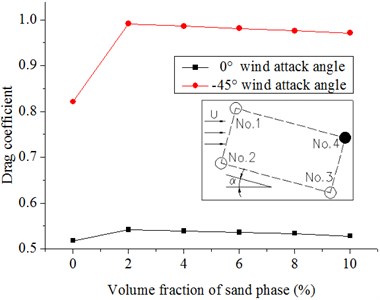
d) No. 4
Fig. 16Lift coefficients of hangers under the different volume fractions of sand phase in the 20 m/s wind field and 20 m/s windblown sand field
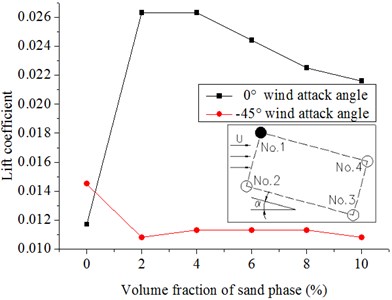
a) No. 1
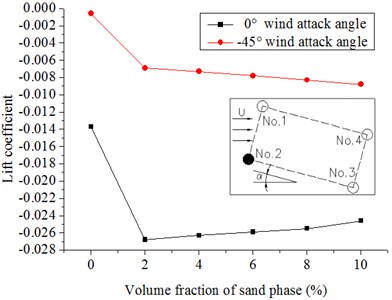
b) No. 2
c) No. 3
d) No. 4
3. Discussions
This paper studied the numerical simulation of wind-sand flow on suspension bridge hangers. Analyze and compare the influence on the sling section forces in wind-sand flow field with different sand phase volume fraction under different wind attack angle. The force of sling section in the wind-sand flow field under different wind attack angle is bigger than the force in wind field. The reason is because the hangers can be affected by not only the wind but also the windblown sand. When introducing the sand phase, the drag force on the column and the density of the flow increases. With an increase in sand, and the densities increase although the drag coefficient increases at the same time. The influence of wind-sand flow on the cables cannot be ignored.
Numerical simulation of wind-sand flow in this paper treats sand phase as continuous medium, and does not consider the coupling effect between sand and the air. However, in the actual wind-sand flow, sand phase is discrete medium, and the diameter of sand is unclear. Therefore, Numerical simulation of wind-sand flow in this paper may be different from effect of the actual wind-sand flow. The next work of the corrosion fatigue effect of wind-sand flow on riding-type hangers is to develop the more reasonable numerical simulation model, in a more realistic reflection of the sand flow of the results, in order to reflect effect of wind-sand flow more veritably. At the same time, the wind tunnel test and numerical simulation should be conducted on the basis of field observation, in order to understand characteristics of wind-sand flow more roundly.
4. Conclusions
Fluent is used to simulate the wind-sand flow field around the hangers of a long-span suspension bridge on the basis of the numerical simulation of computational fluid dynamics and the main conclusions are summarized as follows:
1) The lift and drag coefficients of the hanger section in the wind-sand flow field are slightly larger than those in the wind flow field, but the force of the hanger section in the wind-sand flow field is larger than that in the wind flow field. Thus, the effect of sand on the hanger in the wind-sand flow field is significant.
2) The effect of the different wind attack angles on the riding-type hanger of a suspension bridge is listed as follows: the wind attack angle has a small effect on the windward hangers but has a large effect on shelter hangers.
3) In the model of riding-type hangers, the forces of the back two columns in the wind and wind-sand flow field are approximately 0.5 times to 0.7 times higher than those of the front two columns when the wind attack angle is from 0° to ±9°. The difference between the forces exerted on the four cylinders decreases with increasing wind attack angle (±15° to ±45°).
4) The volume fraction of the sand phase has an insignificant effect on the drag and lift coefficients of the hanger but has a significant effect on the force exerted on the hanger. The force exerted on the hangers multiplies when the volume fraction of the sand phase multiplies.
References
-
Sun D. F. Detection of dryland degradation using Landsat spectral unmixing remote sensing with syndrome concept in Minqin County, China. International Journal of Applied Earth Observation and Geoinformation, Vol. 41, 2015, p. 34-45.
-
Chang I., Prasidhi A. K., Im J., Shin H. D., Cho G. C. Soil treatment using microbial biopolymers for anti-desertification purposes. Geoderma, Vol. 253, Issue 254, 2015, p. 39-47.
-
Decai Z. Dynamical Evolution of Sand Sea in China. Gansu Culture Press, 1998. p. 20.
-
Zhong D. C., J. J. Recent development trend and predication of sand deserts in China. Arid Environ, Vol. 53, 2013, p. 317-329.
-
Wu X. X., Zhou X. Y., Zhou N., Zhang C. L., Shi S. Deceleration efficiencies of shrub windbreaks in a wind tunnel. Aeolian Research, Vol. 16, 2015, p. 11-23.
-
Sun W. Y., Song X. Y., Mu X. M., Wang F., Zhao G. J. Spatiotemporal vegetation cover variations associated with climate change and ecological restoration in the Loess Plateau. Agricultural and Forest Meteorology, Vols. 209-210, 2015, p. 87-99.
-
Chang I., Prasidhi A. K., Im J., Shin H. D., Cho G. C. Soil treatment using microbial biopolymers for anti-desertification purposes. Geoderma, Vols. 253-254, 2015, p. 39-47.
-
Yang Z. C., Lv Y. Z., Li H. Changes of soil organic carbon in soil aggregates under different stages of desertification in the ordos sand land of inner Mongolia. Journal of Coastal Research, Special Issue, Vol. 73, 2015, p. 420-425.
-
Rocio Becerril-Pina, Carlos Alberto Mastachi-Loza, Enrique Gonz alez-Sosa, Carlos Díaz-Delgado, Khalidou M. B. Assessing desertification risk in the semi-arid highlands of central Mexico. Journal of Arid Environments, Vol. 120, 2015, p. 4-13.
-
Xie S. B., Qu J. J., Lai Y. M., Pang Y. J. Formation mechanism and suitable controlling pattern of sand hazards at Honglianghe River section of Qinghai-Tibet Railway. Nat Hazards, Vol. 76, 2015, p. 855-871.
-
Domaneschi M., Martinelli L., Po E. Control of wind buffeting vibrations in a suspension bridge by TMD: hybridization and robustness issues. Computers and Structures, Vol. 155, 2015, p. 3-17.
-
Waston S. C., Stafford D. Cable in trouble. Civil Engineering, ASCE, Vol. 4, 1988, p. 38-41.
-
Li C. X., Tang X. S., Xiang G. B. Fatigue crack growth of cable steel wires in a suspension bridge: multiscaling and mesoscopic fracture mechanics. Theoretical and Applied Fracture Mechanics, Vol. 53, 2010, p. 113-126.
-
Cremona C. A short note on cable fatigue. Proceedings of the 5th International Symposium on Cable Dynamics, Santa Margherita Ligure, Vol. 15, Issue 18, 2003, p. 295-302.
-
Qiu W. L., Jiang M., Zhang Z. Nonlinear dynamic responses of suspension bridge to sudden breakage of hangers. Journal of Physics Conference Series, Vol. 628, 2015, p. 1-7.
-
Shao Y. H., Zhao L., Ge Y. J., Ke S. T. Wind-induced dynamic stress estimation method for bridge elements utilizing linear regression algorithm. Journal of the Harbin Institute of Technology, Vol. 43, Issue 4, 2011, p. 88-93.
-
Zeng Y., Chen A. R., Tang H. M. Fatigue assessment of hanger wires of suspension bridges in its operation life based on in-situ traffic flow. Journal of Disaster Prevention and Mitigation Engineering, Vol. 34, Issue 2, 2014, p. 185-191.
-
Gjelstrup H., Georgakis C. T., Larsen A. An evaluation of iced bridge hanger vibrations through wind tunnel testing and quasi-steady theory. Wind and Structure, Vol. 15, Issue 5, 2012, p. 385-407.
-
Demartino C., Koss H. H., Georgakis C. T., Ricciardelli F. Effects of ice accretion on the aerodynamics of bridge cables. Journal of Wind Engineering and Industrial Aerodynamics, Vol. 138, 2015, p. 98-199.
-
Zhan H., Fang T., Zhang Z. G. Vortex-induced vibration studies of arch bridge hanger by CFD numerical simulation. International Association for Wind Engineering (IAWE), 2013.
-
Bai L., Liu K. Research on vortex-induced vibration behavior of steel arch bridge hanger. Applied Mechanics and Materials, Vol. 137, 2011, p. 429-434.
-
Simiu E., Scanlan R. H. Wind Effects on Structure – Fundamentals and Applications to Design Third Edition. A Wiley – Interscience Publication John Wiley and Sons, Inc., 1996, p. 474-479.
-
MacDonalda J. H. G., Larose G. L. A unified approach to aerodynamic damping and drag/lift instabilities, and its application to dry inclined cable galloping. Journal of Fluids and Structures, Vol. 22, 2006, p. 229-252.
-
Lam K., Li J. Y., So R. M. C. Force coefficients and Strouhal numbers of four cylinders in cross flow. Journal of Fluids and Structures, Vol. 18, 2003, p. 305-324.
-
Wind Resistance Design Specification for Highway Bridges. (JTG/T D60-01-2004), 2004, (in Chinese).
-
Zhang M. Numerical Simulation of Wind-Blown-Sand Two Phase Flow Field Around the Building Based on Fluent. Master’s Thesis of Harbin Institute of Technology, 2008, (in Chinese).
About this article
The authors are grateful for the financial support from the National Natural Science Foundation of China (51208471), Natural Science Foundation of Henan Province of China (162300410255), Outstanding Young Talent Research Fund of Zhengzhou University (1421322059) and Science and Technology Planning Project of Transportation in Henan Province (2016Y2-2).
