Abstract
This study analyzes the necessity, development, and principles of aero-engine electrostatic monitoring technology. An electrostatic sensor with specific size is assembled in the exhaust nozzle of an RB-211 turbofan engine located near the low-pressure turbine outlet, a stress checking procedure for safety is conducted. Two test program cycles are included in the whole experimental process. Electrostatic signal processing flow is presented, and feature parameters used for analysis are root-mean-square (RMS), activity level (AL), negative event rate (NER), positive event rate (PER), kurtosis, impulse factor, and absolute mean value. Thrust is used to parameterize the working conditions of the turbofan engine. Moreover, data fitting is conducted to determine the relations between feature and performance parameters. Accordingly, lubrication oil leakage fault and fuel-rich combustion condition are detected in two test run cycles, which result in the appearance of abnormal signals. The AL, RMS, and absolute mean values exhibit similar trends with the change in thrust. A positive linear correlation is also observed between the AL and the thrust in the varying thrust test period. The method of blade-casing rubbing fault recognition is discussed. Experiment results show that the electrostatic sensor is very sensitive to large-sized charged particles in the exhaust emissions.
1. Introduction
An aero-engine is a core component of an aircraft that provides power. Therefore, on-line health monitoring for aero-engines is very important to ensure reliability and safety in aircraft flight. Aero-engine health monitoring is also a fundamental research field for the implementation of the prognostics and health management (PHM) for such engines [1, 2]. Researches showed that the gas path component faults account for more than 90 % of aero-engine faults. These faults are caused by gas path components working in harsh environments with high temperature and pressure, which can easily lead to failure or potential failure in critical gas path components [3, 4].
The security, economy, and reliability in aero-engine operation are significant. Therefore, a new kind of monitoring technology that can forecast gas path component faults is urgently required to cope with the trend of intelligent monitoring and transform the mode of maintenance from time-based to condition-based. The traditional on-line monitoring technology for aero-engines mainly includes vibration and performance parameter monitoring. However, this kind of technology cannot provide early warnings for gas path component faults [5-7]. Only when a component has a certain fault or comes close to the failure threshold can the fault symptom be identified from the signal.
Electrostatic monitoring became a hotspot in the engine condition monitoring field in the 1970s because this technology has the capacity for early fault warnings. The symptoms can be captured in monitoring signals when some typical gas path component faults are still in the early period and difficult to detect by traditional monitoring methods, such as performance degradation, blade case rubbing, carbon deposition, and abnormal burning [8, 9]. The electrostatic monitoring technology principle is to forecast faults and assess health conditions for gas path components by monitoring the electrostatic charge level of exhaust in the aero-engine [10]. This kind of technology is also a new monitoring method that can be used in engine health management (EHM).
An increasing amount of literature on the methodologies, applications, and experiments of the electrostatic monitoring technology has been presented in the recent years. Varazhin et al. [11-16] presented the theoretical method, laboratory modeling and simulation of electrostatic monitoring for engine in his studies. The electrostatic monitoring technology was also used in engine diagnostics through monitoring the overall electrostatic charge level. Considering the great potential value of electrostatic monitoring, Powrie et al. [17-20] proposed to apply this technology in the PHM system of aero-engines. Fisher et al. [5] conducted an on-line monitoring experiment on gas path debris using electrostatic sensors. They reported that the electrostatic monitoring technology will be an important PHM tool. The inlet debris monitoring system (IDMS) and exhaust debris monitoring system (EDMS), which use the electrostatic monitoring technology, were also developed and applied to a certain type of joint-fighter. Wilcox et al. [21] investigated the application in industrial gas turbines for gas path condition monitoring and discussed the sensor installation issues. Addabbo et al. [33, 34] presented a theoretical modeling of an electrostatic gas path debris detection system and finished an experimental validation.
A similar research was conducted by the RMS Center of Nanjing University of Aeronautics and Astronautics in China. Wen et al. [22, 23] optimized the electrostatic sensor design and conducted a simulated experimental study with a simulation testbed. Li et al. [24, 25] conducted a verified electrostatic monitoring experiment on a certain type of turboshaft engine. Accordingly, they found a blade case rubbing fault. Sun et al. [26] proposed model construction for an electrostatic signal baseline using data from another monitoring experiment. Liu et al. [27-29] conducted an experimental research on electrostatic monitoring for small turbine jet engine. They detected abnormal phenomena caused by lubrication oil leakage and carbon deposition faults. Electrostatic monitoring has been used in the Joint Strike Fighter program for many years. Furthermore, some related experiments have been conducted. However, most of the studies focused on the electrostatic sensor. A systematic experimental study conducted for on-board experimentation has not been reported. Researchers only carried out several exploratory experiments for small turbojet engines and turboshaft engines, with non-exhaustive data analyses in which engine performance parameters are ignored.
Similar to military aero-engines, gas path component faults are a common turbofan aero-engine fault type. Turbofan engine is the most widely used engine worldwide, and thus keeping the engines operating in optimal condition is important for flight safety. Therefore, electrostatic monitoring technology has a very broad application prospect in the civil aviation turbofan engines. Interestingly, studies on application or experiments on the electrostatic monitoring for the civil aviation turbofan engine have not been reported, probably due to various reasons. First, conducting an on-board experiment on turbofan engines is very difficult. Currently, all kinds of monitoring sensors installed on turbofan engines are predetermined; therefore, finding a solution for electrostatic sensor installation is difficult. A reasonable and effective method to install and design specific sensors is necessary. In previous studies, electrostatic sensors are just fixed onto iron frames and placed behind the exhaust nozzle of the engine. Such method cannot ensure that the sensor can acquire accurate electrostatic signals from the exhaust. Second, turbofan engines employ time-based maintenance mode, which leads to a very high usage rate and a heavy operating cost for airlines. Conducting a specific experiment on turbofan engines will change the engine use plan and increase the cost to the airline companies, and thus airlines would not accept unscheduled experiments on their engines. For the same reason, original equipment manufacturers also would not change the integral test program for experiments, thereby limiting the opportunity to carry out on-board experiments. Hence, we negotiated with the Beijing AMECO engine maintenance company and obtained a valuable opportunity to carry out on-board experiments during a RB-211 engine test program period.
In this study, an electrostatic monitoring experiment was conducted on the civil aviation turbofan engine, which has never been studied. The feasibility of applying electrostatic monitoring for the turbofan engine has been verified; therefore, information gaps in this field will be filled. The electrostatic sensor used in this study is specifically designed and assembled on the exhaust nozzle behind the low-pressure turbine. Important physical factors were considered, such as physical size, shielding, insulation, and heat insulation performance of the sensor. A total embedded electrostatic sensor installation was implemented. Consequently, the real electrostatic charge level of exhaust could be reflected more accurately from the original signals, and therefore engine performance parameters are used in data analysis to improve the reliability of results. The results revealed that several characteristic parameters are very sensitive to certain fault and correlated with engine performance. This study provides data support and an experimental basis for building an on-board gas path electrostatic monitoring system for fault diagnosis and performance assessment of turbofan engines.
2. Principle of gas path electrostatic monitoring and system introduction
Fig. 1 shows the electrostatic monitoring technology principle based on the measurement of the charged particles that existed in the exhaust gas. Engine exhaust contains a large amount of charged particles, called soot particles. Soot particles can be generated from the combustion chamber or by faults developed in aero-engine gas path components (e.g., blade case rubbing, abnormal combustion will lead to the generation of abnormally charged particles) [30, 31]. Electron transfer happens on the sensor probe surface when charged particles pass the electrostatic sensor probe assembled in the exhaust nozzle and when the charged particle-induced electrostatic field is around the electrostatic sensor probe. Consequently, an induced current is generated as the output and transformed into an induced voltage through the measurement circuit.
Fig. 1Electrostatic monitoring technology principle
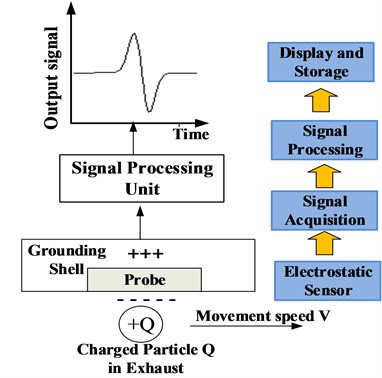
Fig. 2 illustrates the physical sensing model of electrostatic monitoring. Most of the soot particles in the engine exhaust have regular sizes and carry few charges when the aero-engine combustion chamber operates in a normal working condition. These soot particles become bigger and carry more charges once the combustion chamber operates in an abnormal condition or any mechanical faults occur in the gas path components. This situation happens because of the strengthened friction and electron absorption. Consequently, the electrostatic sensor may output an abnormal signal with high amplitude. Faults can then be identified on that occasion, and the engine health condition can be assessed by extracting the abnormal signal.
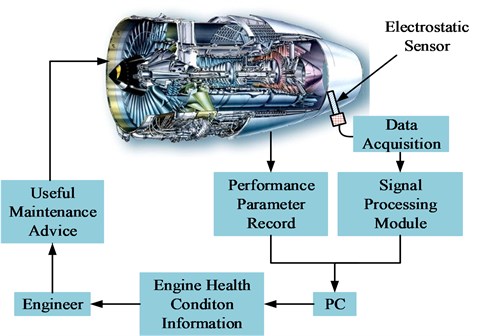
The electrostatic signal is transferred to the signal processing module for deeper processing after signal conditioning. The analysis of waveform and signal feature parameters indicates that the maintenance personnel could assess the health of an aero engine, which can help them detect potential faults occurring in the components or evaluate the engine degradation degree. The analysis also provides an early fault warning and helps engineers make a better maintenance decision for the aero-engine. In that case, this technology may help airlines maintain the balance between cost and safety. Fig. 3 shows the typical electrostatic monitoring system framework.
Fig. 2Physical sensing model of the electrostatic sensor
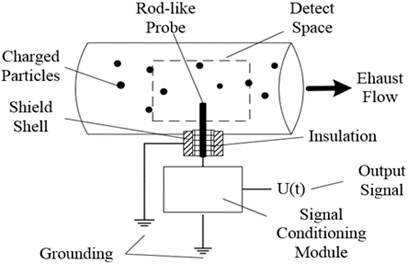
Fig. 3Typical electrostatic monitoring system framework
3. Introduction of the electrostatic sensor and the test run program
3.1. Electrostatic sensor
The electrostatic sensor has a rod-like probe installed in the inner space of the exhaust nozzle. Fig. 4 presents a photographic view of the sensor. The probe made of nickel-based alloy has good thermal stability and electrical conductivity. The shell is made of stainless steel and has a good effect on heat insulation and electromagnetic shielding. The insulator made of ceramic can tolerate high temperature and protect the internal shell circuit.
3.2. Stress checking for sensor assembling
As the air velocity of engine exhaust is extremely high, it will lead to great bending stress generated on electrostatic sensor. In order to make sure that the sensor can work in normal condition and bear the bending stress in the high speed exhaust air flow and high pressure exhaust environment, stress checking for the sensor should be conducted before assembling. In the processing of test run, the max velocity of exhaust air flow is about 800 m/s. The prober of sensor is made of nickel-based alloy, the bending strength of nickel-based alloy is 965 MPa. A Stress calculation model was built and shown in Fig. 5, sensor can be considered reliable when the max stress is lower than the max affordable stress.
Fig. 4Photographic view of the electrostatic sensor
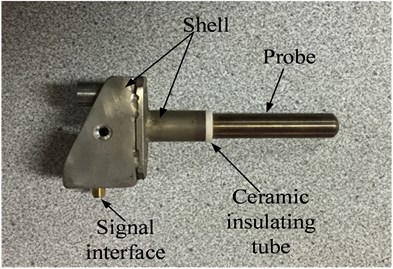
Fig. 5Stress calculation model of electrostatic sensor
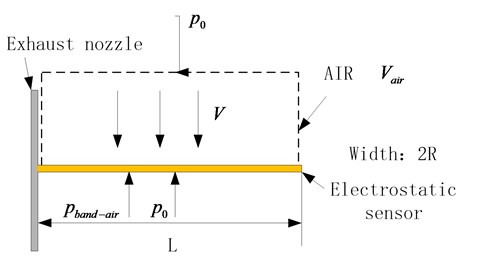
Assumes that the exhaust gas is the ideal gas, regardless of the gravity, the stress analysis equation can be established by Bernoulli equation:
where is the static air pressure, is the air density, is the velocity of exhaust air flow, is the uniform load. We can know that:
where is the total pressure on sensor, is the radius of sensor probe, is the length of sensor probe.
The max bending moment on the probe is presented as follows:
Values of parameters are: 800 m/s, 1.2 kg/m3, 0.005 m, 0.2 m, the max bending moment is as follows:
So, the max bending strength can be calculated as follows:
We can draw a conclusion that the electrostatic sensor can meet the safety demand of monitoring and keep normal shape.
3.3. Signal acquisition instruments and signal processing flow
In this experiment, the signal acquisition instruments contain a metal-shielded cable, a NI-9234 data acquisition card, a signal processing unit, and a PC. The metal-shielded cable has three shielding layers made of copper mesh, and the outside insulation is made of a special Teflon material. It has good heat resistance, electrical conductivity, and noise-shielding capacities. The NI-9234 is a 4-channel C Series dynamic signal acquisition module for making high-accuracy audio frequency measurements from integrated electronic piezoelectric (IEPE) and non-IEPE sensors with NI Compact DAQ or Compact RIO systems. The NI 9234 delivers 102 dB of dynamic range and incorporates software-selectable AC/DC coupling and IEPE signal conditioning for accelerometers and microphones. The four input channels simultaneously digitize signals at rates up to 51.2 kHz per channel with built-in anti-aliasing filters that automatically adjust to sampling rate. The signal processing unit is an active filter, which can filter out high-frequency noise and amplify signal to a certain extent. The PC is an ordinary laptop, which was used to control the acquisition software (i.e., NI-Labview) and store the data.
Normally, the real-time electrostatic signal usually contains the following features: (1) the strong DC component (2) high frequency noise interference (3) internal noise from sensors, monitoring equipment and cable monitoring system. In view of the features mentioned above, a whole signal processing flow is need to be established after acquisition of the signal data, it’s the basis of the further data analysis and feature extraction for electrostatic signal. As there are many methods about the electrostatic signal processing in previous research, we would not discussed in detail in this paper. A complete set of electrostatic signal processing flow chart is shown in Fig. 6.
Fig. 6Systematic flow of electrostatic signal processing

3.4. Introduction of the engine test run
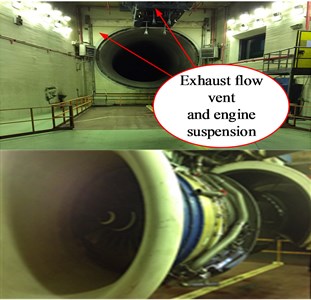
The aero-engine type used in the test is the RB211 turbofan engine manufactured by Rolls-Royce. The sub-type is 535E, which is a three-spool turbofan engine. The test run program is conducted in the maintenance workshop. Fig. 7 illustrates the experiment site.
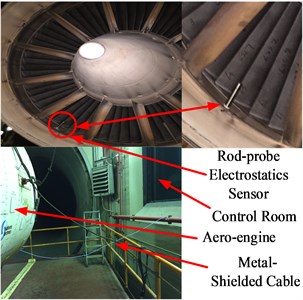
Fig. 7 presents the electrostatic sensor installation. The probe is installed behind the low-pressure turbine, is about 30 cm away from the blades, and points to the geometric center of the engine exhaust nozzle. The signal transmission is easily affected by the special environment in the test workshop. Therefore, the signal cable should have good heat resistance, electrical conductivity, and shielding noise capacities. The cable connects the sensor interface with the acquisition system to transfer the electrostatic signal. The signal data are stored in the database after the analog-digital conversion. To a certain extent, the metal engine casing could help the sensor shield electromagnetic interference, which may cause noise increase in the signal, because the probe is complete in the inner space of the exhaust nozzle. The sampling frequency for the signal acquisition is 2000 Hz. The performance parameters of the turbofan engine are recorded with a 20 Hz sampling frequency. A complete test circle lasts for 63 min. This test circle already contains all performance test stages, including the run-in, vibration and balance, varying thrust, and accelerating and decelerating tests.
Fig. 7Experiment site of the engine test: a) engine suspension and b) electrostatic sensor installation and connection in the aero-engine
a)
b)
3.5. Performance parameters and test run program
Table 1 lists different performance parameters of RB-211 turbofan engine.
Table 1Performance parameters of RB-211 turbofan engine
Performance parameter | Code | Unit |
Throttle lever angle | PLAshow | Deg |
Thrust | Xn | lbs |
High pressure rotor speed | N3 | % |
Intermediate pressure rotor speed | N2 | % |
Low pressure rotor speed | N1 | % |
Vibration overall | Vib | IPS |
Lubricating oil pressure | ODP | PSID |
Lubricating oil temperature | QMOT | DegC |
Lubricating oil flow | QOilQ | Gal |
Fuel flow | FF | PPH |
Engine pressure ratio | EPR | 1 |
Intermediate pressure compressor outlet temperature | T247 | DegC |
High pressure compressor outlet temperature | T300L | DegC |
Intermediate pressure compressor outlet pressure | P247 | PSIG |
High pressure compressor outlet pressure | S330P | PSIG |
Chamber inlet pressure | P4 | PSI |
Low pressure turbine outlet pressure | PEP2 | PSI |
Exhaust gas temperature | EGT | DegC |
The performance parameters can be divided into four kinds as follows: (1) working state parameters, which reflect the working state of the turbofan engine, including throttle lever angle, thrust, and high-, intermediate-, and low-pressure rotor speed; (2) vibration parameters; (3) lubricating oil parameters; and (4) gas path state parameters, which reflect the working environment of the gas path, including fuel flow, engine pressure ratio, intermediate-pressure compressor outlet temperature, high-pressure compressor outlet temperature, intermediate-pressure compressor outlet pressure, high-pressure compressor outlet pressure, chamber inlet pressure, low-pressure turbine outlet pressure, and exhaust gas temperature. Fig. 8 labels the different test program stages.
Fig. 8RB-211 aero-engine test program
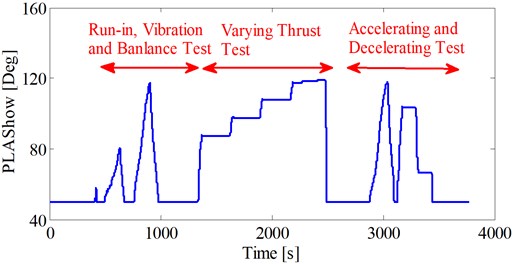
The signal acquisition system is turned on when the turbofan engine steps in the test program. The test program cycle lasts for 63 min with 63 data sets containing the whole electrostatic signal acquired in all stages. The varying electrostatic signal trend can be visualized by analyzing these data sets while the engine operates in different working conditions. Some feature parameters can be calculated and compared with the performance and gas path state parameters, which can help determine the correlation between engine performance and electrostatic signal. The features, such as mean value, root-mean-square (), active level (), event rate (), kurtosis and impulse factor are generally calculated using the statistical method.
4. Feature parameters of the electrostatic signal
4.1. Mean value and RMS
The feature parameters of the electrostatic signal are important in data analysis and fault diagnosis. The original electrostatic signal is the voltage signal, which directly reflects the electrostatic level changes in the aero-engine gas path. The abnormal points may instantly appear in the original signal once a gas path component fault appears. The absolute mean value and the can first be calculated as the basic characterization parameters because they are more sensitive to abnormal conditions [32]. The calculation formulae of the absolute mean value () and the () are presented as follows:
where is the length of the signal data points, and is the value of each point.
4.2. Active level and event rate
The absolute mean and values can be used to describe the signal amplitudes and waveform. Some fundamental signal information can then be obtained from these two parameters. However, identifying whether the gas path components have some certain faults according to these two parameters is not easy. Using some other feature parameters to obtain more information and detect gas path faults is better. Some specific and useful features are presented to identify abnormal working conditions, such as and . The contains Positive Event Rate () and Negative Event Rate () [20]. The active level is defined as follows:
where is the charge data, which is calculated from the voltage data. denotes length, which usually uses the signal length of about 1 s. is the data series with discrete data points from . is the quantity of . is the level of the charge in the process of monitoring. It is derived from the value of the charge signal. Charges inducted by the charged particles in the exhaust gas also exist. These charges enter the sensitive space of the electrostatic sensor within a certain time. The unit used for the is Coulomb.
The relates to the number of larger particles existing in the exhaust gas per unit time. Events typically include carbon particles and larger debris from faults. These events are separated into positive and negative events according to polarity and amplitude, which provide further information on the engine condition. The can be computed as follows:
where is the number of samples in for which . is a constant (typically 2, 3, 4, 5….) obtained from a large number of experimental and statistical data. is set as 2 in this study. is the total number of samples in a unit time. Previous studies have revealed that the is higher than the when the number of metal particles increases in the exhaust [29]. Conversely, the is higher than the when most of the particles in the exhaust are non-metallic. The unit used for the and the is percentage.
5. Experiment results
5.1. Typical signal in low-power condition
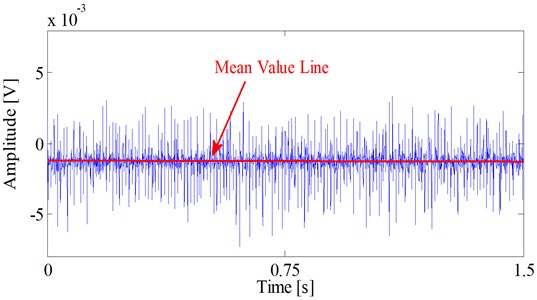
Fig. 9 shows the typical signal when the engine works in a low-power condition. The normal signal is in the millivolt level, which suggests that the electrostatic signal is a weak signal. Moreover, the electrostatic sensor is very sensitive to the electrostatic charges in the exhaust.
Fig. 9 shows that the mean value of electrostatic signal has a tendency to deviate from zero axis to negative because the exhaust gas contains more non-metallic particles when the engine power increases and the non-metallic particles carry negative polarity charges leading to mean value line migration.
Fig. 9Typical electrostatic signal in a low-power condition
5.2. Contrastive analysis based on electrostatic feature parameters and performance parameters
5.2.1. Correlation of performance parameters
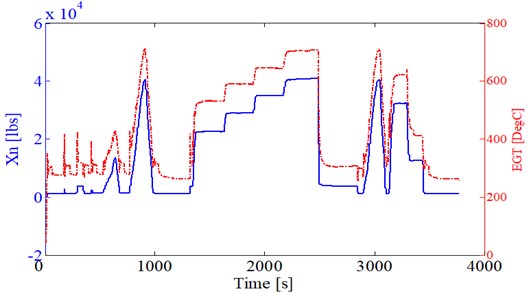
This study uses thrust () and EGT to illustrate the test program. Fig. 10 shows an obvious correlation between these two typical parameters. From a statistical perspective, the correlation coefficient of these two parameters is calculated using the follow formula:
where is the covariance of and . and are the standard deviations of and . The correlation coefficient 0.9910 is then obtained. A more intensive research is conducted by selecting thrust as a fitting parameter because it has good index to represent the output power.
Fig. 10Varying of thrust and EGT in the test program
5.2.2. Contrastive analysis based on thrust and feature parameters
The test program cost 63 minutes, there are 63 data sets in total. To compare with engine thrust, absolute mean value, , and value is calculated and plotted in Fig. 11 after data normalizing. Above parameters are calculated every 2000 points (in 1 second) after merging all data sets.
Fig. 11 shows that the electrostatic signal level and the engine thrust are closely related. The has the most similar trend with the engine thrust. The value gradually increases stepwise as a response of the engine thrust varying during the thrust varying test. One can obtain the following conclusions in view of time domain: the electrostatic signal level and the engine output power are closely related; and the electrostatic signal level increases when the turbofan engine output has more power. Fig. 11 further indicates that the and the absolute mean value exhibit similar trends with the change in thrust. Thorough analysis illustrates that the phenomenon may have been caused by various reasons. First, the fuel flow increases when the output power increases. More fuel burns in the combustion chamber, which leads to an increase in the number and the concentration of charged particles in the exhaust emission. Consequently, the electrostatic level gradually increases. The exhaust flow speed also becomes faster when the engine works under high-power condition. The high-speed exhaust flow enhances the friction effect between gas and particles, which leads to soot particles absorbing more charges. The high-temperature environment may also enable particles to carry more charges. Accordingly, the first scenario is considered as the main reason.
Fig. 11Thrust, absolute mean value, RMS, and AL after normalization
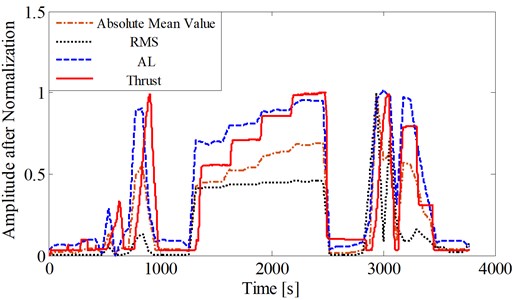
For further research, the correlation coefficients between the thrust and the other three parameters are computed using MATLAB software. Table 2 shows the results. is the correlation coefficient between the thrust and the . is the correlation coefficient between the thrust and the . is the correlation coefficient between the thrust and the absolute mean value. Table 2 demonstrates that the is the most sensitive parameter that reflects the engine working condition.
Table 2Different correlation coefficient.
0.6809 | 0.9132 | 0.8756 |
Some of the following useful conclusions can be drawn from the abovementioned analysis: (1) the feature parameters (i.e., absolute mean value, , and can reflect the working conditions of the turbofan engine, and the feature parameter trends are closely related with the engine performance parameters (i.e., thrust); and (2) the value is the most useful feature parameter that could reflect the engine working condition because the is not sensitive enough to reflect the varying working conditions.
5.2.3. Mathematical relations between the thrust and the other feature parameters
The data sets acquired in the varying thrust test are analyzed according to the test program record. Fig. 12 shows the four different stages of the varying thrust test. The corresponding data sets of the varying thrust test are from 23 min to 42 min. Each stage contains five data sets. The thrust, , and absolute mean value averages of each stage are calculated and serve as the fitting parameters in curve fitting. Table 3 shows the result.
Fig. 12Average thrust of different stages
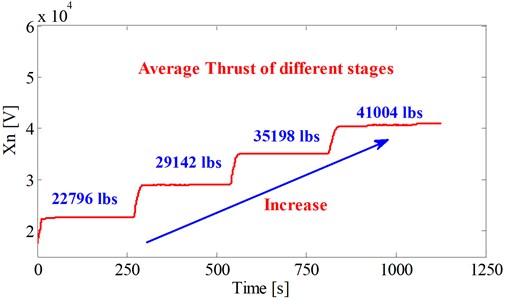
Table 3Thrust, absolute mean value, and AL in different stages
Level | Average thrust (lbs) | Absolute mean value (mV) | Average (pC) |
Stage 1 | 22796 | 3.51 | 2.22 |
Stage 2 | 29142 | 4.12 | 2.73 |
Stage 3 | 35198 | 4.52 | 3.11 |
Stage 4 | 41004 | 4.85 | 3.47 |
The average and absolute mean values both increase during the thrust varying test following the thrust increase. Data fitting is conducted to analyze the mathematical correlation between the abovementioned parameters.
Fig. 13Fitting result of the average thrust and absolute mean value
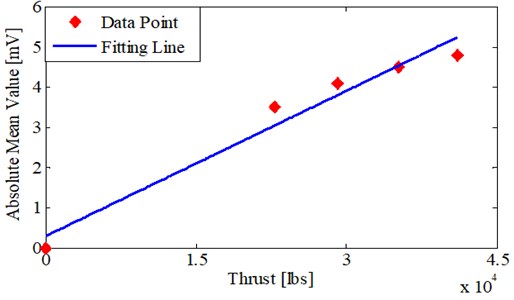
Fig. 13 shows the fitting result of the average thrust and absolute mean values. The fitting formula with 95 % confidence interval is presented as follows:
where is the absolute mean value, and the unit used is millivolts (mV). is the average thrust with pound (lbs) used as the unit. The fitting correlation coefficient is 0.9623.
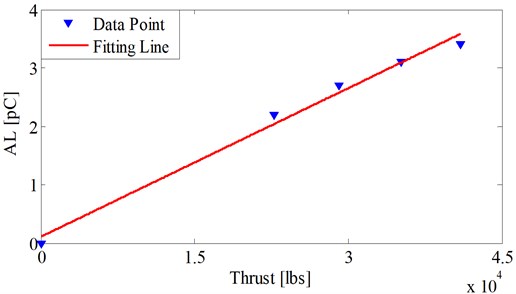
Fig. 14 shows the fitting result of the AL and absolute mean value. The fitting formula with 95 % confidence interval is presented as follows:
where the unit used for the is pico-coulombs (pC). The fitting correlation coefficient is 0.9883. The figures indicate the occurrence of a positive and linear correlation between the and the engine thrust, which is similar to the absolute mean value and the thrust.
Fig. 14Fitting result of average thrust and AL value
5.3. Electrostatic monitoring for the abnormal phenomenon in aero-engine
5.3.1. Monitoring for lubrication oil leakage fault
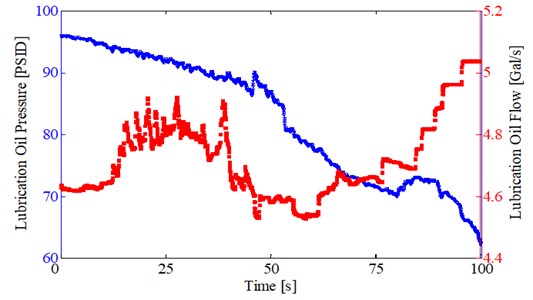
A lubrication oil system fault has been detected in the low-output power stage process of the second test program. Fig. 15 shows the abnormal trend of the lubricating oil pressure (ODP) and the lubricating oil flow (QOilQ) parameters when the fault happened. The figure presents that the ODP quickly decreases, whereas the QOilQ quickly increases. Engineers confirm the existence of a lubrication oil leakage fault by analyzing the lubrication oil parameters and observing videos and images from a camera. Some abnormal points also appear in the original electrostatic signal (Fig. 16). This observation has been obtained because the leakage oil leaked into the engine combustion chamber and burned, thereby leading to the increase of the charged soot particles in the exhaust emissions. However, the original signal is not obvious enough to detect the fault and judge the working conditions.
Fig. 15Abnormal lubricating oil pressure and lubricating oil flow during the fault period
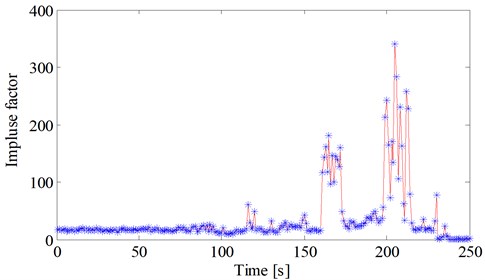
Further analysis is conducted by calculating the , , kurtosis and impulse factor (Figs. 17-20). As we known, the kurtosis and impulse factor are very sensitive to pulse signal and early pulse fault. Obviously, oil leakage fault belongs to pulse fault. The computational formulas of kurtosis and impulse factor are presented as follows:
where is the value of each point, u is the mean value of the signal sample, is the absolute mean value of the signal sample. Considering that the kurtosis and impulse factor are often used to detect early pulse fault, we think it is reasonable that these two parameters are selected as monitoring indicators to diagnose faults combined with other performance parameters.
Fig. 16Abnormal electrostatic signal appearing during the fault period
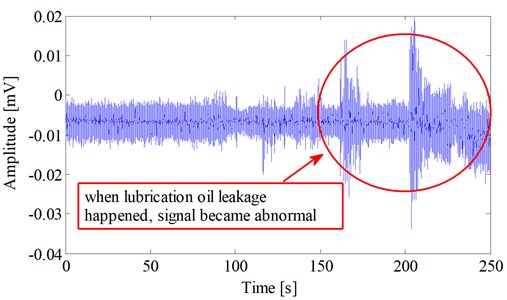
The RMS becomes more active from approximately the 100th second during the fault period. The also suddenly increases until approximately the 200th second. The is considered more sensitive to the oil leakage fault than the because the latter is usually used to measure the continuous nonstandard signal. Only a little oil has leaked into the combustion chamber and burned. However, a large amount of leakage oil would leak into the combustion chamber if the fault increases. This event leads to a large surge in the charged soot particle quantity. Fig. 19 and 20 show the kurtosis and impulse factor values during the oil leakage fault period, and we can find that it is very interesting that kurtosis and impulse factor are acutely sensitive to oil leakage fault in this experiment. Under normal working conditions, is approximately 5 and is approximately 10. When the oil leakage fault occurred, many nonstandard points appeared. can even reach 30-40 and can reach 150-350, which are higher than the normal values. Evidently, these two parameters exhibit similar trends with the original electrostatic signal.
Fig. 17RMS during the fault period
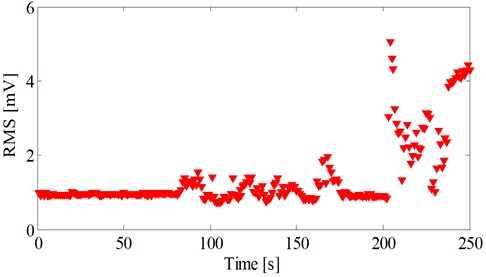
Fig. 18AL during the fault period
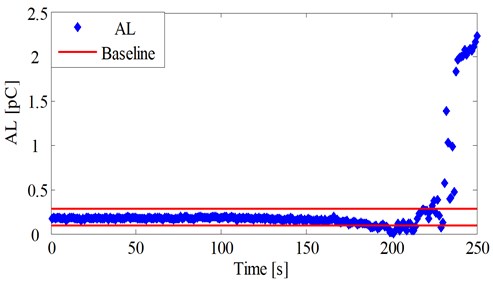
Fig. 19Kurtosis during the fault period
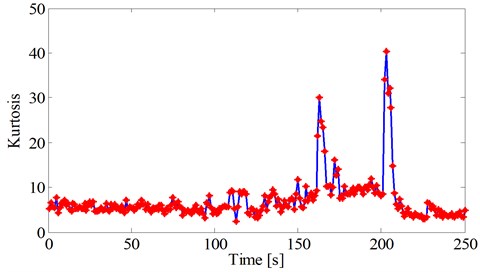
Fig. 20Impulse factor during the fault period
5.3.2. Fuel-rich combustion phenomenon monitoring
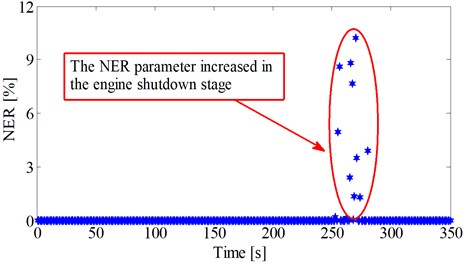
Abnormal points with large amplitudes re-appear in the original signal during the shut-down stage of the second test program (Fig. 21). The amplitude peak can reach 0.5-1.0 V. Figs. 22-24 show the , , , and calculations.
Figs. 22 and 23 show that the is about 0.0011 nC (1 nC = 1000 pC) under the normal working condition. The can reach 0.014 nC (14 pC) during the shut-down stage, which is almost 14 times its normal value. The rapidly increases as well. Figs. 24 and 25 show that the and the also increase during the engine shut-down stage. The quantity of the abnormal points in the is larger than the ’s abnormal points. The highest parameter point can reach 10 %, which indicates the presence of many non-metallic, large-sized particles in the exhaust. This result is reasonable because the mechanical fault did not happen in the gas path component. Therefore, almost no metal particles are observed in the exhaust.
Fig. 21Abnormal electrostatic signal during the fuel-rich combustion period
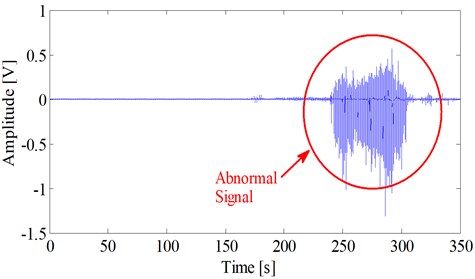
Fig. 22AL and baseline during the fuel-rich combustion period
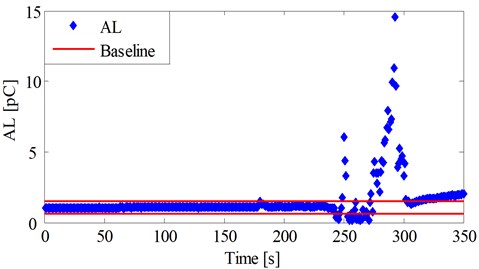
Fig. 23RMS during the fuel-rich combustion n period
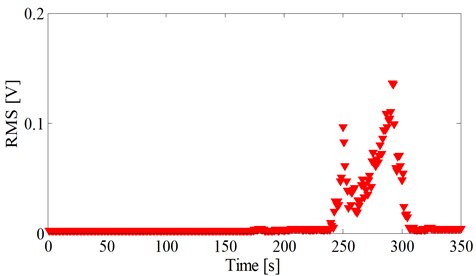
The analysis conducted with regards to this abnormal phenomenon concludes that the turbine, compressor, and combustion chamber operate in a low-power working condition during the power shut-down stage. However, the fuel nozzle still sprays a certain amount of fuel droplets into the combustion chamber. The fuel droplets cannot completely burn in the shut-down stage, which may lead to a fuel-rich combustion. Many small unburned fuel droplets are taken into the gas path through gas flow. These fuel droplets also pass by the electrostatic sensor. The large-sized soot particles are easily generated under the fuel-rich combustion condition. The two previously mentioned reasons result in the abnormal signal during the power shut-down stage. An engineer entered the test workshop and conducted a visual inspection of the RB-211 turbofan engine when the engine stopped operating. A large quantity of fuel droplets is then found to adhere to the inner wall of the exhaust nozzle. This phenomenon proves that the analysis is correct.
Fig. 24PER during the fuel-rich combustion period
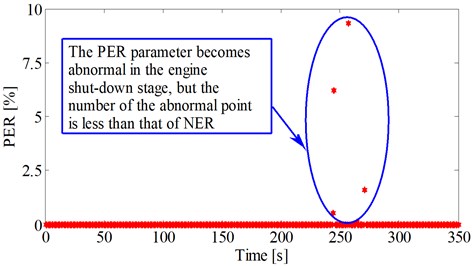
Fig. 25NER during the fuel-rich combustion period
5.3.3. Research on rubbing fault recognition
Actually, it is difficult to have an opportunity to carry out an on-board experiment on civil aero-engine, some typical gas path faults don’t occur in one experiment only. Blade-casing rubbing fault is a kind of typical gas-path fault, but it didn’t occur in this experiment. In order to lay the foundation of subsequent on-board monitoring experiments and recognition for rubbing fault, the signal waveform feature when rubbing fault occurred is analyzed based on the fault mechanism in this section. Moreover, the method of rubbing fault recognition is discussed.
When rubbing fault occurred in the engine, severe friction existed between the blade and the casing seal. The severe friction will generate some charging particles which peeling from the materials of casing seal, these charging particles are emitted with the exhaust and improve the level of electrostatic in the exhaust, which can be monitored by the electrostatic sensors. Generally, the rotating machinery rotates with a certain period, it leads that the rubbing fault is a kind of periodic fault and the charging particles pass the sensors with a period. Some periodic pulse will appear in the electrostatic signal which contains the frequency information of rubbing fault. In addition, the of signal will rise at the same time. The schematic diagram of the abnormal signal when rubbing fault occurred is shown in Fig. 26.
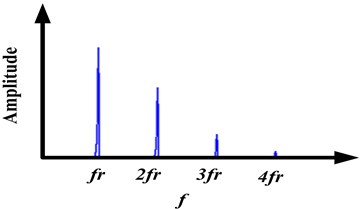
Assumes that the charging particles pass the sensor with period , it will cause periodic pulse in the time domain of signal. is the rubbing period and is the rubbing frequency, where . Periodic signal spectrum is discrete, and the harmonic component of signal distribute in the frequency domian with a certain interval () and attenuate gradually. We can analyze the frequency domain of abnormal electrostatic signal according to this point. When the time domain waveform of signal and the spectrogram of signal are similar to Fig. 26 and Fig. 27, and the parameter rises to an abnormal level, it indicates that a rubbing fault may occurred in engine.
Fig. 26Schematic diagram of the abnormal signal when rubbing fault occurred
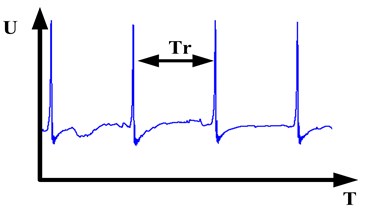
Fig. 27Schematic diagram of signal spectrogram when rubbing fault occurred
6. Conclusions
This on-board electrostatic monitoring experiment for the civil aviation turbofan engine is conducted by using an electrostatic sensor designed with a specific size, a stress checking procedure for safety is carried out before assembling. This study confirmed the feasibility of applying electrostatic monitoring technology for turbofan engine. Conclusions are given as below:
1) The mean value of electrostatic signal has a tendency to deviate in the negative direction on the amplitude axis when the turbofan engine operates. This deviation is related to the combustion products in the exhaust gas. The exhaust emission products are mainly composed of non-metallic soot particles if no mechanical faults are found in the gas path components of the turbofan engines. Non-metallic particles are generally inclined to carry negative polarity charges.
2) The electrostatic signal amplitude is maintained in the millivolt level when the turbofan engine operates under a normal working condition. The results of the data analysis show that the signal amplitude level increases when the output power or thrust gradually increases. These two parameters are closely related.
3) Engine performance parameters are used in data analysis to improve the reliability of results. A comparative analysis shows that some of the feature parameters of the electrostatic signal (i.e., , , and absolute mean value) have similar varying trends with the turbofan engine performance parameters (i.e., and thrust). Contrastive analysis for the whole test run cycle is conducted, the results show that the correlation coefficient between absolute mean value and thrust is 0.8756, the correlation coefficient between and thrust is 0.9132 and the correlation coefficient between and thrust is 0.6809. It indicates that the more accurately represents the engine working condition than the other parameters.
4) The lubrication oil leakage fault is detected in the second test program. The lubrication oil parameters and the electrostatic signal become abnormal during the fault period. Accordingly, the lubrication oil has possibly leaked into the gas path, which is the main reason for the signal amplitude increase. The , kurtosis and impulse factor were then calculated. The is more sensitive to the oil leakage fault than the because the latter is usually used to measure a continuous abnormal signal. Kurtosis is approximately 5 and impulse factor is approximately 10 under normal working conditions. During the oil leakage fault period, the kurtosis and impulse factor can even reach the values of 30-40 and 150-350, respectively, which are more than the normal values. Obviously, kurtosis and impulse factor trend similarly with the original electrostatic signal, and they are very suitable to be selected as monitoring indicators for detecting gas path fault.
5) A fuel-rich combustion phenomenon is captured during the shut-down stage of the second test program. As a result, the absolute amplitude greatly increases and reaches more than 1 V. The and the have values of 14 pC and 10 %. Data analysis proves that the electrostatic sensor is very sensitive to large-sized charged particles.
6) Method of rubbing fault recognition is discussed. When periodic pulse appeared in the time domain waveform of signal and periodic harmonic distribute in the spectrogram of signal, moreover, the parameter rises to an abnormal level at the same time, it indicates that a rubbing fault may occurred in aero-engine.
7) This investigation suggests that the electrostatic signal is related to the exhaust emissions. For further study, this relation can be used to measure the exhaust emission concentration by combining the combustion parameters and the formulae for computing combustion products. Future studies could develop a model to estimate the exhaust emissions. This investigation also verifies the feasibility of on-board electrostatic monitoring for turbofan engines, which means that an online gas path fault diagnosis for the turbofan engine based on electrostatic monitoring may be realized.
References
-
Clifton D., Tarassenko L. Condition Monitoring of Gas-Turbine Engines. Transfer Report, Department of Engineering Science, University of Oxford, 2006.
-
Witoś M., Szczepanik R. Turbine engine health/maintenance status monitoring with use of phase-discrete method of blade vibration monitoring. Solid State Phenomena, Vol. 147, 2009, p. 530-541.
-
Bhaumik S., Bhaskaran T., Rangaraju R., Venkataswamy M., Parameswara M., Krishnan R. Failure of turbine rotor blisk of an aircraft engine. Engineering Failure Analysis, Vol. 9, Issue 3, 2002, p. 287-301.
-
Carter T. J. Common failures in gas turbine blades. Engineering Failure Analysis, Vol. 12, Issue 2, 2005, p. 237-247.
-
Novis A., Powrie H. PHM sensor implementation in the real world-a status report. Proceedings of the IEEE Aerospace Conference, MT, USA, 2006, p. 1-9.
-
Haase W. C., Drumm M. J. Detection, discrimination, and real-time tracking of cracks in rotating disks. Proceedings of the International Society for Optics and Photonics on NDE For Health Monitoring and Diagnostics, San Diego, CA, USA, 2002, p. 139-149.
-
Lapini G., Zippo M., Tirone G. The use of electrostatic charge measurements as an early warning of distress in heavy-duty gas turbines. Proceedings of ASME Turbo Expo 2001: Power for Land, Sea, and Air, New Orleans, Louisiana, USA, 2001, p. 34-42.
-
Acton P., Alexander G., Allison J., Allport P., Anderson K., Arcelli S., Ashton P., Astbury A., Axen D., Azuelos G. A study of charged particle multiplicities in hadronic decays of the Z0. Zeitschrift Für Physik C, Vol. 53, 1992, p. 539-554.
-
Couch R. Detecting abnormal turbine engine deterioration using electrostatic methods. Journal of Aircraft, Vol. 15, Issue 10, 1978, p. 692-695.
-
Wen Z., Zuo H., Pecht M. G. Electrostatic monitoring of gas path debris for aero-engines. IEEE Transactions on Reliability, Vol. 60, 2011, p. 33-40.
-
Vatazhin A., Golentsov D., Likhter V., Shulgin V. Aircraft engine state nonobstructive electrostatic monitoring: theoretical and laboratory modelling. Journal of Electrostatic, Vol. 40, Issue 1, 1997, p. 711-716.
-
Vatazhin A., Lebedev A., Likhter V., Shulgin V., Sorokin A. Turbulent air-steam jets with a condensed dispersed phase: theory, experiment, numerical modeling. Journal of Aerosol Science, Vol. 26, Issue 1, 1995, p. 71-93.
-
Vatazhin A., Likhter V., Sepp V., Shul’Gin V. Effect of an electric field on the nitrogen oxide emission and structure of a laminar propane diffusion flame. Fluid Dynamics, Vol. 30, Issue 3, 1995, p. 166-174.
-
Vatazhin A., Starik A., KholshchevnikovaE. Electric charging of soot particles in aircraft engine exhaust plumes. Fluid Dynamics, Vol. 39, Issue 3, 2004, p. 384-392.
-
Vatazhin A., Ulybyshev K. Model of electric current formation in aircraft jet engine ducts. Fluid Dynamics, Vol. 5, 2000, p. 139.
-
Vatazhin A., Ulybyshev K. Diffusion and electrical processes in the turbulent boundary layer and in the neighborhood of the stagnation point. Fluid Dynamics, Vol. 36, Issue 3, 2001, p. 429-436.
-
Fisher C. Gas path debris monitoring – a 21st century PHM tool. Proceedings of the IEEE Aerospace Conference, MT, USA, 2000, p. 441-448.
-
Powrie H., McNicholas K. Gas path condition monitoring during accelerated mission testing of a demonstrator engine. AIAA Paper, 1997, p. 972904.
-
Powrie H., Novis A. Gas path debris monitoring for F-35 joint strike fighter propulsion system PHM. Proceedings of the IEEE Aerospace Conference, MT, USA, 2006, p. 34-41.
-
Powrie H., Wood R., Harvey T., Wang L., Morris S. Electrostatic charge generation associated with machinery component deterioration. Proceedings of the IEEE Aerospace Conference, MT, USA, 2002, p. 2927-2934.
-
Wilcox M., Ransom D., Henry M., Platt J. Engine distress detection in gas turbines with electrostatic sensors. Proceedings of ASME Turbo Expo 2010: Power for Land, Sea, and Air, Glasgow, UK, 2010, p. 39-51.
-
Wen Z., Zuo H., Li Y. Gas path debris electrostatic monitoring technology and experiment. Journal of Aerospace Power, Vol. 12, 2008, p. 2321-2326.
-
Wen Z., Zuo H., Li Y. New method for aero engine gas path monitoring. Journal of Nanjing University of Aeronautics and Astronautics, Vol. 2, Issue 2, 2009, p. 22-33.
-
Li Y., Zuo H., Liu P. Gas path electrostatic monitoring of turbo-shaft engine: an exploratory experiment. Acta Aeronautica Et Astronautica Sinica, Vol. 11, Issue 2, 2010, p. 2174-2181.
-
Li Y., Zuo H., Wen Z. Simulated experiment of aircraft engine gas path debris monitoring technology. Acta Aeronautica et Astronautica Sinica, Vol. 4, Issue 3, 2009, p. 604-607.
-
Sun J., Zuo H., Zhan Z., Wang W., Michael P., Bang Z. Analysis of the influencing factors on the exhaust gas electrostatic monitoring signal of a turbo-shaft engine. Acta Aeronautica et Astronautica Sinica, Vol. 33, Issue 3, 2012, p. 412-420.
-
Fu Y., Zuo H., Cai J., Yin Y. Mean change-point model for aero-engine component faults. Journal of Vibroengineering, Vol. 15, Issue 2, 2013, p. 1627-1633.
-
Fu Y., Zuo H., Liu J., Wen Z., Yin Y. Recognition for change-point of aero-engine components rased on projective transformation. Journal of Information and Technology, Vol. 13, Issue 2, 2014, p. 347-352.
-
Liu P., Zuo H., Sun J., Jiang X., Yu Y. In On-line monitoring of the carbon deposition in combustion chamber of a turbojet engine. Proceedings of the IEEE Prognostics and System Health Management (PHM) Conference, Beijing, China, 2012, p. 1-6.
-
Sorokin A., Arnold F. Electrically charged small soot particles in the exhaust of an aircraft gas-turbine engine combustor: comparison of model and experiment. Atmospheric Environment, Vol. 38, Issue 17, 2004, p. 2611-2618.
-
Sorokin A., Arnold F. Organic positive ions in aircraft gas-turbine engine exhaust. Atmospheric Environment, Vol. 40, Issue 32, 2006, p. 6077-6087.
-
Zhong J., Wong P., Yang Z. Simultaneous-fault diagnosis of gearboxes using probabilistic committee machine. Sensors, Vol. 16, Issue 2, 2016, p. 185-193.
-
Addabbo T., Fort A., Mugnaini M., Rocchi S., Vignoli V., Garbin R. Theoretical modeling of an electrostatic Gas-Path debris detection system with experimental validation. Proceedings of IEEE Sensors Applications Symposium, Zadar, Croatia, 2015, p. 1-5.
-
Addabbo T., Fort A., Garbin R., Mugnaini M., Rocchi S., Vignoli V. Theoretical characterization of a gas path debris detection monitoring system based on electrostatic sensors and charge amplifiers. Measurement, Vol. 64, 2015, p. 138-146.
Cited by
About this article
The work is supported by National Natural Science Foundation of China and the General Administration of Civil Aviation of China jointly funded key Projects (No. 60939003), Graduate Student Scientific Research and Innovation Project of Jiangsu Province (KYLX_0313), Initial Scientific Research Fund (2015QD02S) and Foundation Research Funds for the Central Universities (3122016A004), which are highly appreciated by the authors.
Yibing Yin provided the initial idea, performed the experiments, and wrote the paper. Hongfu Zuo supervised the research, critically reviewed and revised the paper. Jing Cai, Hongsheng Yan and Huijie Mao designed the experiments and analyzed the data. Yu Fu contributed materials and analysis tools.
