Abstract
Feature extraction of vibration signal is the key factor of machine fault diagnosis. This paper proposes a novel method of capturing shock energy based on multi-scale weight evaluation of high definition time-frequency map. Specifically, the proposed method is conducted by the following steps. First, ensemble empirical mode decomposition (EEMD) preprocessor-based Hilbert-Huang Transform (HHT) is applied to the raw signal for high definition time-frequency map acquisition. Second, an original algorithm named multi-scale binary spectrum was applied to extract impulsive energy features with different frequency characteristics. Then weights of energy can be calculated by dimensionality reduction of each binary spectrum and merged by summation after blank processing. Finally, power spectrum of compound weight of energy can reveal characteristic frequency corresponding to specific fault. In this method, the key point is enhancement of frequency spectrum using higher dimension details. The process of multi-scale binarization and weight summation were aligned and the effectiveness is verified by simulated signal processing and actual case of train bearing experiment.
1. Introduction
In the field of fault diagnosis of rolling bearing, method via vibration signal analysis is the most frequent medium. Local damage of bearing generates shocks due to impact and friction. Expression of shocks is a series of impulses with period which relate to the fault frequency. Over the years, several vibration signal processing methods have been developed to extract the defect features [1]. Most methods have better understanding and interpretation of data. But some common factors in the realistic application may have effects on the performance of selected signal processing method. Especially in the procedure of data acquisition, noise from operation of transmission or other parts of mechanical system will contaminate the vibration signal, or even overwhelm the impulses in the signal [2]. As the result, fault characteristics may be difficult to be identified.
For better performance of feature extraction and identification, many techniques have been proposed. Wavelet packet decomposition is utilized to analyze acoustic emission signals to investigate the failure of tribological systems [3]. Wavelet packet decomposition is also applied for temporal-frequency information and the energy features capture [4]. Although wavelet analysis was widely used in vibration signal processing, there are also many deficiencies such as the difficulty of wavelet basis selection [5]. As an adaptive time-frequency signal processing method with better performance, HHT was applied to water wave analysis, EEG signal feature extraction and vibration signal processing [6-9]. Meanwhile, many other methods such as spectral kurtosis [10], blind separation [11], order-tracking [12], cyclostationarity analysis [13], etc. are applied to fault diagnosis of rotating machine. Meanwhile, some feature enhancements based on vibration spectrum imaging and binaryzation are introduced to visualize and efficiently refine the spectral features [14, 15].
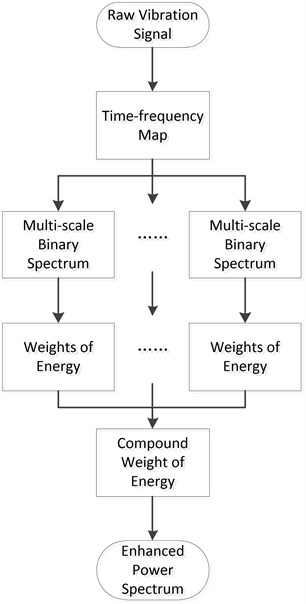
In this paper, a novel method of extracting shock energy associate features in the background of intense noise interference is proposed. A new idea of multi-scale binary spectrum was developed to enhance the frequency spectrum with higher dimension details. The energy weighting method proceeds in three steps. In step 1, a raw vibration signal is decomposed via the EEMD and a time-frequency map can be derived by Hilbert transform. Step 2, the time-frequency map is considered as a set of time series of energy for each particular frequency bins and each sub-signal is analyzed by binary spectrum to check if impulsive energy exists. The process should be repeated several times with different analyze scale to extract impulsive energy features with different frequency characteristics. Step 3, convert each binary spectrum into “weights of energy” by dimensionality reduction and merge the weights of energy by summation after blank processing. Finally, apply the power spectrum to the compound weight of energy. Characteristic frequency corresponding to specific fault can be revealed. With the energy weighting method, non-informative energy is suppressed while shock features are enhanced. Delamination extraction of the feature of periodic impulses can be implemented by multi-scale binary spectrum and compound weight of energy. As the verification, the method is illustrated by analysis of simulation signal and experiment of fault diagnosis of train bearing.
The paper is organized as follows: In Section 2 the detail of energy weighting method is elaborated. Section 3 depicts the simulated signal processing procedure with energy weighting method. In Section 4, a train bearing diagnosis experiment is presented as verification. At last, some conclusions are described in Section 5.
2. Energy weighting method
As it illustrated in section 1, the energy weighting method includes three steps of signal processing. A brief flow chart of this method is shown in Fig. 1. We describe each step-in detail as follows.
Fig. 1Brief flow chart of energy weighting method
2.1. Time-frequency mapping
The energy weighting method was started from time-frequency analysis. As an adaptive non-parametric time–frequency analysis method, HHT offers fine time-frequency resolution and the result is free of cross-term interferences [16]. As the central part of HHT, the algorithm of empirical mode decomposition (EMD) is depicted in quotation [6]. Some individuals are decomposed from the original signal, nearly mono-component signals with ‘Hilbert-friendly’ waveforms, named as intrinsic mode function (IMF).
However, the approach also has its problems such as scale separation. To overcome the problem, a noise-assisted data analysis method named EEMD is adopted [17, 18]. The principle of EEMD is adding white noise to populate the whole-frequency space uniformly with the constituting components of different scales. The basic idea of EEMD is adding a white noise series to the original signal and decomposing the data with added white noise into IMFs. The process is repeated with different white noise series each time to obtain the means of corresponding IMFs of the decompositions , as the final result. The original signal can be decomposed into a collection of IMFs and a residue , it can be denoted as:
Utilize the Hilbert transform to each IMF to compute the instantaneous frequency and amplitude .The signal can be expressed in the following form and the time-frequency map is acquired:
2.2. Multi-scale binary spectrum
The time-frequency map is a matrix, is the sampling length of original signal, is frequency analysis length of HHT. For , time series stand for the time-varying energy for a particular frequency bin. If the signal contains impulse component, some energy time series may have energy transient at the instant of impulse appearance [19]. So, we put if i.e. energy value of the midpoint is the highest in the interval of points. Otherwise, we put . The binary spectrum is obtained by applying this rule for every energy time series.
Selection of value d has a significant effect on binary spectrum calculation. The process should be repeated for several times with different value to depict multi-scale binary spectrum that can reflect a variety of frequency characteristics. The first binary spectrum is corresponding to the characteristic frequency we focus on, so the interval of points should cover more than two energy impulses but less than three energy impulses so that the second energy impulse can be recognized.
For the first binary spectrum, many fake energy impulses lead by noise will be existed. So, larger scopes of the interval are need in the second and other binary spectrums to reduce the affection of noise and reveal actual shock related points. The formula of interval parameter can be defined as follows:
where is sample rate, is fault frequency, is repeat count and is the largest even integer not greater than . The larger repeat count can lead to better performance of characteristic enhancement. But it also means to be more operand and more cutting of effective results in the weights of energy merging. So, the repeat time can be 4-6 as suggestion.
As the result, binary spectrums , ,…, are acquired.
2.3. Weights of energy analysis
In this step we calculate the weights of energy by summation of each binary spectrum in time domain:
Each binary spectrum has blanks at the head and the end, this phenomenon can be found in the weights of energy also. Blanks of weights of energy will lead to mistake of the following calculation of power spectrum. So, we must cut the blanks to prevent the mistakes. But the length of each weights of energy will be different if we delete the blanks directly because length of the blank equals to the interval parameter we choose and the parameter is different in each calculation of binary spectrum. In the calculation of the last binary spectrum, the repeat count is the maximum so the parameter is the maximum and can be written as . The method of blank processing is cutting the points of the head and the end and apply this method to all weights of energy. After the process of blanks, each weights of energy has a length of points.
Repeat the process of weights of energy calculation and blank processing to each binary spectrum. Then sum all the weights of energy to get a compound weight of energy :
The power spectrum of compound weight of energy can be calculated as follows:
where is the Fourier transform of .
The process of weights of energy analysis has been repeated for times. To balance the performance of characteristic enhancement and computation quantity, the repeat time can be 4-6. Each weights of energy can reflect the distribution of shock energy in different frequency scale by variation of parameter . Analyze the compound weight of energy which synthesizes multi-scale details of frequency characteristics with power spectrum. Then the characteristic frequency can be preliminary observed.
3. Simulated signal analysis
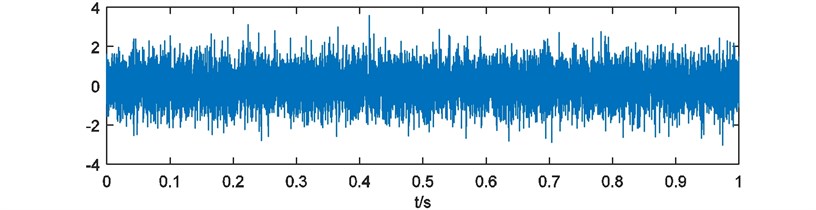
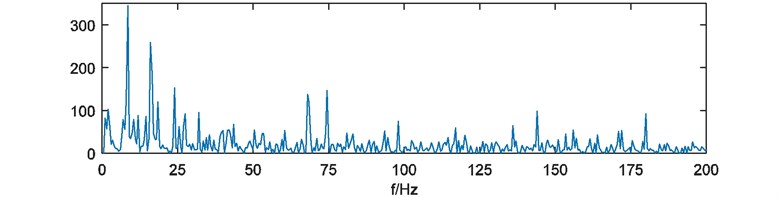
To illustrate the performance of the energy weighting method, a simulated vibration signal of bearing with local damage was analyzed. The signal is consisted of a damped sine wave as simulated shock signal shown in Fig. 2(a) and a Gaussian white noise. The length of simulated signal is 1 s, sampling rate is 10000 Hz for better performance of EEMD [20, 21]. Frequency of shocks in the signal is 40 Hz. The simulated signal is shown in Fig. 2(b). With direct FFT analysis, FFT amplitude spectrum is shown in Fig. 3. It’s difficult to identify the characteristic frequencies caused by the shocks.
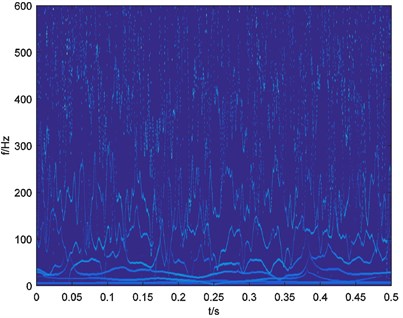
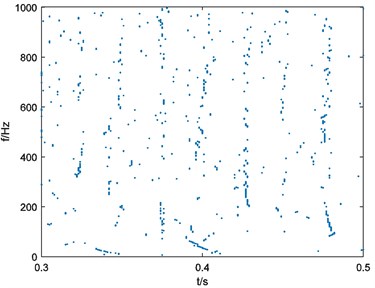
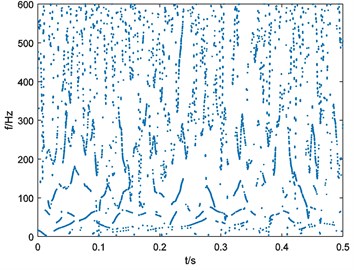
10 IMFs and a residue are obtained by processing the signal with EEMD. In the procedures of EEMD, noise level is set as 0.2 by suggestion of Wu and Huang [17]. Ensemble number is set as 100 for the balance of accuracy and calculation complexity. After the EEMD preprocessor-based HHT, a time-frequency map is obtained and shown in Fig. 4.
Fig. 2Simulated signals
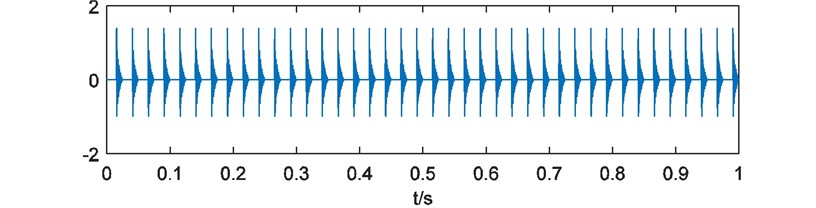
a) Simulated shock signal
b) Simulated vibration signal of bearing with local damage
Fig. 3FFT amplitude spectrum of simulated signal xt
Fig. 4Time-frequency map of simulated signal xt
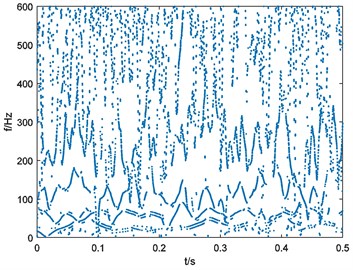
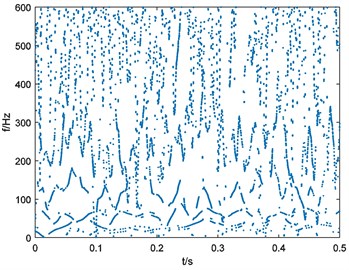
In this situation, parameters of Eq. (3) can be selected as 10000, 40, 1. Calculate the binary spectrum with 125 and the result is shown in Fig. 5(a). Repeat the process of binary spectrum calculation with 250, 375, 500. Results of binary spectrums are shown in Fig. 5(b), Fig. 5(c), Fig. 5(d) respectively.
Fig. 5Binary spectrum of simulated signal xt
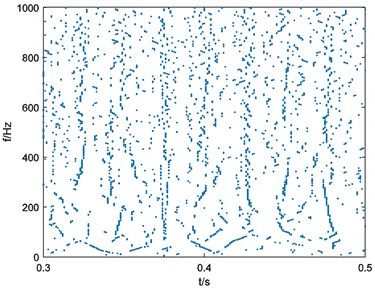
a), 125
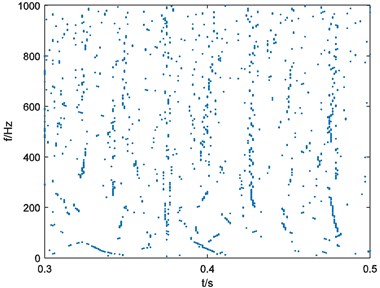
b), 250
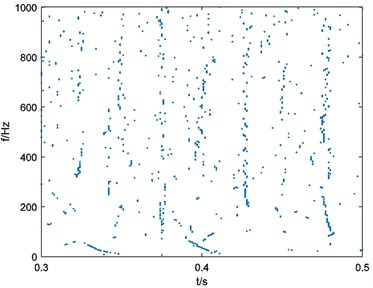
c), 375
d), 500
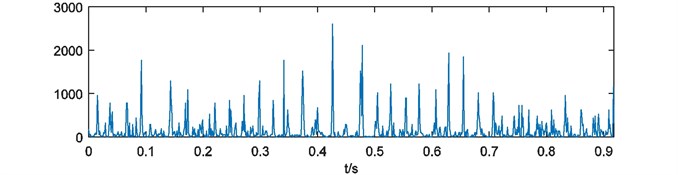
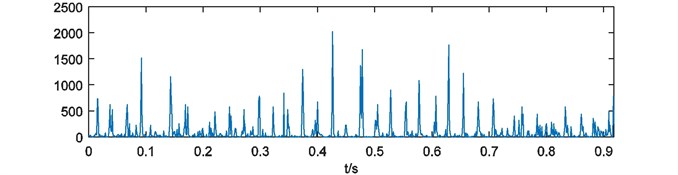
For further analysis, weights of energy are calculated by Eq. (4). As it mentioned in Section 2.3, each weights of energy have blanks at the head and the end. In this case, the process of binary spectrum calculation has been repeated for 4 times. So 500 and 500 points at the head and the end of each weights of energy should be cut. Four weights of energy with blank processing are shown in Fig. 6.
As it depicted in Fig. 6, four weights of energy describe the non-informative details of energy distribution more and more obscure with the growth of parameter . It means that the multi-scale binary spectrum and weights of energy analysis enhanced shock energy in particular frequency scales that we focus on.
As the final step, four weights of energy are merged by summation as the compound weight of energy which is shown in Fig. 7. The power spectrum of is acquired and depicted in Fig. 8. The result can reflect the simulated fault frequency 40Hz and its frequency multiplication significantly.
4. Experimental verification
To verify the effectiveness of the energy weighting method in fault diagnosis application of train bearing, a wheel set experiment was designed and an outer-race fault bearing test was performed in this section.
Fig. 6Weights of energy with blank processing
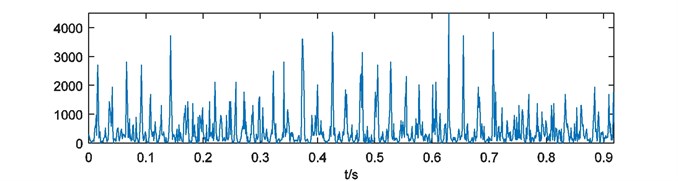
a)
b)
c)
d)
Fig. 7Compound weight of energy W^s(t)
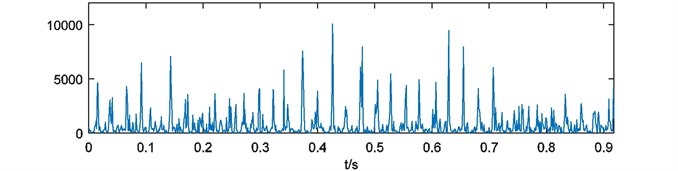
Fig. 8Power spectrum of W^s(t)
4.1. Wheel set experiment
The wheel set test stand is shown in Fig. 9(a). The constitution includes the frame, a wheel set (a healthy bearing and a damaged bearing included), wheel set lifting device, driving device (electric motors and rubber wheels), brake, hydraulic system and control system. Two bearings are installed on the wheel set by interference fit. Lifting device with groove on the top lift the wheel set and embed it into the groove of frame cantilever. After wheel set fixation, electric motor with rubber wheel rub the side face of wheel to drive it. Rotating speed of wheel is 469 rpm. Model of bearings applied in this experiment is 352226x2-2z, its parameters are listed in Table 1. Vibration signals are acquired by NI PXI DAQ device with acceleration sensors. The sensors shown in Fig. 9(b) are installed with magnet. We take the signal acquired by the vertical fixed sensor for signal processing because it can reflect the fault more directly.
Fig. 9Scene of wheel set test
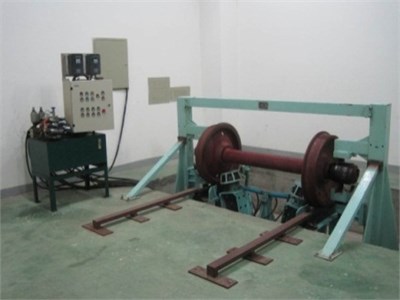
a) Wheel set test stand
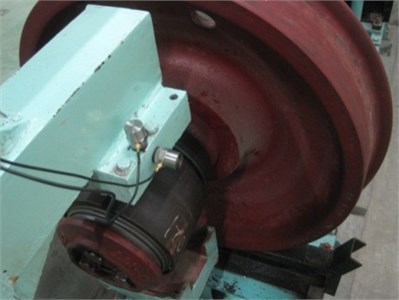
b) Installation of the sensors
Table 1Parameters of 352226x2-2z bearing
Unit | Size |
Mean diameter | 176.29 mm |
Roller diameter | 24.74 mm |
Contact angle | 8.833° |
Roller number | 20 |
4.2. Bearing outer-race defect identification
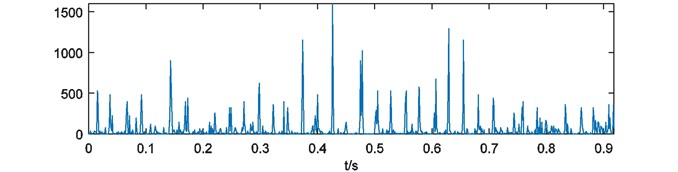
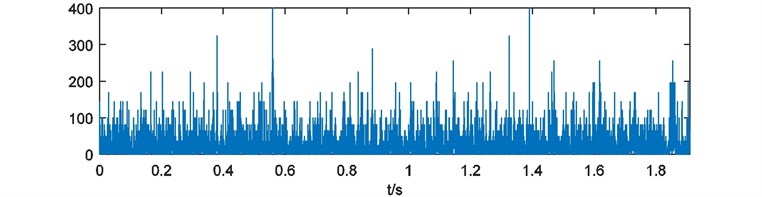
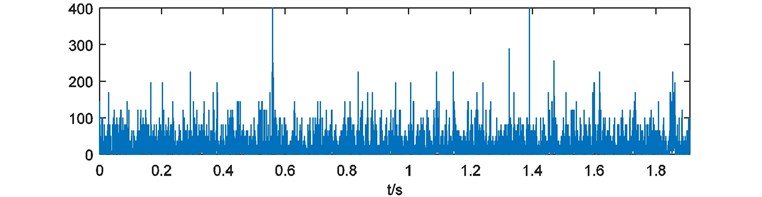
Fault bearing applied in the experiment is shown in Fig. 10. A defect on outer-race can be seen in the photo. The defect is caused by abrasion in daily use, so it has an irregular shape. Characteristic frequency of the outer-race defect is 67.3 Hz. Vibration acceleration signal is acquired and presented in Fig. 11. Sampling rate of data acquisition is 5120 Hz. Sample time is 2 s.
With direct FFT analysis, FFT amplitude spectrum of the vibration signal is shown in Fig. 12. It’s difficult to find characteristic frequencies caused by the outer-race defect. For further analysis, the envelope spectrum of the vibration signal is shown in Fig. 13, only rotating frequency and resonances can be identified also. The peak at the fault frequency about 67 Hz is similar with another at 75 Hz. So, it’s unable to justify the outer-race defect.
Fig. 10Outer-race fault bearing
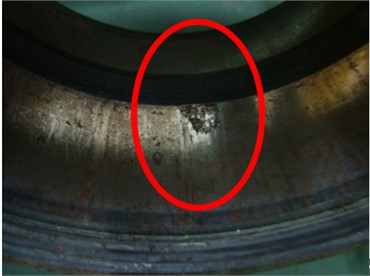
Fig. 11Vibration acceleration signal of outer-race fault bearing test
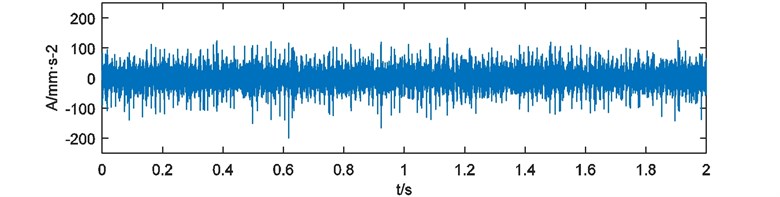
Fig. 12FFT amplitude spectrum of outer-race fault bearing vibration signal
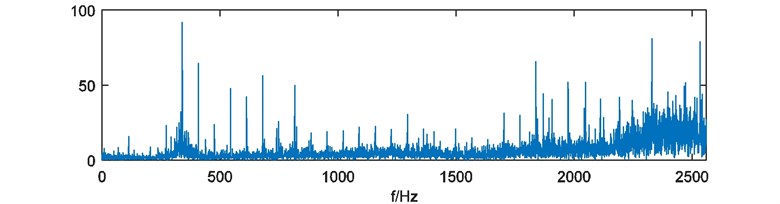
Fig. 13Envelope spectrum of outer-race fault bearing vibration signal
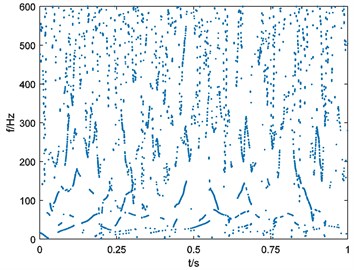
The vibration signal is processed with EEMD. Set the noise level as 0.2 and ensemble number as 100. After the EEMD preprocessor-based HHT a time-frequency map is obtained and shown in Fig. 14.
In this situation, parameters of Eq. (3) is 5120, 67.3 and the progress of multi-scale binary spectrum calculation can be repeated for 6 times. So, the constant can be selected as 38, 76, 114, 152, 190, 228 corresponding to 1, 2, 3, 4, 5, 6. The results of multi-scale binary spectrum calculation are shown in Fig. 15.
Fig. 14Time-frequency map of outer-race fault bearing vibration signal
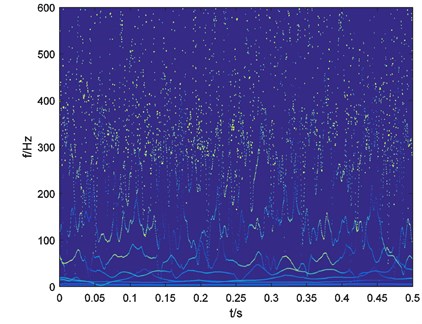
Fig. 15Binary spectrum of outer-race fault bearing vibration signal
a), 38
b), 76
c), 114
d), 152
e), 190
f), 228
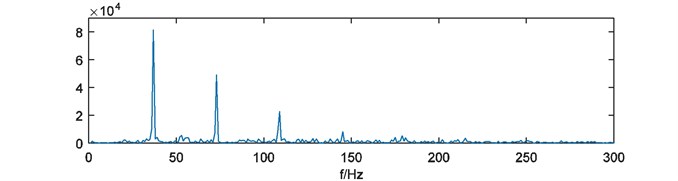
Weights of energy are calculated and depicted in Fig. 16. Here the blanks of each weights of energy are treated with 228 points cutting at the head and the end. Then the weights of energy are emerged and the compound weight of energy is shown in Fig. 17. The power spectrum of is acquired as Fig. 18.
Fig. 16Weights of energy with blank processing
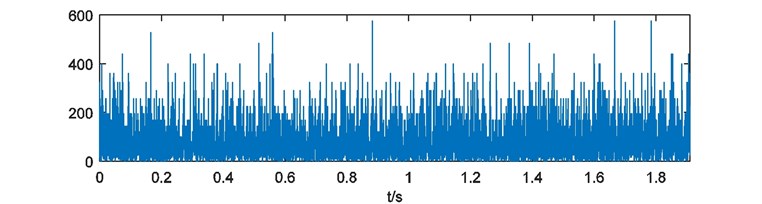
a)
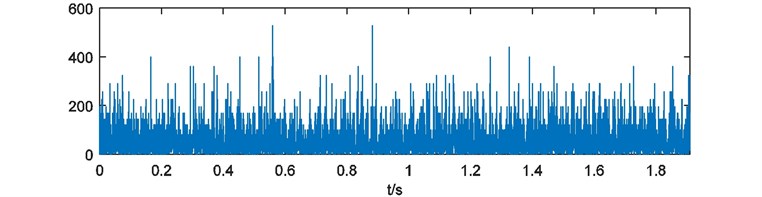
b)
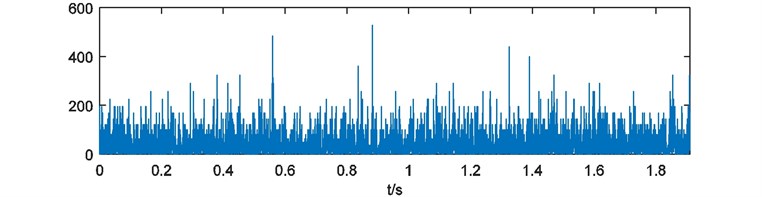
c)
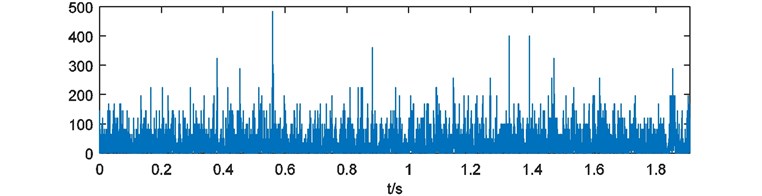
d)
e)
f)
Fig. 17Compound weight of energy W^r(t)
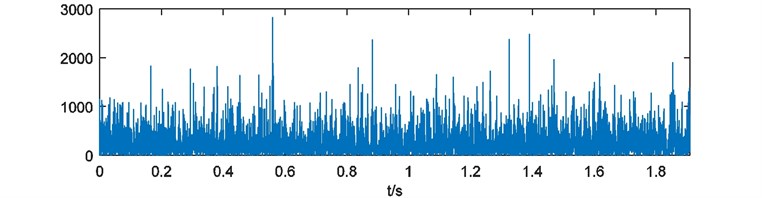
Fig. 18Power spectrum of W^r(t)
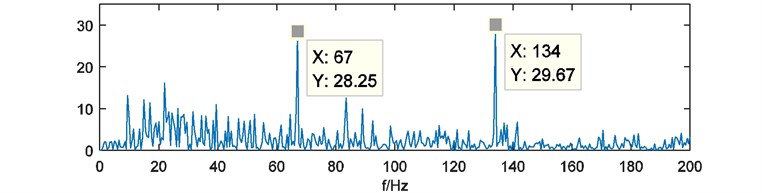
For this experiment, impulses generated by bearing defect have been overwhelmed by noise of drive system. So, the fault characteristic is difficult to be extracted. According to the analysis of energy weighting method, fault frequency and the resonances have been enhanced by multi-scale binary spectrum and converted to time domain by weights of energy. The compound weight of energy synthesized results of each analysis scales. Its power spectrum can reveal the fault characteristic clearly.
5. Conclusions
In this paper, a novel method of shock energy information extraction is proposed. This method utilized an original algorithm of multi-scale dimension descending method to extract shock impulses from high definition time-frequency map. Multi-scale binary spectrum can enhance characteristic frequency and resonances specifically by weighting the point of energy transient as 1 and other points as 0. The weights of energy analysis can be understood as integration of information with different scales of observation. The advantage of this method is that the creative multi-scale binary spectrum and weights of energy analysis are able to eliminate the fault irrelevant signal components with accurate scale of characteristic enhancement. High performance of intense noise-interfered signal processing is verified by simulated signal processing and actual train bearing experiment. Both the simulated signal and the experimental signal are failed to process with direct FFT or envelope spectrum to identify the characteristics. But the energy weighting method can achieve that.
However, the method also has its shortages such as the empirical selection of parameter in binary spectrum calculation and the unavailability of immutable parameter in diagnosis of machines in variable operating condition. Therefore, self-adaptable and variable parameter binary spectrum will be considered in further research.
References
-
Jardine A., Lin D., Banjevic D. A review on machinery diagnostics and prognostics implementing condition-based maintenance. Mechanical Systems and Signal Processing, Vol. 20, Issue 7, 2006, p. 510-1483.
-
El-Thalji I., Jantunen E. A summary of fault modelling and predictive health monitoring of rolling element bearings. Mechanical Systems and Signal Processing, Vol. 60-61, 2015, p. 252-272.
-
Bianchi D., Mayrhofer E., Groeschl M., Betz G., Vernes A. Wavelet packet transform for detection of single events in acoustic emission signals. Mechanical Systems and Signal Processing, Vols. 64-65, 2015, p. 441-451.
-
Wang G., Feng X., Liu C. Bearing fault classification based on conditional random field. Shock and Vibration, Vol. 20, Issue 4, 2013, p. 591-600.
-
Castejon C., Gomez M., Garcia-Prada J., Ordonez A., Rubio H. Automatic Selection of the WPT decomposition level for condition monitoring of rotor elements based on the sensitivity analysis of the wavelet energy. The International Journal of Acoustics and Vibration, Vol. 20, Issue 2, 2015, p. 95-100.
-
Huang N., Shen Z, Long S., Wu M., Shih H., Zheng Q., et al. The empirical mode decomposition and the Hilbert spectrum for nonlinear and non-stationary time series analysis. Proceedings of the Royal Society of London Series A: Mathematical, Physical and Engineering Sciences, Vol. 454, Issue 1971, 1998, p. 903-995.
-
Huang N., Shen Z., Long S. A new view of nonlinear water waves: the Hilbert spectrum. Annual Review of Fluid Mechanics, Vol. 31, Issue 7, 2003, p. 417-457.
-
Shih M., Doctor F., Fan S., Jen K., Shieh J. Instantaneous 3D EEG signal analysis based on empirical mode decomposition and the Hilbert-Huang transform applied to depth of anaesthesia. Entropy, Vol. 17, Issue 3, 2015, p. 928-949.
-
Peng Z., Tse P., Chu F. A comparison study of improved Hilbert-Huang transform and wavelet transform: application to fault diagnosis for rolling bearing. Mechanical Systems and Signal Processing, Vol. 19, Issue 5, 2005, p. 974-988.
-
Antoni J., Randall R. The spectral kurtosis: application to the vibratory surveillance and diagnostics of rotating machines. Mechanical Systems and Signal Processing, Vol. 20, Issue 2, 2006, p. 308-331.
-
Antoni J. Blind separation of vibration components: principles and demonstrations. Mechanical Systems and Signal Processing, Vol. 19, Issue 6, 2005, p. 1166-1180.
-
Coats M., Randall R. Single and multi-stage phase demodulation based order-tracking. Mechanical Systems and Signal Processing, Vol. 44, Issues 1-2, 2014, p. 86-117.
-
Boungou D., Guillet F., El Badaoui M., Lyonnet P., Rosario T. Fatigue damage detection using cyclostationarity. Mechanical Systems and Signal Processing, Vol. 58, Issue 59, 2015, p. 128-142.
-
Amar M., Gondal I., Wilson C. Vibration spectrum imaging: a novel bearing fault classification approach. IEEE Transactions on Industrial Electronics, Vol. 62, Issue 1, 2015, p. 494-502.
-
Obuchowski J., Wylomanska A., Zimroz R. The local maxima method for enhancement of time-frequency map and its application to local damage detection in rotating machines. Mechanical Systems and Signal Processing, Vol. 46, Issue 2, 2014, p. 389-405.
-
Feng Z., Liang M., Chu F. Recent advances in time-frequency analysis methods for machinery fault diagnosis: a review with application examples. Mechanical Systems and Signal Processing, Vol. 38, Issue 1, 2013, p. 165-205.
-
Wu Z., Huang N. Ensemble empirical mode decomposition: a noise-assisted data analysis method. Advances in Adaptive Data Analysis, Vol. 1, Issue 1, 2009, p. 1-41.
-
Wang Y., Yeh C., Young H., Hu K., Lo M. On the computational complexity of the empirical mode decomposition algorithm. Physica a-Statistical Mechanics and its Applications, Vol. 400, 2014, p. 159-167.
-
Rilling G., Flandrin P., Goncalves P. On empirical mode decomposition and its algorithms. IEEE EURASIP Workshop on Nonlinear Signal and Image Processing, 2003.
-
Rilling G., Flandrin P. On the influence of sampling on the empirical mode decomposition. IEEE International Conference on Acoustics, Speech and Signal Processing, 2006.
Cited by
About this article

This research is sponsored by National Natural Science Foundation of China and Civil Aviation Administration of China jointly funded project (No. U1533103) and National Natural Science Foundation of China (No. 51475324).
