Abstract
To investigate the dynamic increase factor (DIF) for nonlinear static (NS) alternate path analysis, the nonlinear dynamic (ND) and static analysis of a 6-storey reinforced concrete (RC) frame with specially shaped columns are carried out by utilizing OpenSees after the corner, side or inner column is removed respectively. Using the vertical displacement of removal column top node and axial force of adjacent column as control, reasonable value of DIF in the NS analysis are estimated according to the analysis results. A DIF about 1.8, 1.2 and 1.4 could capture the dynamic responses in corner, side or inner column removal scenario respectively when a static analysis is performed. The DIF in corner column removal scenario increases with the increasing of the floor on which the failure column locates and reaches the peak value at the top floor, while the DIF in inner or side column removal scenario decrease slightly. The DIF of inner or side column removal scenario increases linearly with the elongation of the beam span. The reinforcement of frame with specially shaped columns has little effect on the DIF.
1. Introduction
From the Ronan Point apartment building collapse in England in 1968 to the terrorist attacks on World Trade Center towers in 2001, progressive collapse has caused huge casualties and property losses. Progressive collapse is defined as the spread of an initial local failure from element to element, which eventually results in the collapse of an entire structure or a disproportionately large part of it [1]. To prevent progressive collapse, a structure should have sufficient redundancy to offer an alternate path to sustain the redistributed loads. Relevant standards and guidelines have proposed design procedures to assess progressive collapse potential of the structure in detail. While only the first security level tall buildings in China is required to meet the design requirements on the resistance of progressive collapse [2], in which systematic research is not mature.
The alternate path method is the most widely direct approach to assess the progressive collapse potential of building structures. The method investigates the load redistribution behavior of the residual damaged structure resulting from removing a column or section of wall from the original structure artificially and then evaluates structural performance against prescribed acceptance criteria beyond which a structure is considered not having adequate capacity to prevent progressive collapse. According to whether nonlinearity or dynamic effect is taken into account, three different analytical procedures, namely the linear static (LS), NS and ND, are available in the alternate path method. Advantages and disadvantages of these approaches have been discussed through analyzing a steel moment-resistant frame building by Marjanishvili and Agnew [3]. To approximate the peak dynamic responses in the ND analysis, a dynamic multiplier should be used to amplify the gravity loads on the affected bays of a building frame in static analysis. For the LS and NS procedures, the earlier editions of progressive collapse design guidelines [4, 5] used the same dynamic multiplier of 2.0 regardless of the structural type and load distribution of a specific building. This value is derived from structural dynamics, in which the maximum dynamic displacement of an instantaneously applied constant load in a linear analysis is twice the displacement achieved when the load is applied statically [6]. However, in accidental loading events, it is more conventional to design structures to respond in the nonlinear range resulting in the dynamic multiplier less than 2.0 [7]. Furthermore, the dynamic multiplier in the LS analysis is required to account for both dynamic and nonlinear effects, which is different from that in the NS analysis accounting only for the dynamic effect. Recognizing the apparent drawback of using the same dynamic multiplier of 2.0, a number of alternate path analyses on a variety of RC and steel moment-frame buildings were performed to obtain the regression formulas of the load increase factor (LIF) in the LS analysis and the DIF in the NS analysis [8]. Recently many analytical and numerical studies have been carried out on this issue. Tsai [9] proposed analytical LIF and DIF expressions with the advantage of explicitly considering the post-yield stiffness ratio of structural frames. Validity of proposed analytical expressions was confirmed by comparisons made with that calculated from different empirical formulae. The study results indicated that the proposed analytical expressions might be an alternative in estimating the LIF and DIF for progressive collapse analysis. Liu [10] presented a new empirical method for calculating the DIF based on illustrative analysis of three specific steel moment frames. The new DIF was able to directly take into account the level of overall residual capacity of a frame upon sudden column removal. A step-by-step nonlinear static analysis procedure based on the new DIF was also outlined. Li et al. [11] established an analytical expression of the dynamic amplification factor for the LS analysis based on the energy conservation principle of the collapse-resisting substructure. The dynamic amplification factor was validated through a series of the numerical examples including a SDOF system, a 3-storey planar frame and an 8-storey 3-D RC frame model structures.
It can be seen from the above studies that they were mainly focused on the dynamic amplification factor for conventional frames. Few literatures paid attention to the RC frame with specially shaped columns, which can offer advantages such as avoiding prominent corners in a room and increasing usable floor area so as to be widely applied in multistoried and high-rise buildings in China. Thus, it is imperative to further study the DIF for NS alternate path analysis of frames with specially shaped columns. In this paper, a finite element model of RC frame with specially shaped columns is developed to perform the ND and NS analyses in the light of the alternate path analysis. Using the displacement and axial forces in the affected bays adjacent to the failure column as control, the suggested values of the DIF in different scenarios are evaluated and verified. Related influencing factors of the DIF, such as the location of the failure column, reinforcements of the frame and the length of the beam span, are also discussed and illustrated in this paper.
2. Dynamic increase factor
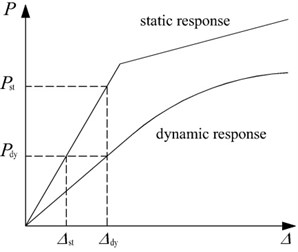
Compared with the ND analysis, the NS analysis which uses the DIF to amplify the gravity loads tends to be simpler and less labor demanding so as to be widely adopted to approximate the true ND resistance demand. The DIF is usually defined as the ratio of the dynamic displacement of a structure to its static displacement under an equal applied loading , namely the displacement-based DIF:
As illustrated in Fig. 1, the DIF may also be expressed as the ratio of the static force to the dynamic force under an equal displacement demand, namely the force-based DIF:
As shown in Fig. 1, Eqs. (1-2) are equal in the elastic stage. According to the deformation equivalent principle, the force-based DIF is conventionally applied in the NS analysis. However, the displacement-based DIF is only applicable in the elastic stage. In this paper, the force-based DIF for the RC frame with specially shaped columns is evaluated by increasing the load on the affected bays in the NS alternate path analysis.
Fig. 1Illustration of DIF
3. Finite-element model
3.1. Element type
The finite-element model of the RC frame with specially shaped columns is established by OpenSees. The beam and column elements are simulated using the Force-Based Beam-Column Element from the OpenSees library [12]. By determining the resistance and stiffness matrix of control sections, the resistance and tangent stiffness matrix of the entire element is integrated along the length in the light of Gauss integration. Slabs are not simulated in the modeling on which loads are applied to the adjoining beams by the rule of the two-way slab. To consider the enhancement of slabs on beams, the beam elements with T-shaped or L-shaped sections are employed in the numerical analysis [13]. It should be noted that the width of the effective flange is evaluated according to Chinese code for concrete structures [14].
3.2. Material properties and constitutive models
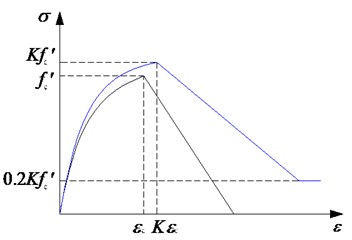
The element is composed of fiber sections in which material properties of concrete and steel bars are respectively assigned to the fibers. As displayed in Fig. 2, Hysteretic Material from OpenSees is employed herein to model steel bars. Concrete02 Material derived from the modified Kent-Park model [15] is used to describe the stress-strain relationship of concrete, as shown in Fig. 3. The section of beams and columns is divided into the protective layer concrete and core concrete. The ultimate compressive strain of the protective layer concrete is taken as 0.004, while the ultimate compressive strength is taken as 0 in consideration of the spalling of concrete. The concrete strength enhancement coefficient needs to be taken into account in the core concrete. Its constitutive equations and related parameters are defined as follows:
For rising part of the curve:
For descending part of the curve:
For horizontal part of the curve:
where and are, respectively, the concrete strength enhancement coefficient due to stirrup constraints and the strain softening slope. They are mathematically expressed as:
where and are the concrete stress and strain; is the compressive strength of concrete cylinder; is the yield strength of stirrup; is the volume-stirrup ratio of beams or columns; is the width of core concrete; and is the stirrup spacing. The ultimate compressive strain of the core concrete is derived as:
Fig. 2Rebar constitutive model
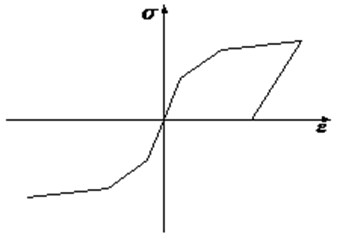
Fig. 3Concrete constitutive model
3.3. Model validation
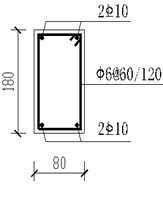
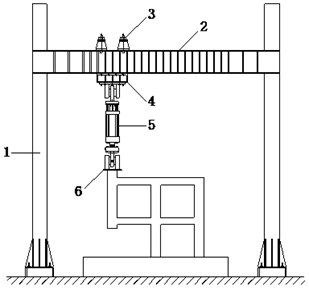
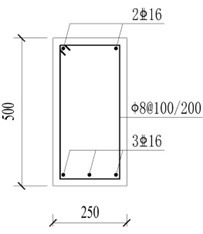
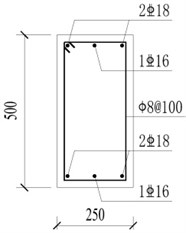
To investigate the progressive collapse potential of RC frames with specially shaped columns subjected to the loss of a ground corner column, an experiment of a one-third scale, two-bay x three-bay, two-story model frame was carried out (Fig. 4) [16]. The dimensions of the model frame and measuring points are displayed in Fig. 5. The height of story was 1m, and the thickness of slab was designed as 50mm. The section dimensions and reinforcements of columns and beams are displayed in Fig. 6. The material properties of steel are listed in Table 1, where , , and are steel yield strength, ultimate strength, ratio of elongation and elastic modulus. The average compressive strength of concrete is 42.3 MPa, which is obtained from standard 150 mm cubes. Sandbags were uniformly placed on slabs with 2.8 kN/m2 load applied. The ground Column A4 designed as the failed column was substituted by a steel pipe to support the superstructure during concrete casting process and was instantaneously removed to simulate the loss of the corner column. After the dynamic test, vertical load was applied by a 1000 kN hydraulic jack installed on top of second-floor Column A4 to perform a static test. Fig. 7 depicts the details of the loading equipment in the static test. Based on OpenSees, a finite-element model completely replicates the test, in which the properties and dimensions are identical to those in the test. The comparison between numerical and experimental results is shown in Fig. 8. It can be seen that the finite element model is accurate enough to conduct the progressive collapse analysis for RC frame with specially shaped columns, which could provide theoretical basis for the following analyses.
Fig. 4Experimental set-up
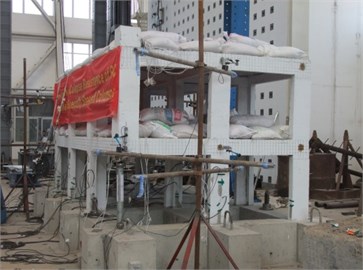
Fig. 5First-floor plan (dimensions in mm)
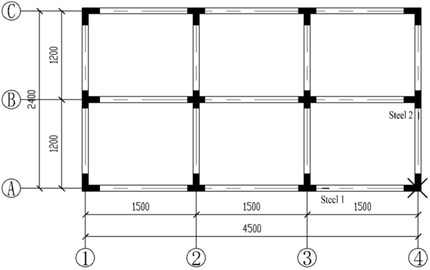
Fig. 6Section details (dimensions in mm). (Note: A and C stand for steel strength grade of HPB300 and HRB400 in Chinese concrete code respectively. @ stands for stirrup space. There is a decrease in spacing of beam stirrup by half of the above near beam-column joint.)
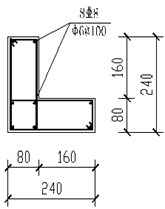
a) L-shaped column
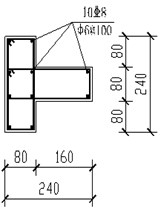
b) T-shaped column
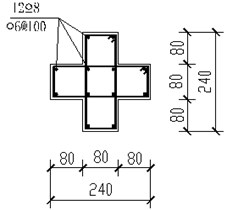
c) Cross-shaped column
d) Beam
Table 1Mechanical properties of steel
Reinforcement | /MPa | /MPa | / % | / (105MPa) |
A6 | 417.0 | 541.4 | 30.4 | 2.12 |
C8 | 454.1 | 640.3 | 28.4 | 2.65 |
C10 | 433.6 | 627.8 | 29.1 | 2.25 |
Fig. 7Loading equipment. (Note: 1. Column; 2. Load-carrying beam; 3. Girder; 4. Box-girder; 5. Hydraulic jack; 6. Steel inserted plate)
4. Frame design and modeling
4.1. Building characteristics
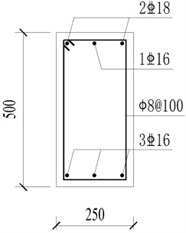
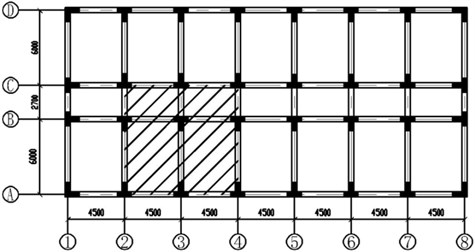
A seven-bay three-bay, six-story RC frame structure with specially shaped columns is designed in accordance with the requirements of Chinese code for seismic design of buildings [17] and specification for concrete structures with specially shaped columns [18]. The layout of the frame is displayed in Fig. 9. The height of story is 3.3 m, and the thickness of slab is 120 mm. The concrete strength grade of beams, floors and columns is C30, which is estimated at approximately 24 MPa for a standard concrete cylinder. The concrete protective layer thickness is 30 mm. The yield strength is 400 MPa for the main reinforcements and 300 MPa for the stirrups. The yield strength is 300 MPa for the reinforcements in slabs. The dead loads are 7.5 kN/m2 for roof and 5 kN/m2 for other floors. The live loads are 0.5 kN/m2 for roof and 2 kN/m2 for other floors. The reinforcements of beams and columns derived from PKPM, which is a widely used architectural engineering design CAD software, are presented in Fig. 10.
Fig. 8Comparison between numerical and experimental results
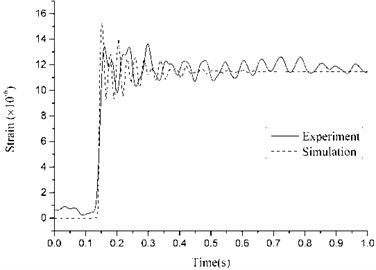
a) Strain for Steel 1 in dynamic test
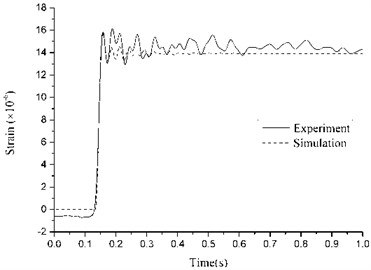
b) Strain for Steel 2 in dynamic test
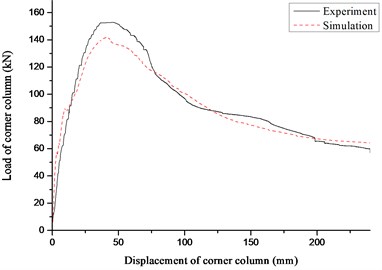
c) Vertical load vs. displacement of corner column curve in static test
4.2. Analysis method
In this paper, the corner column A1, inner column B3 and side column A3 are respectively designed as the initial failure column on the basis of the alternate path analysis method to perform the ND and NS analysis by employing OpenSess. The corresponding element type and constitutive models have been discussed in Section 3, which is verified to be accurate enough. The load combination in the ND analysis can be described as:
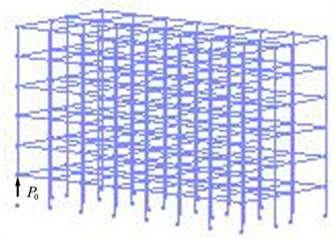
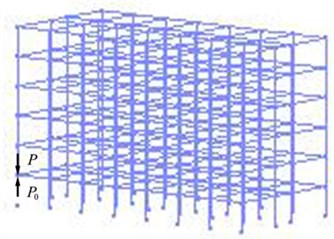
where and are dead load and live load, respectively [8]. The steps required in performing the ND analysis are: 1) build the finite element model which is shown in Fig. 9; 2) perform static analysis to estimate the internal force at the top of the removed column; 3) perform modal analysis on the residual structure; 4) as shown in Fig. 11, impose the internal force on the residual structure in the opposite direction to make the analysis model static equivalent to the primary model, apply the downward load depicted in Fig. 12 at the top of the removed column and perform the ND analysis. In Fig. 12, is the failure time which is as 0.1 times as the fundamental period of the residual structure [4].
Fig. 9Model layout (units: mm)
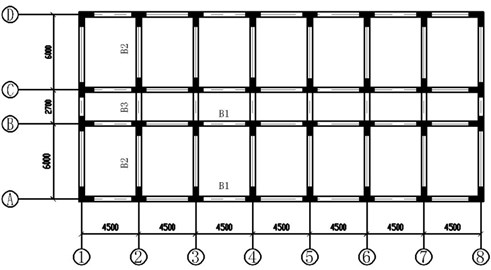
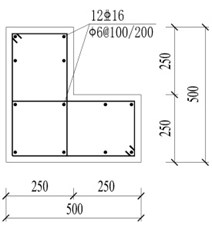
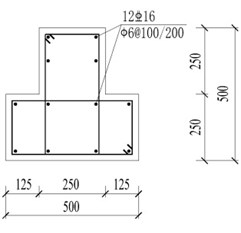
Fig. 10Reinforcement details of beams and columns (units: mm)
a) Beam B1
b) Beam B2
c) Beam B3
d) L-shaped column
e) T-shaped column
In the NS analysis, the failure column element should be removed from the model firstly and a dynamic multiplier should be used to amplify the load combination on the affected bays adjacent to the failure column. The affected bays include the floor enclosed by axes 1, 2, A and B for the corner column removal scenario, axes 2, 4, A and C for the inner column removal scenario (Fig. 13) and axes 2, 4, A and B for the side column removal scenario. The load combination applied on the affected bays above the failure column can be expressed as:
While the load combination applied on other bays can be obtained according to Eq. (9), in which the dynamic multiplier is not considered.
Fig. 11Schematic diagram in ND analysis
a) Equivalent to primary model
b) Simulate to remove failure column
Fig. 12Loading function
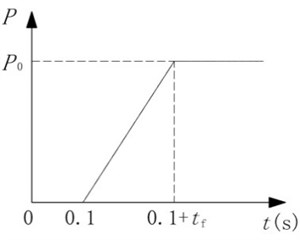
Fig. 13Affected bays for inner column removal scenario
4.3. Analysis parameters
The Rayleigh damping of the frame should be taken into account in the ND analysis. The first two frequencies of the residual structure derived from modal analysis can be employed to calculate the mass damping coefficient and the stiffness damping coefficient as follows [19]:
where and are the first two natural frequencies of the residual structure derived from modal analysis; and the damping ratio of concrete is 0.05.
As the two-way shear and torsion are not coupled in the fiber section of OpenSees, the uniaxial elastic constitutive for shear and torsion need to be defined as a supplement. The shear and torsional stiffness of beam and column sections are displayed in Table 2, in which and are the shear area along - and -axis direction in the local coordinate of sections, is the torsion constant, and which are evaluated according to Eqs. (13-14) are the shear stiffness along - and -axis direction, and derived from Eq. (15) is the torsional stiffness [20]. The shear modulus of concrete is 12413 MPa.
Table 2Shear and torsional stiffness of sections
Section | (105 mm2) | (105 mm2) | (109 mm4) | (109 N) | (109 N) | (1013 N·mm2) |
L-shaped column | 1.59 | 1.59 | 3.43 | 1.97 | 1.97 | 4.26 |
T-shaped column | 1.86 | 1.58 | 3.14 | 1.96 | 2.31 | 3.90 |
Beam | 1.36 | 2.11 | 2.68 | 2.62 | 1.69 | 3.33 |
5. Results and discussion
5.1. Influence of the location of failure column
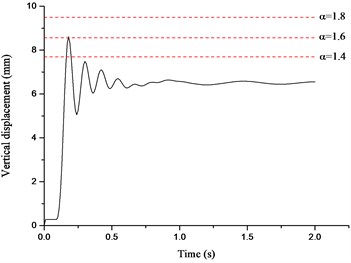
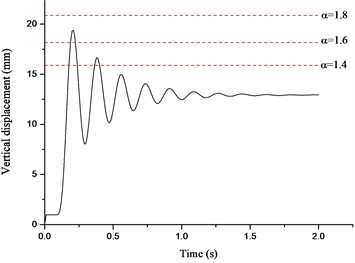
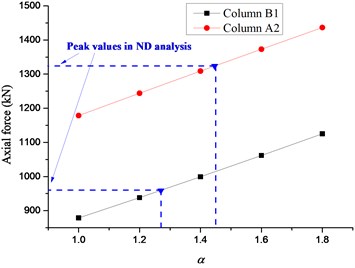
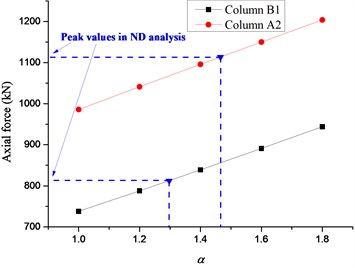
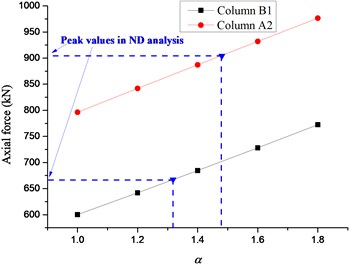
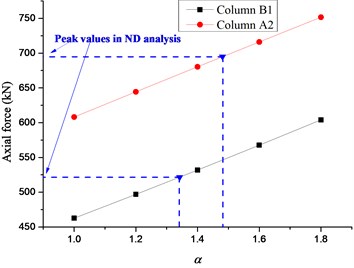
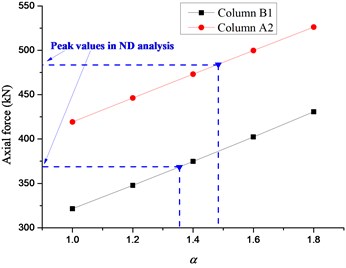
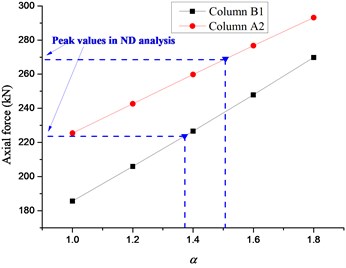
The displacement time histories on top of the failure column for Column A1 removal scenario are depicted in Fig. 14, in which the dashed lines denote the vertical displacements for different in the NS analysis. It can be seen that the vertical displacement increases gradually with the increasing of the situation of the failure column and surges to the peak value at the top floor. It is observed that the displacement in the NS analysis could approximate the maximum value in the ND analysis when reaches 1.62-1.70. The relationships between axial forces of adjacent columns and are presented in Fig. 15, in which the dashed lines denote the peak axial forces in the ND analysis and corresponding . The axial forces in the NS analysis increase linearly with the increasing of . It is noted that the corresponding to peak axial forces in the ND analysis are all less than 1.60, which verifies the safety of the evaluated previously. It is suggested that the NS analysis for the frame with specially shaped columns subjected to corner column loss has enough safety reserve at a DIF of 1.70.
Table 3α for Column B3 removal scenario
Floor of Col. B3 | Axial force of adjacent columns (kN) | Displacement (mm) | |||||||||
NS analysis | ND analysis | NS analysis | ND analysis | ||||||||
Col. B2 | Col. B4 | Col. C3 | Col. A3 | Col. B2 | Col. B4 | Col. C3 | Col. A3 | ||||
1 | 1.20 | 1332 | 1362 | 1659 | 1018 | 1316 | 1349 | 1696 | 964 | 4.314 | 4.296 |
2 | 1.21 | 1109 | 1139 | 1381 | 857 | 1099 | 1131 | 1416 | 812 | 4.666 | 4.653 |
3 | 1.21 | 896 | 923 | 1125 | 693 | 888 | 916 | 1151 | 657 | 4.871 | 4.862 |
4 | 1.21 | 688 | 710 | 872 | 529 | 681 | 703 | 887 | 500 | 5.003 | 4.979 |
5 | 1.19 | 478 | 492 | 611 | 360 | 473 | 487 | 619 | 342 | 5.063 | 5.057 |
6 | 1.17 | 276 | 281 | 324 | 196 | 271 | 276 | 330 | 185 | 5.898 | 5.882 |
Table 4α for Column A3 removal scenario
Floor of Col. A3 | Axial force of adjacent columns (kN) | Displacement (mm) | |||||||
NS analysis | ND analysis | NS analysis | ND analysis | ||||||
Col. A2 | Col. A4 | Col. B3 | Col. A2 | Col. A4 | Col. B3 | ||||
1 | 1.32 | 1290 | 1301 | 1406 | 1272 | 1290 | 1323 | 6.879 | 6.843 |
2 | 1.32 | 1077 | 1090 | 1174 | 1064 | 1083 | 1107 | 7.181 | 7.151 |
3 | 1.32 | 871 | 884 | 954 | 860 | 877 | 899 | 7.384 | 7.344 |
4 | 1.31 | 665 | 677 | 737 | 657 | 671 | 693 | 7.484 | 7.462 |
5 | 1.30 | 460 | 468 | 519 | 453 | 462 | 486 | 7.670 | 7.615 |
6 | 1.26 | 249 | 253 | 292 | 246 | 250 | 267 | 8.382 | 8.354 |
Table 3 summarizes the results for Column B3 removal scenario in detail, in which the displacement of the NS analysis could approximate the maximum value of the ND analysis when approaches 1.17-1.21. The peak axial forces of adjacent columns in the ND analysis are all less than those in the NS analysis, except for Column C3 with a slight deviation of 2 %. In general, the DIF of 1.21 is adequate to be used in the NS analysis for the frame with specially shaped columns subjected to inner column loss. The results for Column A3 removal scenario are displayed in Table 4. It can be seen that the displacement in the NS analysis approximates the maximum value in the ND analysis at of 1.26-1.32. It is clear that the peak axial forces of adjacent columns in the ND analysis are all less than those in the NS analysis. Consequently, the DIF of 1.32 should be adopted in the NS analysis for side column removal scenario.
Fig. 14Displacement time histories for Column A1 removal scenario
a) First floor
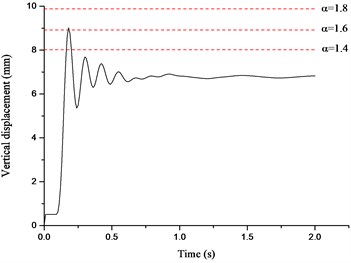
b) Second floor
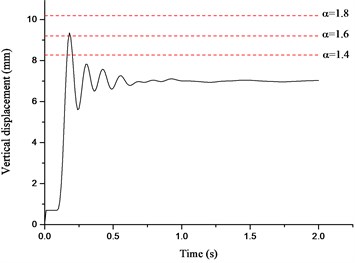
c) Third floor
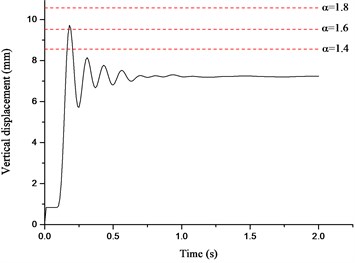
d) Fourth floor
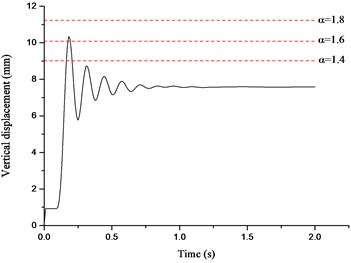
e) Fifth floor
f) Sixth floor
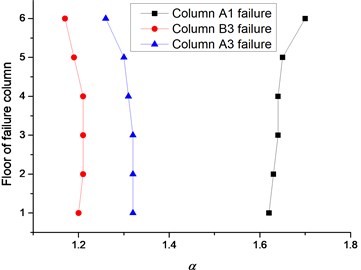
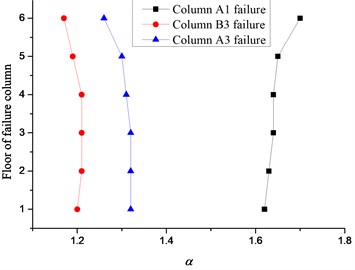
The relationship between and the story on which the failure column locates is exhibited in Fig. 16. The superstructure above the failure corner column tends to be a cantilever structure resulting in more remarkable dynamic effect with the increase of the story. As a result, the for the corner column removal scenario increases gradually and reaches its peak value at the top floor. Whereas the for the inner or side column removal scenario decreases slightly resulting from the less loads on the superstructure. It should be noted that the DIF could be obtained at the top floor for the corner column removal scenario and at the first floor for the inner or side column removal scenario generally. Although sustained more loads than the corner column, the for the inner or side column removal scenario at each floor is much less as the joint on top of the failure column is firmly constrained by more connected beams. It is concluded that the reduces with the increment of the constraint at the failure joint. In other words, the DIF for the corner, side or inner column removal scenario decreases in turn.
Fig. 15Relationship between axial forces of adjacent columns and α
a) First floor
b) Second floor
c) Third floor
d) Fourth floor
e) Fifth floor
f) Sixth floor
Fig. 16Relationship between story and α
5.2. Influence of the reinforcement of frame
In order to look into the influence of the reinforcements on the DIF, the structure is designed for the seismic intensities of 7 and 8 degrees respectively, in which the reinforcements increase approximately 17 % and 87 % compared with the frame designed of 6 degree. The corresponding PGA values of the design earthquake are 100 cm/s2 and 200 cm/s2. It can be seen from Fig. 17 that the variations of for frames designed of 7 and 8 degrees are consist with that of 6 degree. As displayed in Table 5, the DIF for the frame designed of 7 degree are completely identical with that of 6 degree and the DIF for the frame designed of 8 degree in the corner, inner and side column removal scenarios are 1.74, 1.20 and 1.33, respectively. It is indicated that the reinforcements of the frame with specially shaped columns has relatively little effect on the DIF. The values of 1.8, 1.2 and 1.4 are suggested as the DIF in NS alternate path analysis of the frame with specially shaped columns subjected to the corner, inner and side column removal scenarios, respectively.
Fig. 17Relationship between story and α for frames of 7 and 8 degrees
a) 7 degree
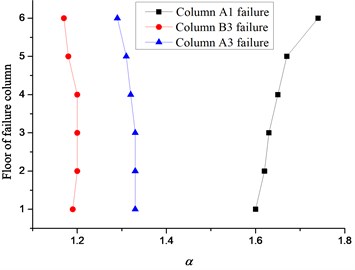
b) 8 degree
Table 5α for frames of different degrees
Case | Col. A1 removal | Col. B3 removal | Col. A3 removal | ||||||
Story | 6 degree | 7 degree | 8 degree | 6 degree | 7 degree | 8 degree | 6 degree | 7 degree | 8 degree |
1 | 1.62 | 1.62 | 1.60 | 1.20 | 1.20 | 1.19 | 1.32 | 1.32 | 1.33 |
2 | 1.63 | 1.63 | 1.62 | 1.21 | 1.21 | 1.20 | 1.32 | 1.32 | 1.33 |
3 | 1.64 | 1.64 | 1.63 | 1.21 | 1.21 | 1.20 | 1.32 | 1.32 | 1.33 |
4 | 1.64 | 1.64 | 1.65 | 1.21 | 1.21 | 1.20 | 1.31 | 1.31 | 1.32 |
5 | 1.65 | 1.65 | 1.67 | 1.19 | 1.19 | 1.18 | 1.30 | 1.30 | 1.31 |
6 | 1.70 | 1.70 | 1.74 | 1.17 | 1.17 | 1.17 | 1.26 | 1.26 | 1.29 |
5.3. Influence of the span of beam
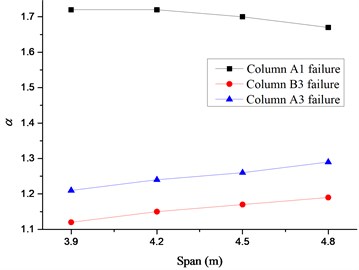
In this study, the span of Beam B1 is chosen as 3.9 m, 4.2 m, 4.5 m (the value of 4.5 m is adopted in previous study) and 4.8 m to investigate the influence of the plane layout of the frame on the DIF. As the DIF is obtained at the top floor for the corner column removal scenario and at the first floor for the inner and side column removal scenarios, the study herein are conducted for failure columns on the first, third and sixth floors, as shown in Fig. 18. It can be seen that the loading area of the affected bays above the failure column increases with the elongation of the beam span, which results in linear growth of for the inner and side column removal scenarios. It is noted that the variation of for the corner column removal scenario is not obvious resulting from relatively small loading area of the affected bays and constraints at the failure joint from connected beams, which increases slightly on the first and third floors, but decreases on the top floor with the increase of the span of Beam B1.
Fig. 18Relationship between span of Beam B1 and α
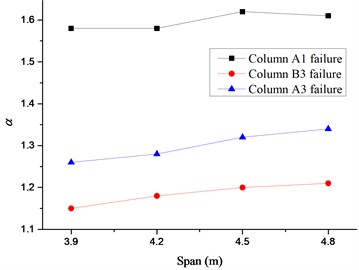
a) First floor
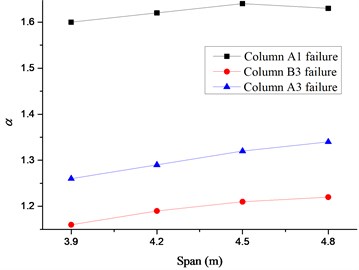
b) Third floor
c) Sixth floor
6. Conclusions
In this paper, the ND and NS analyses of the RC frame with specially shaped columns designed in accordance with the requirements of Chinese code are conducted to evaluate the DIF for NS alternate path analysis in details. Based on the findings from the analysis described in this paper, the following conclusions can be drawn:
1) It is indicated that the DIF is relevant to the location of failure column. After the failure of the corner column, the connected beams turn into cantilever beams with weak tie action at the top of the failure column. But relatively strong constraints could still be reserved after the loss of the inner column. Thus, the DIF for the corner, side or inner column removal scenario decreases in turn resulting from the increment of the constraints at the failure point;
2) It is noted that the DIF for the corner column removal scenario increases gradually with the increase of the story and reaches its peak value at the top floor, whereas the DIF for the inner or side column removal scenario decreases slightly. Consequently, the DIF could be obtained at the top floor for the corner column removal scenario and at the first floor for the inner or side column removal scenario generally;
3) The plane layout of the frame exerts a significant effect on the DIF. The DIF for the inner and side column removal scenarios increase linearly with the elongation of the beam span. There is no distinct rule in the DIF for the corner column removal scenario due to the combined effect of the loading area of the affected bays and constraints from connected beams. In addition, the reinforcements of the frame with specially shaped columns is considered to have relatively little effect on the DIF;
4) The force-based DIF of the RC frame with specially shaped columns is evaluated by increasing the load combination of the affected bays gradually. The values of 1.8, 1.2 and 1.4 are suggested as the DIF in the NS alternate path analysis for the corner, inner and side column removal scenarios, respectively. The suggestive values could be reliably used for special-shaped column frames with regular plane and vertical arrangements. The DIFs for other irregular special-shaped column frames remain to be investigated.
References
-
Minimum Design Loads for Buildings and Other Structures. American Society of Civil Engineers, Reston, Virginia, 2013.
-
JGJ 3. Technical Specification for Concrete Structures of Tall Building. Ministry of Construction of the People’s Republic of China, Beijing, 2010, (in Chinese).
-
Marjanishvili S., Agnew E. Comparison of various procedures for progressive collapse analysis. Journal of Performance of Constructed Facilities, Vol. 20, Issue 4, 2006, p. 365-374.
-
Progressive Collapse Analysis and Design Guidelines for New Federal Office Buildings and Major Modernization Projects. US General Service Administration, Washington, D.C., 2003.
-
Unified Facilities Criteria: Design of Buildings to Resist Progressive Collapse. US Department of Defense, Washington, D.C., 2005.
-
Chopra A. K. Dynamics of Structures: Theory and Applications to Earthquake Engineering. Second Edition, Prentice Hall, Englewood Cliffs, NJ, 2000.
-
Mckay A., Marchand K., Diaz M. Alternate path method in progressive collapse analysis: variation of dynamic and nonlinear load increase factors. Practice Periodical on Structural Design and Construction, Vol. 17, Issue 4, 2012, p. 152-160.
-
Unified Facilities Criteria: Design of Buildings to Resist Progressive Collapse. US Department of Defense, Washington, D.C., 2009.
-
Tsai M. H. Assessment of analytical load and dynamic increase factors for progressive collapse analysis of building frames. Advances in Structural Engineering, Vol. 15, Issue 1, 2012, p. 41-54.
-
Liu M. A new dynamic increase factor for nonlinear static alternate path analysis of building frames against progressive collapse. Engineering Structures, Vol. 48, 2013, p. 666-673.
-
Li Y., Lu X., Guan H., Ye L. An energy-based assessment on dynamic amplification factor for linear static analysis in progressive collapse design of ductile RC frame structures. Advances in Structural Engineering, Vol. 17, Issue 8, 2014, p. 1217-1226.
-
Open System for Earthquake Engineering Simulation. Pacific Earthquake Engineering Research Center, University of California, Berkeley, California, http://opensees.berkeley.edu, 2002.
-
Sasani M. Response of a reinforced concrete infilled-frame structure to removal of two adjacent columns. Engineering Structures, Vol. 30, Issue 9, 2008, p. 2478-2491.
-
GB 50010. Code for Design of Concrete Structures. Ministry of Construction of the People’s Republic of China, Beijing, 2010, (in Chinese).
-
Scott B. D., Park R., Priestley M. J. N. Stress-strain behavior of concrete confined by overlapping hoops at low and high strain rates. ACI Journal Proceedings, Vol. 79, Issue 1, 1982, p. 13-27.
-
Wang T. C., Zhang L., Zhao H. L., Chen Q. W. Progressive collapse resistance of reinforced-concrete frames with specially shaped columns under loss of a corner column. Magazine of Concrete Research, Vol. 68, 2016, p. 435-449.
-
GB 50011. Code for Seismic Design of Buildings. Ministry of Construction of the People’s Republic of China, Beijing, 2010, (in Chinese).
-
JGJ 149. Technical Specification for Concrete Structures with Specially Shaped Columns. Ministry of Construction of the People’s Republic of China, Beijing, 2006, (in Chinese).
-
Zhu B. F. The Finite Element Method Theory and Applications. China Water and Power Press, Beijing, 1998.
-
Chen X. W., Lin Z. Structural Nonlinear Analysis Porgram OpenSEES Theory and Tutorial. China Architecture and Building Press, Beijing, 2014.
About this article

The work presented in this paper was funded by the National Natural Science Foundation of China (No. 51178304), the Special Research Foundation of Doctor Station in Chinese University (No. 20120032120055) and Application Base and Advanced Technology Research (Youth Foundation) (No. 12JCQNJC05000), which are gratefully acknowledged.
