Abstract
Blasting in opencast mines is characterized by the use of large masses of explosives for a single blast. Blasting is done in a series of several to tens or even hundreds of charges placed in long holes and fired with a millisecond delay. Works are often carried out in the vicinity of buildings; therefore, reducing vibration impact is essential for opencast mines. This paper presents the applicability of the method of time-frequency Matching Pursuit (MP) for analysis of vibration structure. The use of MP analysis enables the development of much deeper and more reliable impact assessments of blasting on the environment.
1. Introduction
The detonation of explosive charges is a source of intense paraseismic vibrations. The vibrations can not only cause damage to buildings and other infrastructure in the vicinity of the works, but also be a nuisance for the people living there.
Ensuring the safety of facilities subject to paraseismic vibrations, propagating in the subsoil and transmitted onto buildings for a number of years, has been the subject of research aimed at creating both a scientific database and procedures enabling safe works with explosives. The research covers the following: geological structure of the blasting area and the surface promoting vibrations, the blasting technique, the forecast and the actual level of vibrations, the issue of building-substrate interactions, and finally monitoring and recording the impact on buildings.
The distinctive argument in the case of blasting induced vibrations in opencast mining is the fact that the parameters of the source of vibrations are known, and can be changed and adapted to the existing restrictions. In other words, the source of vibrations can be controlled [1-4]. It is possible to change the position of blasting, the weight of explosives, and the delay times between detonations of individual charges. So far, any change of sources have been practically associated with appropriately selecting the total weight of explosives or those related to the millisecond delay, depending on the distance between the place of the execution of works and the protected facilities. Very little attention has been paid to the manner of firing explosives (e.g. by selecting relevant millisecond delays), due to the restricted range of choice – a delay of 25 ms, increasable by 25 ms increments, in the case of electric firing.
The development of explosives, combined with mechanical loading into the holes (ANFO and emulsion explosives) and the emergence of modern explosive firing systems (non-electric and electronic systems) allow blasting contractors to largely control the seismic effect via vibration intensity and frequency. Improved tools do not always achieve the desired effect, reducing the impact of vibrations on the environment. It often happens that the mismatched firing parameters bring the opposite effect, and not necessarily only due to the increase in the intensity of vibrations.
The nature of the signals generated by detonations is variable, which means that vibrations require a highly individual approach and detailed analyses aimed at obtaining as much information as possible.
The intensity of vibrations and the frequency can be determined by [2, 4]:
a) Time domain analysis,
b) Frequency domain analysis - Fourier transform,
c) Time signal filtration – third octave analysis,
d) Short - Time Fourier Transform
e) Time and frequency domain analysis - Wavelet Transform,
f) An analysis of the frequency and time domain analysis – Matching Pursuit algorithm.
Matching Purusit algorithm (MP) was for the first time proposed for signal analysis in 1993 [5]. From that time is used to analyze different types of signals in different fields of science [6-11]. The Matching Pursuit (MP) algorithm is a new method for time – frequency analysis [4, 5, 10, 12] based on iteratively matching an entire set of functions to a signal, wherein, after each step of approximating a signal portion to which the given function is matched, it is subtracted, and other functions are compared to the rest of the signal. This enables the avoidance of unnecessarily re-describing the same parts of the signal. The functions being matched to the signal are determined with time - frequency atoms and are included in a broad set, known as a dictionary. In practice, a Gabor dictionary is used, comprising Gabor atoms, or Gaussian envelopes modulated by the sine function. The most optimal solution for the process of approximation is achieved when the elements of the function dictionary match the greatest percentage of signal energy. As signal decomposition progresses, the number of atoms being matched is finished and the remaining parts have less and less energy. The process of approximation of atoms to the signal is finite. The MP algorithm is stopped when approx. 95 % of the signal energy is matched (or after a predetermined number of repetitions), and the remainder is called approximation error (for example, the noise in the signal).
The examples of vibration analysis discussed later in the article will demonstrate the utility of the MP method in the analysis of the environmental impact of blasting.
2. Comparison of the results of vibration analysis using a variety of methods for analyzing signals
Research work aimed at selecting optimal millisecond delays often need to recognize the characteristics of vibrations propagated in the rock environment [2, 4, 13]. Carrying out mass blasting using millisecond detonators with ever greater precisions means that vibration frequencies associated with microsecond delay times are recorded by seismograms, which often significantly interfere with the image of vibrations, and makes it difficult to identify frequency variability, due to the type and quality of the substrate. Therefore, measurements of single charge detonation-induced vibrations are also carried out. The aim of such research is to obtain vibration characteristics specific to the given substrate, uninhibited by the millisecond firing of a series of charges.
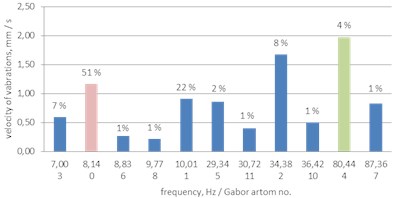
Fig. 1Example of a histogram of Gabor atoms
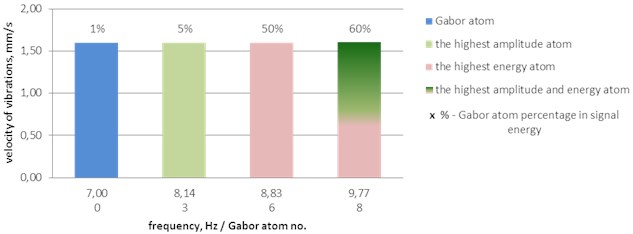
In order to illustrate how important the information is in the results of the time-frequency analysis, the results obtained are shown below for waveforms that were recorded during the firing of a single explosive charge and a series of explosive charges with a time delay, using a non-electric and an electronic initiation system.
Calculations were performed using the analytical methods mentioned above. As the MP method provides the possibility of presenting results in various forms, we use the Wigner-Ville map as the spatial image of the variation of energy factor and the frequency-amplitude histogram of Gabor atoms, taking into account their percentage share in explaining the signal energy.
Due to the large amount of information included in the figures presenting histograms of Gabor atoms, and for clarity in Fig. 1, an example of a histogram of Gabor atoms is shown as a legend for the figures presented in the following sections.
2.1. Analysis of the structure of vibrations induced by a single explosive charge
When firing a single charge in a marl mine, the vibrations registered were characterized by higher and lower frequencies. This can be seen in the seismogram shown in Fig. 2. Graphically, the results of the signal structure analysis are shown in Fig. 3-8.
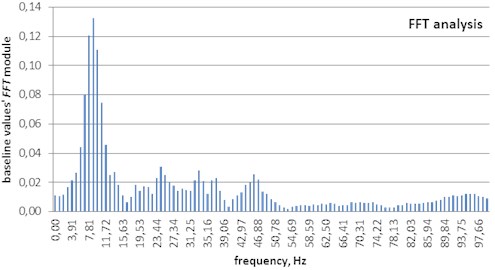
Calculations confirm the occurrence of varied vibration frequencies, but the indication of their participation in the image of vibrations is definitely different. The FFT analysis (Fig. 3) indicates the order of 8 to 10 Hz as the dominant frequency, but simultaneously signals higher frequencies, from 25 to 50 Hz; the third octave analysis (Fig. 4) signal frequencies being almost at the same level: the lower frequencies of 7.94 Hz and 10 Hz and the higher of 25.12 Hz to 100 Hz; the STFT and the wavelet method (Fig. 5) confirm these results and additionally show the time of the dominant frequencies – 0.5 s for higher frequencies and 1.5 s for the lower.
Fig. 2Record of ground vibrations – marl mine (single explosive charge)
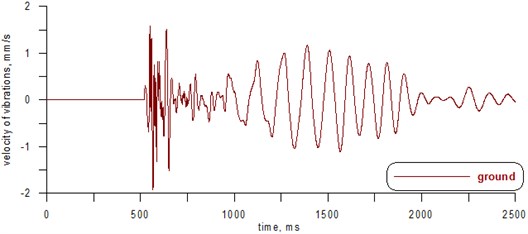
Fig. 3FFT analysis of vibrations shown in Fig. 2
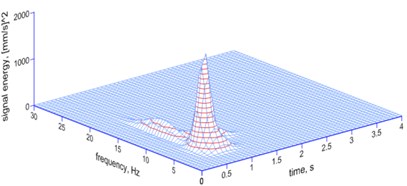
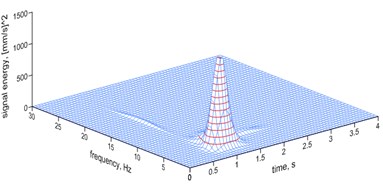
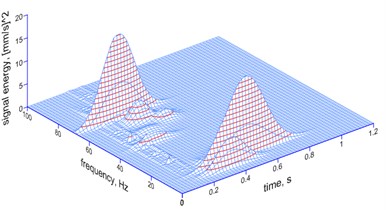
Figs. 5 and 6 show the results of analysis performed for the signal recorded in a real environment in the mine, where a single charge was fired. Analysis of Fig. 5 and 6 shows the advantage of the MP method over STFT and wavelet method. Despite the same information – the structure of time-frequency, MP method gives us a more accurate determination of the frequency and duration of its occurrence and the energy of the signal. The STFT analysis is the least accurate, slightly better analysis is continuous wavelet transformation.
Fig. 4Third octave analysis of vibration shown in Fig. 2
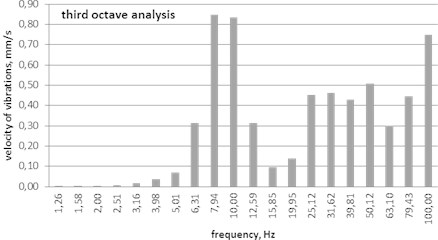
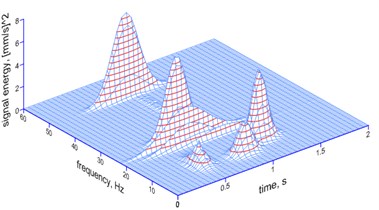
Fig. 5Results of the analyses of the vibrations shown in Fig. 2
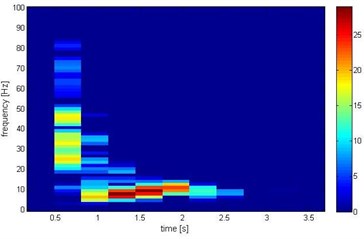
a) The STFT method
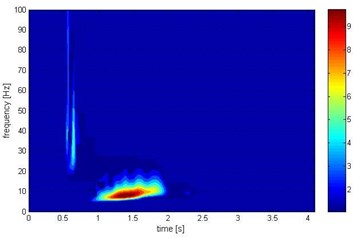
b) The wavelet method
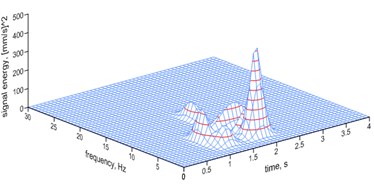
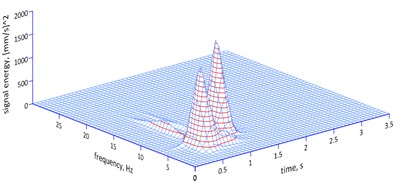
The result of the MP analysis, indicating the energy dominance of the 0/8.14 Hz atom (51 % of the energy of the signal) and highlighting the small share of the energy of the 4/80.44 Hz atom with the highest amplitude is intriguing. It follows that the dominance of frequency is determined by the atom stability (Fig. 6-8).
Fig. 6The Wigner-Ville map – the MP analysis of vibrations shown in Fig. 2
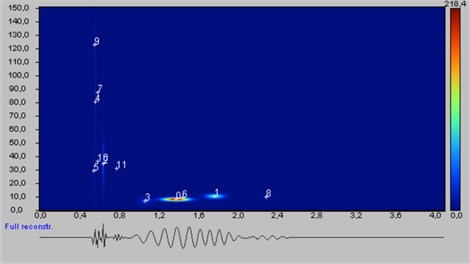
It should be added that the time domain (PPV) analysis provides information on the amplitude of the velocity associated with the 80 Hz frequency: it virtually ignores the very significant lower frequency which is indicated as dominant in the other methods of analysis.
Based on the above results, in the case of the measurements carried out simultaneously in several places in the vicinity of the excavation, differences in the composition of the ground can be concluded. A signal induced by a single explosive charge can be considered characteristic for the ground, as it is undisturbed by subsequently firing charges.
Fig. 7The MP analysis of the vibrations shown in Fig. 2 – spatial image
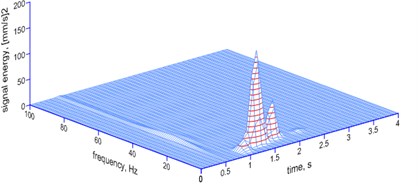
Fig. 8A histogram of Gabor atoms – MP analysis of the vibrations shown in Fig. 2
2.2. Comparison of the results of vibration analysis induced by explosives with different millisecond delays
Carrying out blasting works using more modern and more precise blasting systems for explosives makes it necessary to carry out analyses determining the influence of the millisecond delay on the intensity and the frequency of vibrations induced. The research conducted within the selection of the delay in the given conditions of works showed a tendency to vibrations of frequencies relevant for the applied delays. This applies both to the propagated vibrations in the ground and the vibrations recorded on the building’s foundation.
Determining of the possibility of such events in specific local circumstances requires the application of appropriate analytical instruments and examining the structure vibrations. The use of the MP algorithm for such analyses is shown below in a few examples of research conducted in different rock centers.
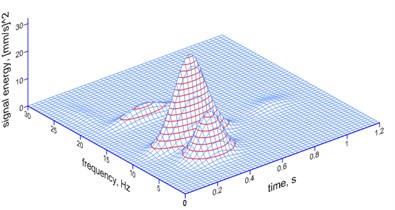
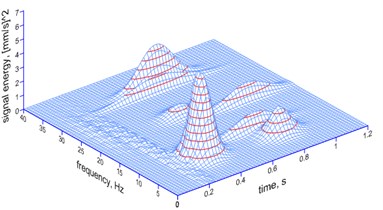
Fig. 9The MP analysis of ground vibrations induced by a millisecond explosive firing – a spatial image
a) 0 ms
b) 17 ms
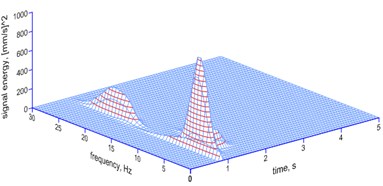
c) 42 ms
d) 67 ms
e) 109 ms
In the marl mine, experiments were conducted to determine the possibility of reducing the impact of blasting on the environment through the use of a suitable millisecond delay. As charges in the mine are fired with a non-electric system, delays of 17, 42, 67, 109 ms were applied.
Fig. 9 to 11 depict the results of calculations using the MP method. It follows from them that the length of the delay changes the dominant frequencies of vibrations. The points of reference for comparison purposes are the characteristics of vibrations induced by a single explosive charge.
Comparing the characteristics of vibrations induced by individual millisecond delays and the effect of a single explosive charge, it is possible to note that:
– the delay of 17 ms induces vibrations with a dominant frequency of 4.33 Hz (77 % of the energy of the signal), which is lower than the 6.21 Hz characteristic for a single charge;
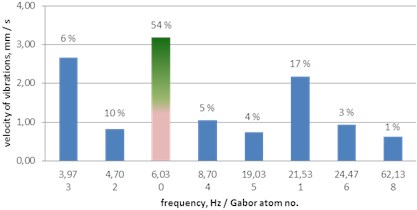
– the delay of 42 ms is most similar to the characteristics of a single charge (6.03 Hz – 54 % of the energy of the signal), but it also induces its own frequency of 21.53 Hz (17 % of the energy of the signal);
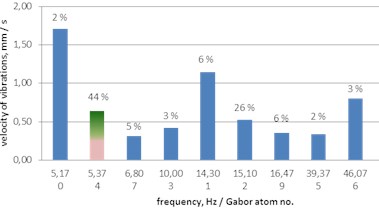
– the delay of 67 ms also lowers the dominant frequency to 5.17 Hz (44 % of the energy of the signal, and clearly induces its own delay frequency of 14.3 Hz (26 % of the energy of the signal));
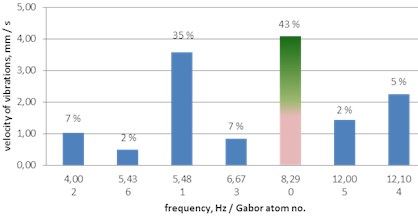
– the delay of 109 ms, as already mentioned, induces its own dominant frequency of 8.29 Hz (43 % of the energy of the signal).
Fig. 10A histogram of Gabor atoms – the MP analysis of ground vibrations a single explosive charge and a 17 ms delay
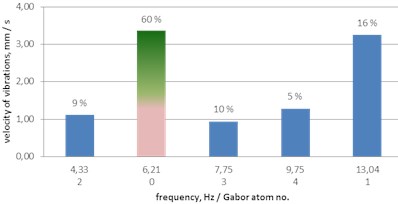
a) Single charge, 0 ms
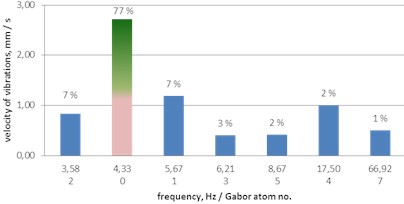
b) Delay of 17 ms
Fig. 11A histogram of Gabor atoms – the MP analysis of ground vibrations – delays of 42, 67 and 109 ms
a) Delay of 42 ms
b) Delay of 67 ms
c) Delay of 109 ms
In the case of a bed of marl where vibrations of lower frequencies are induced in the environment, the influence of the delays on the vibration characteristics is not as clear as in the case of a more resilient surface.
In order to illustrate this issue, Figs. 12 to 14 show the result of the analysis of ground vibrations and the vibrations of the building foundation, induced by explosive charges fired with an electronic system with a delay of 15, 20 and 30 ms, in a limestone mine.
Fig. 12The MP analysis of ground vibrations and foundation vibrations induced by a millisecond explosive firing (electronic firing) – a spatial image
a) Ground, 15 ms
b) Foundation, 15 ms
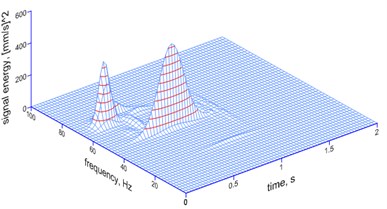
c) Ground, 20 ms
d) Foundation, 20 ms
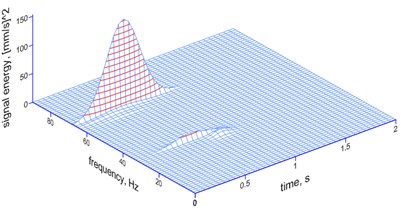
e) Ground, 30 ms
f) Foundation, 20 ms
The spatial image and the histograms of the results of the ground and foundation vibration analysis (Fig. 12-14) clearly show the effect of precisely applied millisecond delays:
– the 15 ms delay – two dominating frequencies: 11.36 Hz (26 % of the energy of the signal) and its own frequency of 69.76 Hz delays (29 %); at the transition of vibrations from the ground to the foundation, almost the whole energy of the signal is matched to the frequency of 6.64 Hz (30 %) and of 11.06 Hz (57 %); there is no suppression recorded at the frequency of 11 Hz;
– the 20 ms delay – the delay’s own frequency of 49.79 Hz is dominant (41 % of the energy of the signal) along with the frequency of 69.8 Hz (29 %); at the transition of vibrations from the ground to the foundation, the frequency of 49.79 Hz is still dominant, but higher frequencies are suppressed; attention is drawn to the fact that there was a strong sudden suppression;
– the 30 ms delay – the frequency of 67.92 Hz (78 % of the energy of the signal) is dominant, along with the delay’s own frequency of 33.61 Hz (8 %); the transfer of vibrations from the ground to the foundation modifies the structure of vibrations to the low frequencies of 9.17 Hz (41 % of the energy of the signal), 33.61 Hz (17 %) – strong suppression is recorded.
The given examples indicate how significant the influence of millisecond delays may be on the structure of blasting-induced vibrations, which may also affect the phenomenon of the building – ground interaction, crucial in the optimal selection of millisecond delays for local conditions.
What is more, the described examples show that the application of the MP method for the analysis of blasting-induced vibrations enables a quick overview of the variation of the given substrate structure, by specifying the structure of vibrations at various locations in the environment and by determining to what extent the use of millisecond delays may affect it.
Fig. 13A histogram of Gabor atoms – the MP analysis of ground vibrations - delays of 15, 20 and 30 ms
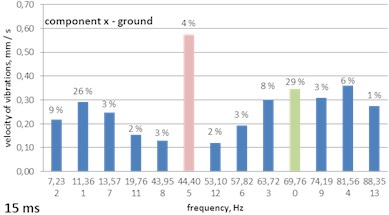
a) 15 ms
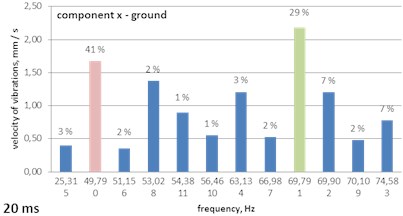
b) 20 ms
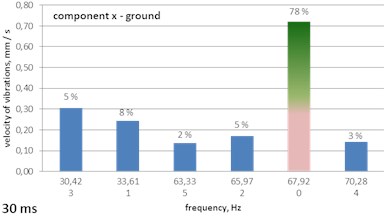
c) 30 ms
Fig. 14A histogram of Gabor atoms – the MP analysis of foundation vibrations – delays of 15, 20 and 30 ms

a) 15 ms
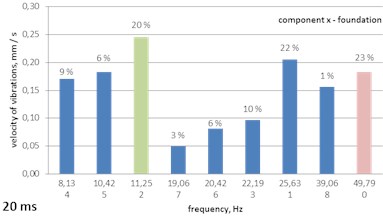
b) 20 ms
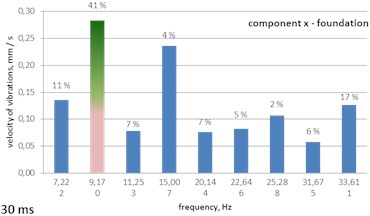
c) 30 ms
3. Conclusions
The assessment of the impact of vibrations induced during works with explosives is a difficult procedure, raising many doubts. One of the reasons for this is the varying nature of the events, with reference to continuous, waveform, harmonic vibrations.
The MP method opens up new possibilities in the search for relationships (dependencies) between:
– characteristics of the source, and the intensity and characteristics of vibrations propagated in the local geological-mining conditions;
– ground vibration characteristics and the degree of suppression in the transition to the foundations of protected facilities.
It also enables obtaining accurate information regarding the fact that:
– the percentage share of each frequency in the energy of the signal is important;
– the duration of individual signals of Gabor atoms has a significant influence on the intensity of vibrations – a short duration may represent a high amplitude of velocity, but a small percentage of the energy of the signal, while a longer duration may exhibit a low value of the amplitude of velocity, but also a large percentage of the energy of the signal, which may signal the need for taking it into account in assessing the impact of vibrations;
– in the case of firing explosives with a time delay, the delay’s own frequencies may occur, characteristic of the given delay, which can provide guidance in selecting delays appropriate for given explosive charges;
– the MP algorithm enables the precise indication of the Gabor atoms, and thus frequencies forming the vibration signal.
These are crucial elements for studying the propagation of vibrations surrounding the blasting area and evaluating their impact on facilities.
References
-
Dowding C. H. Blast Vibration Monitoring and Control. Northwestern University, Evanston, IL, 1985.
-
Pyra J. Influence of a Millisecond Delay on the Vibration Response Spectrum Which is Induced by Detonation of Explosives. Doctoral Dissertation, Mining and Geo-engineering Faculty, AGH University of Science and Technology, Cracow, 2011.
-
Pyra J., Sołtys A., Winzer J. Minimalisation of rock blasting impact on environment through structure modification of vibration created by blasting. Conference – New Techniques use of Explosives. GIG – Central Mining Institute, Katowice, 2014, p. 148-161.
-
Sołtys A. Analysis of the Vibrations Impact on the Environment Induced by Blasting Using the Method of Matching Pursuit. Doctoral Dissertation-Monograph, AGH University of Science and Technology, Cracow, 2015.
-
Mallat S., Zhang Z. Matching pursuit with time – frequency dictionaries. IEEE Transactions on Signal Processing. Vol. 41, Issue 12, 1993, p. 3397-3415.
-
Alcuda A. D. Microphone and Geophone Data Analysis for Noise Characterization and Seismic Signal Enhancement. M.Sc. Thesis, University of Calgary, 2009.
-
Durka P. J., Matysiak A., Martinez Montes E., Valdes Sosa P., Blinowska K. J. Multichannel matching pursuit and EEG inverse solutions. Journal of Neuroscience Methods, Vol. 148, Issue 1, 2005, p. 49-59.
-
Durka P. J. Matching Pursuit and Unification in EEG Analysis, Artech House, 2007.
-
Cuia Lingli, Wanga Jing, Leeb Seungchul Matching pursuit of an adaptive impulse dictionary for bearing fault diagnosis. Journal of Sound and Vibration, Vol. 333, Issue 10, 2014, p. 2840-2862.
-
Pyra J., Sołtys A. Method for studying the structure of blast-induced vibrations in open-cast mines. Journal of Vibroengineering, Vol. 18, Issue 6, 2016, p. 3829-4840.
-
Jiang Ruihong, Liu Shulin, Jiang Chao A method of fault diagnosis for rolling element bearings based on non-parametric atom matching. Journal of Vibroengineering, Vol. 16, Issue 7, 2014, p. 3317-3330.
-
Durka P. J. Between Time and Frequency: Elements of Modern Signal Analysis. 1999..2004. Script for the Lecture: Analysis of the Signal, Warsaw, 2004.
-
Winzer J. The Impact of Millisecond Delays in the Conducting Exploitation Blasting at the Frequency Vibration Characteristics of Land and Buildings on the Example of Deposits of Gypsum. Doctoral Dissertation, AGH University of Science and Technology, Cracow, 2004.
Cited by
About this article

