Abstract
This study presents data on the application of two different processing techniques of foot parameters and the comparison of their validity and reliability in adults. Twenty-four healthy participants volunteered took part in the study. Three digital scans were obtained from each participant by one experienced investigator. The foot parameters were: Clarke index, ‘KY’ index of Sztriter-Godunov, heel angle and Wejsflog index. The parameters were identified into two ways: manually using software SolidWorks and by a new computer-aided system. The results of the Spearman's rank correlation suggest a strong positive relationship between parameters obtained from the computer-aided system and manually counted (0.9). The current study suggests that computer-aided system is a practical tool for foot type assessment in adults and could be recommended for both research and clinical applications.
1. Introduction
The human foot is a complex mechanical structure that eliminates micro-vibrations and prevents them from causing negative changes in joints, internal organs, spine, and nervous system [1, 2]. Several studies [1-4] present different techniques for foot posture assessment: clinical assessment, radiological examination, contour graphic, digital footprints, and photographic techniques. Despite the controversy about the reliability, validity and variation in the measurement techniques of the foot, footprint images are still used to assess the foot. Processing of foot images is an actual topic in investigation domain of application of image processing methods. It generally refers to processing of two-dimensional picture by a digital computer. Laowattanatham et al. [5] presented a design of digital pedoscope for patients' screening with foot deformity. The scanned foot image was color-mapped by a software to calculate the foot index. In [6] Belyaev and Shubnikov proposed a method for horizontal and vertical foot contours restoration from digital images, and detection physical foot size with sufficient accuracy for shoe fitting applications. Research in the field of image processing is mainly focused on involvement automatic tasks for segmentation, that is, the detection of the objects represented, extraction of representative features from the objects, matching between images, rigid and non-rigid alignment of images, temporal tracking and motion analysis of features in image sequences, morphological operations, median filtration, intensity histogram, thresholding, linear filtering, convolution, Gaussian filter, erosion, dilation, methods for transmission of big-data biomedical images, and wavelet transform [7-10]. The main problem is to get as detailed image information as possible in order to obtain foot parameters. An algorithm for automatically calculation the foot parameters is desirable. Another currently recognized problem in image processing is separation in location and time the image scanning and validation. The remote access allows to validate scanned image in different places. With the development of Internet many new applications appeared in the field of remote diagnostics. However, it requires a proper throughput, strong real-time applications such as mobile monitoring [11-14, 16]. Zhang at al. [17] propose an embedded file system on chips which play a major role in the growth of IP networking. The mobile users can easily monitor and control systems in different places of long-distance. In [15] authors proposed the method of service-aware computing for uncertain mobile applications. The purpose of this study was first, to propose a new computer-aided system for automatic foot parameters identification based on images taken from a pedoscope. Second, we examined validity and reliability of the proposed system as a practical tool for assessment of foot posture in adult population by comparing with foot parameters counted manually. The integration of pedoscope with computer-aided system could be an important area of diagnostics.
2. Methods
We propose a new computer-aided system for foot parameters identification which consists of three steps: (1) definition of the input data, (2) running the system to determine the output, (3) comparison the output data obtained in step 2 with manually counted foot parameters. The foot measurements were taken using a pedoscope (QMS-396) and digital images. Subjects were asked to stand relaxed on a pedoscope. In this position, plantar region of the foot was measured with load exerted on it. To minimize parallax error, the picture was taken under a consistence pre-defined conditions including fixed measurement distance, identical parameters of the camera, accurate horizontal placement of the camera, silhouette positioning, and consistence lighting conditions. Camera-lens placement was corrected prior image, using a reference square pattern with known dimensions to minimize potential perspective error. The vibration acceleration was used to describe the severity of the vibration of pedoscope before each measurement. The measurement was performed using a real-time controller myRIO NI-1900 whit accelerometer sensor. The sensor parameters were contained in Table 1.
Table 1The sensor’s parameters
Number of axes | 3 |
Range | ±8 |
Resolution | 12 bits |
Sample rate | 1000 S/s |
Noise | 3,9 mgrmsat 25 °C |
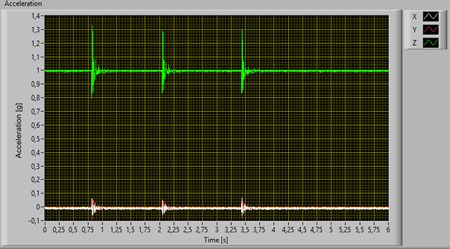
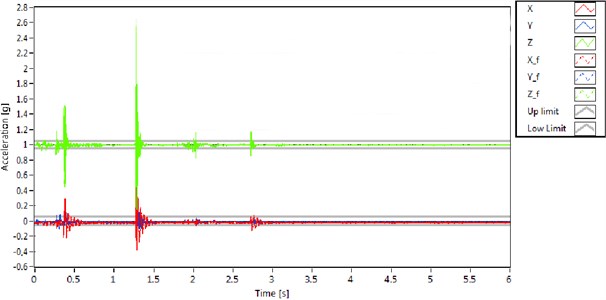
The RMS value was the most relevant measure of vibratory acceleration, because it takes the time history of the wave into account. The LabVIEW software (National Instruments) was used to pre-processing the wave of acceleration (Fig. 1). The frequency of measurement was 1 kHz, and time duration was 6 sec.
Fig. 1The software for pre-processing wave acceleration of pedoscope using LabVIEW software
A random group of 24 boys and girls, students of Bialystok University of Technology participated in the study. Subjects were free from lower-extremity injury at the time of testing. The foot parameters obtained from the computer-aided system were compared to the foot parameters counted manually.
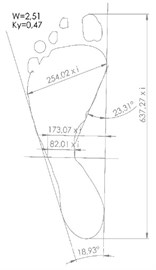
Criteria for rejection of the images were the following: if significant overshoot occurred during the transference of the body weight from the initial sitting to the final standing position, because in that case, the derived footprint parameters could be overestimated, and if the subject’s movement while acquiring the standing full weight-bearing position caused a significant degree of distortion to the print. Each subject’s footprint was assessed once and only by one experienced investigator assessed footprint parameters manually by using software SolidWorks (Dassault Systèmes SolidWorks Corp., USA). In total, 48 (24 subjects × 2 feet) images were analysed. We identified four variables: Clarke angle Fig. 2(a) – a measure of the longitudinal arch; ‘KY’ index of Sztriter-Godunov Fig. 2(b) – a measure of the transversal arch; Heel angle Fig. 2(c); Weysflog index Fig. 2(d) – other measures of the transversal arch [2]. All parameters were automatically calculated by a new computer – aided system and then compared to the parameters manually calculated after printing a photo taken from the pedoscope using a SLR camera (Canon EOS 5D 18-55 mm).
Fig. 2Foot parameters
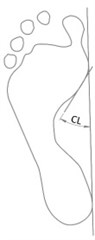
a) Definition of Clarke angle
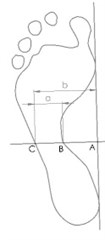
b) Definition of ‘KY’ index of Sztriter-Godunov
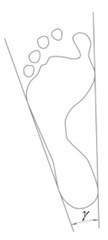
c) Definition of Heel angle
d) Definition of Weysflog index [2]
Foot posture was assessed as normal arch (Clarke angle > 42° and less than 48°), flat-foot arch (Clarke angle < 42°) or high-arch foot (Clarke angle > 55°) [2]. Printed footprints were de-identified and tested in a random order to minimize memory recall, thus minimizing potential bias in selection process between flat-feet, high-arch feet and normal arch posture.
‘KY’ index of Sztriter-Godunov Fig. 1(b) was defined according the Eq. (1) [2]:
Using calculated Sztriter-Godunov index, foot posture was assessed as normal (‘KY’ index in the range 0.26-0.45), flat (‘KY’ index > 0.45) or high-arch foot (‘KY’ index < 0.25) [2].
Heel angle refers to the angle between two tangents Fig. 1(c). The typical value of the heel angle is 15-18 degrees.
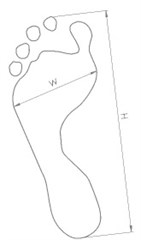
The widely used index for the evaluation of foot is the Weysflog index (WI) [2], while to evaluate the proportions of feet the most accurate is the length () and width () index. The ratio of the length to the width of the foot should be 3. Usually the value of WI is between 2-3. The WI value closer to 2 indicates flat foot, while the WI value closer 3 indicates normal foot [2]. Forefoot width (mm) was measured from the lateral border of the 1st metatarsophalangeal joint to the lateral border of the 5th metatarsophalangeal joint. The total foot length (mm) was measured from the posterior heel to the longest toe (Fig. 2(d)).
All digital photos were downloaded onto a PC where they were processed using Image Processing Toolbox (MATLAB R2012, USA). The median filter, filter function, conversion to black and white, function filling the closed boxes and inversion of the color were used in next step. The foot images (separately for the right and the left side) were the input data for further analysis. The following algorithms were implemented in C# using the library Emgu CV. Emgu CV is a cross platform .Net wrapper to the OpenCV (Open Source Computer Vision) image processing library. Finally, developed computer program was designed to work for Windows [18].
The proposed software works on 2D images of foot. The black and white images obtained from pedoscope were used to determine such foot parameters as: Clarke angle (CL), Sztriter-Godunov index (KY), Wejsflog index (WI) and heel angle (Gamma). To determine those parameters, new algorithms to detection the characteristic points of the foot as well as ready-made image processing algorithms were used (Fig. 3). The first step of the algorithm is loading the image of the foot and rotation the image by 9 degrees toward the inner side of the foot. For the left foot, it is clockwise rotation and for the right foot is anti-clockwise rotation. The value of foot rotation depends on the references lines placed on the pedoscope.
Fig. 3The algorithm of the computer application
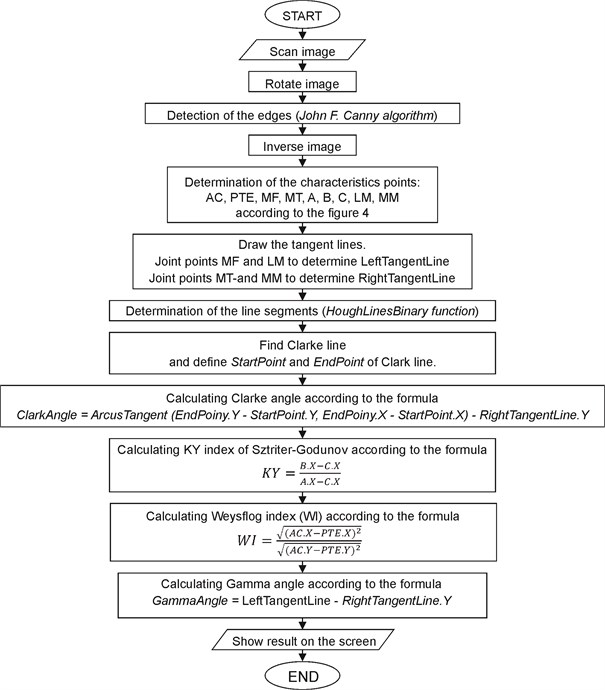
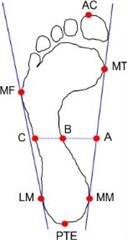
The Canny function from library Emgu CV was used to detection the edges on the image. This function detects the edges using a detection algorithm John F. Canny (Canny edge detection). The obtained images were used as a base for determining the foot parameters. To determine the feet parameters the characteristic points of the foot were defined (Fig. 4): Ptornion (PTE) – is the most posterior point of the heel of the foot when the subject is standing; Lateral Malleolus (LM) – the most lateral point of lateral malleolus; Medial Malleous (MM) – the most medial point of the medial malleous; Metatarsale fibulare (MF) – is the most lateral point on the head of the 5th metatarsal of the foot when the subject is standing; Metatarsale tibaile (MT) – is the most medial point of the head of the 1st metatarsal of the foot when the subject is standing; Acropodion (AC) – is the most anterior distal point of the longest phalange of the foot when the subject us standing.
Fig. 4The characteristic points of the foot
In order to determine the Clarke, angle the image has been converted to binary and the HoughLinesBinary function from library EmguCV was used. This function uses probabilistic Hough transform to find line segments.
Results were expressed as means ± standard deviation (SD). The degree of correlation between the value of all measurements obtained from the computer-aided system and manually counted were determined using Spearman’s rank correlation . A two-sample test was used to determine differences in parameters for categorical variables (e.g. gender). Paired tests were then used to examine any differences between left and right parameters. The significance level was set at 0.05. Statistical analyses were performed using Statistica 10.0 (Stat Soft, Tulsa, OK, USA).
3. Results
The vibrations of pedoscope were measured six times. The average time arrangement was 2.58 (0.50) sec (Fig. 5).
Fig. 5The measurement of acceleration
A two-sample test showed no gender differences in the all parameters. Hence, the data from the male and female participants were pooled together in subsequent analyses. Their mean (±SD) age was 20.1±0.6 years, body height – 172±8 cm, body mass – 63.7±9.51 kg. The differences between left and right foot were not statistically significant ( 0.05). Subjects were assessed to flat-foot, high-arched foot, and normal arch based on Clarke angle, ‘KY’ index of Sztriter-Godunov, Heel angle, and Weysflog index as described before. All participants did not claim having foot pain during activity of daily living.
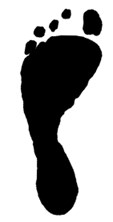
The pictures from podoscope after digital processing for all subjects are presented in Fig. 6.
The window of the program is shown in Fig. 7. The program performs the algorithm operations in the average time equal to 23 ms. The measured time is displayed on the title bar.
Fig. 6Foot types collected from podoscope after digital processing
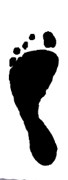
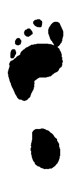
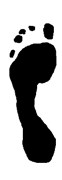


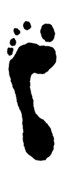
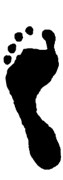
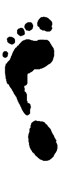
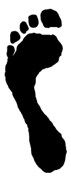
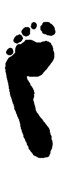
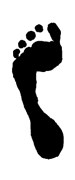
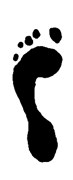
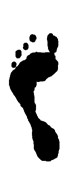
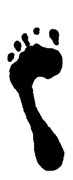
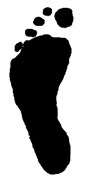
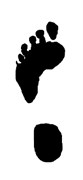
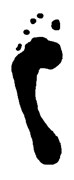
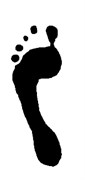
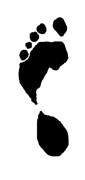
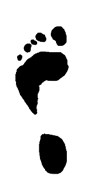
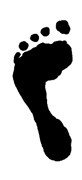
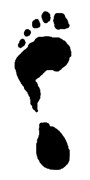
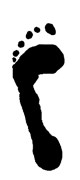
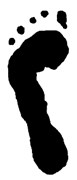
Fig. 7Foot parameters
a) Footprint obtained from pedoscope after digital processing
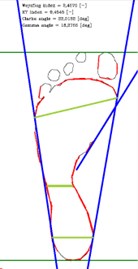
b) Foot parameters obtained from the computer-aided system
c) Foot parameters counted manually
The mean value of foot parameters are presented in Table 2. The results suggest that foot parameters calculated manually using a pedoscope and digital images were of a similar reliability to the same parameters derived using a computer-aided system. The Spearman’s rank correlation suggests a strong positive relationship between parameters from computer-aided system and the parameters counted manually ( 0.9). The differences between parameter’s value obtained from the two methods were not statistically significant ( 0.05). However, the parameters counted manually are subjective and depend on experimenter’s experience. We think that clinicians still need a useful computer-aided system for foot type assessment.
Footprint analysis is a fast, simple, non-invasive, cost-effective indirect method. While the different methods used to acquire footprints use ink, vaseline, or carbon powder [8]. We have used pedoscope, digital photographs, and digital imaging technology to footprints acquirement. We believe that we minimized at present existing problems connected with footprint analysis.
Table 2Mean values (±SD) of foot parameters
Variable | Computer-aided system | Manual | Comparison computer-aided system vs. manual | ||
Mean | Mean | Difference | -value | ||
Clarke angle [degree] | 40.9 (11.3) | 39.6 (10.9) | 1.3 | 0.65 | 0.97 |
‘KY’ index of Sztriter-Godunov | 0.42 (0.1) | 0.45 (0.1) | –0.03 | 0.48 | 0.98 |
Heel angle (Gamma) [degree] | 17.3 (2.4) | 17.3 (2.4) | 0.00 | 0.94 | 0.97 |
Weysflog index | 2.56 (0.15) | 2.53 (0.14) | 0.03 | 0.45 | 0.93 |
4. Conclusions
The current study suggests that computer-aided system is a practical tool for foot type assessment in adult population and could be recommended for both research and clinical applications. Results suggest that between manual counted parameters and those obtained from computer-aided system no significant differences. The proposed system/method can be used by clinicians or parents as an easy tool in quantifying medial arch, and potentially determine prospective foot deformity not only in adults, but also in children.
References
-
Pauk J., Ihnatouski M., Najafi B. Assessing plantar pressure distribution in children with flatfoot arch. application of the Clarke angle. Journal of the American Podiatric Medical Association, Vol. 104, Issue 6, 2014, p. 622-632.
-
Kasperczyk T. Abnormalities of Body Posture – Diagnosis and Treatment. Kasper, Krakow, 2004.
-
Lee J. H. Clinical or radiologic measurements and 3-D gait analysis in children with pes planus. Pediatrics International, Vol. 51, Issue 2, 2009, p. 201-205.
-
Billis E., Katsakiori E., Kapodistias C., et al. Assessment of foot posture: correlation between different clinical techniques. The Foot, Vol. 17, Issue 2, 2007, p. 65-72.
-
Laowattanatham N., Chitsakul K., Tretriluxana S., Hansasuta C. Smart digital podoscope for foot deformity assessment. Biomedical Engineering International Conference (MEiCON), Japan, 2014.
-
Belyaev Yu S., Shubnikov V. G. Estimating a human foot size from images. Telecommunication and Control Systems, Vol. 2, Issue 193, 2014, p. 23-30.
-
Zhang D. G., Kang X. J. A new SC-based method of non-line wavelet shrinkage denoising. Information, Vol. 15, Issue 1, 2012, p. 141-148.
-
Zhang D., Kang X. A novel image de-noising method based on spherical coordinates system. EURASIP Journal on Advances in Signal Processing, Vol. 110, 2012, p. 1-10.
-
Zhang D., Wang X., Song X. New medical image fusion approach with coding based on SCD in wireless sensor network. Journal of Electrical Engineering and Technology, Vol. 10, Issue 6, 2015, p. 2384-2392.
-
Zhang D. G., Li W. B. Novel fusion computing method for bio-medical image of WSN based on spherical coordinate. Journal of Vibroengineering, Vol. 18, Issue 1, 2016, p. 522-538.
-
Zhang D., Zheng K., Zhao D. Novel quick start (QS) method for optimization of TCP. Wireless Networks, Vol. 22, Issue 1, 2016, p. 211-222.
-
Zhang D., Li G., Zheng K. An energy-balanced routing method based on forward-aware factor for wireless sensor network. IEEE Transactions on Industrial Informatics, Vol. 10, Issue 1, 2014, p. 766-773.
-
Zhang D., Wang X., Song X. A novel approach to mapped correlation of ID for RFID anti-collision. IEEE Transactions on Services Computing, Vol. 7, Issue 4, 2014, p. 741-748.
-
Zhang D., Zhu Y. A new constructing approach for a weighted topology of wireless sensor networks based on local-world theory for the Internet of things (IOT). Computers and Mathematics with Applications, Vol. 64, Issue 5, 2012, p. 1044-1055.
-
Zhang D., Liang Y. A kind of novel method of service-aware computing for uncertain mobile applications. Mathematical and Computer Modelling, Vol. 57, Issues 3-4, 2013, p. 344-356.
-
Zhang D., Zheng K., Zhang T. A novel multicast routing method with minimum transmission for WSN of cloud computing service. Soft Computing, Vol. 19, Issue 7, 2015, p. 1817-1827.
-
Zhang D., Zhang X. Design and implementation of embedded un-interruptible power supply system (EUPSS) for web-based mobile application. Enterprise Information Systems, Vol. 6, Issue 4, 2012, p. 473-489.
-
Rafajlowicz E., Rafajlowicz W., Rusiecki A. Image Processing Algorithms and an Introduction to Working with the OpenCv Library. Academic Publishing House, Wroclaw, 2009.
About this article

The paper is supported by Bialystok University of Technology, Project No. S/WM/1/2016.
