Abstract
In order to improve the calculation accuracy of vibration response in drum washing machine isolation system, a new CAE method is proposed for dynamics analysis and parameter optimization according to the rigid-flexible coupling technology of virtual prototype. With the vector loop algorithm, the motion differential equation of the vibration isolation system is solved based on Lagrange method, and the key parameters that affect the vibration response are acquired. In terms of simulation research, the modal neutral file (MNF) of the shell body is established by the software ANSYS for modal analysis, and it is exported into software platform ADAMS/Vibration to establish the rigid-flexible coupling model. Through the coupling model, the kinetic characteristics are calculated in continuous excitation frequency domain (0-20 Hz). The experimental verification is accomplished by LMS Test.Lab device, of which results shows that the rigid-flexible coupling simulation method is definitely accurate and feasible. Meanwhile, 15 “hot spots” of the shell body are obtained from the ADAMS/Durability module, which can provide an important basis for structure design. Then, the spring stiffness and damping coefficient is synthetically optimized by sensitivity analysis method with 9 time’s iterative calculation, which has a great significance for product development.
1. Introduction
The vibration isolation system of drum washing machine belongs to multiple freedom system [1], and its vibration response is difficult to be researched by experiment method under the condition of continuous excitation frequency. However, the traditional CAE method is based on rigid multi-body dynamics theory and always causes errors because that the shell body which is made by sheet metal shows obvious flexibility during the work process. The vibration isolation system could determine the stability, noise and service life of the whole machine [2, 3]. In order to improve the reliability of the dynamics analysis results and reduce the amplitude of vibration respond, a rigid-flexible coupling technology based on virtual prototype is proposed in the paper.
With fully consideration of sheet metal parts deformation effects, the dynamic response [4] of the vibration isolation system could be calculated more accurately with the integrated application of ANSYS and ADAMS. In the paper, the motion differential equation of vibration isolation system will be solved by Lagrange method, which can conclude the key affective factors of vibration amplitude. Based on sensitivity calculation, the theory of optimization design is applied to conclude the best parameter (spring stiffness and damping coefficient) to establish an optimization scheme under different optimization objectives. The new CAE method for analysis and optimization can provide a certain technical support for the kinematics and mechanics research, which has great significance for the design and development of the drum washing machine.
2. Vibration isolation system mathematical model
2.1. Mechanical model
Generally, the vibration isolation system of drum washing machine mainly needs two hanging springs and two air dampings to keep dynamic balance [5], except those super large capacity ones. Theoretically, the mechanical model could be established based on rigid body assumption and small displacement hypothesis [6]. As shown in Fig. 1, a mechanical model of the drum washing machine is established, which is idealized and discretized. In the model, is the quality of eccentric mass, is the spring stiffness and is the damping coefficient.
Fig. 1Mechanical model diagram
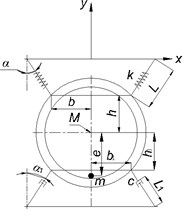
a) Static balance condition
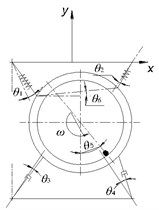
b) Motion condition
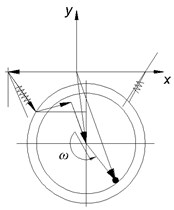
c) Vector mechanics model
2.2. Mechanical energy
The kinematic parameter of the vibration isolation system is difficult to be calculated because its vibration movement is uncertain under multi degree freedom. To solve the problem, the paper uses Lagrange method to express the vibration isolation system dynamic characteristics [7, 8]. In generalized coordinates, the Lagrange dynamics equation can be established as in Eq. (1):
where is the kinetic energy, is the potential energy and is the dissipation energy, which can be calculated using Eq. (2-4). As shown in Fig. 1(c), the solution of Eq. (1) can be obtained by vector loop algorithm method:
where and respectively are cylinder mass and eccentric mass, and are inertia moment of cylinder part and eccentric mass, and are linear velocity of cylinder part and eccentric mass, is the angular velocity of inner drum, is spring static deformation, and are dynamic deformation of left spring and right spring, and are displacement of left damper and right damper, is height variation of barycenter, is rotational angular displacement.
Among Eq. (2-4), , and can be expressed as in Eqs. (5-7):
where , , , , , and are dimension parameter as shown in Fig. 1.
2.3. System differential equations
In order to express the vibration movement, the motion differential equations [9] can be processed and expressed based on Lagrange dynamics equation as shown in Eq. (8):
During Eq. (8), the coefficient matrix are respectively mass matrix, damping matrix and stiffness matrix, which can be calculated by using Eqs. (9-26):
According to the solution of the movement differential equation, it can be found that the main parameters which affect the system vibration are spring stiffness, suspension angle, damping coefficient, installation angle, system quality and moment of inertia.
3. Virtual prototype model of rigid-flexible coupling
3.1. Flexible body definition
In this section, finite element software ANSYS [10] is applied for the establishment of the rigid-flexible coupled virtual prototype. After model calculation, the software ANSYS will output modal neutral file (MNF), including quality attributes and modal characteristics of the flexible shell body.
The parameter settings of the shell body are shown as in Table 1. During the flexible body definition, there are two kinds of element type, the mass21 and the shell63, as shown in Fig. 2. The function of mass21 element type is to build coupled nodes between the rigid and flexible units and simulate the relay transmission with infinitesimally small quality unit. Therefore, among the connection points between spring, damper and the shell, the mass21 element type is applied to mesh 4 key points which are generated by the force interface nodes, and the mass and inertia moment of the mass21 are set as 1×10⁻⁶, nearly close to zero. The shell63 has stress rigidity and large deformation ability, which can withstand plane bending, so the shell body is meshed by Shell63 element type with the grid number of 37389 and nodes number of 36679.
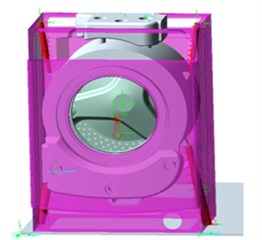
Using the interface software Mech/pro, parametric model established by software Pro/E can be outputted to the software ADAMS with complete rigid form as shown in Fig. 3. Then, the modal neutral file that generated from ANSYS replaces the rigid shell part. In order to ensure that the barycenter is precisely coincident between the flexible body and rigid body, the coordinate system needs to be aligned.
Table 1Parameter settings
Density (kg/m3) | Elasticity modulus (MPa) | Poisson’s ratio | Mass (kg) | Inertia moment (kg·m2) |
7800 | 2.06×10⁵ | 0.3 | 1×10⁻⁶ | 1×10⁻⁶ |
Shell63 Element type | Mass21 Element type | |||
Fig. 2Element setting
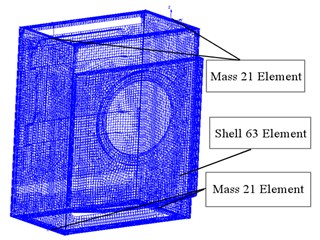
Fig. 3Assembly model
3.2. Flexible body modal characteristics analysis
In the modal analysis, the system dynamics equation can be converted to eigenvalue problem as follows:
where [] is the structure of the total mass matrix; [] is the total stiffness matrix for structure; is the natural frequency. Generally, according to the finite element method [11], the calculation error will increase with the modal number increasing. Therefore, only the first six order natural frequency (shown in Table 2) that calculated by ANSYS is activated can be used as the reference for analysis. The first and second shell body model shape is shown in Fig. 4, and it can be seen that the maximum deformation position is located in both sides of the wall.
Table 2Nature frequency of the shell body
Mode number | Frequency (Hz) | Mode number | Frequency (Hz) |
1 | 42.297 | 4 | 49.664 |
2 | 48.583 | 5 | 60.620 |
3 | 48.936 | 6 | 73.769 |
Fig. 4Typical deformation at nature frequency
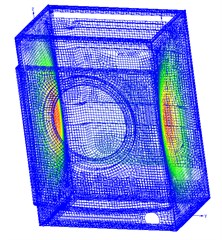
a) First mode shape
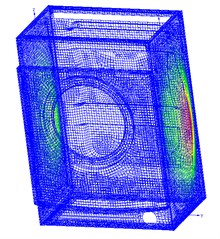
b) Second mode shape
4. Dynamic simulation and analysis
4.1. Preprocess setting
The time domain features are used for the system dynamic characteristics mainly, but not for the dynamic response. Therefore, the frequency domain [12] analysis of the vibration isolation system is put forward in this section which is based on ADAMS/Vibration platform. According to the industry test requirements of the washing machine, the mass and distance of the eccentricity is respectively defined as 0.3 kg and 235 mm in simulation conditions. The center mass displacement of upper balance is located in (vertical) and (horizontal) direction and the exciting forces from the shell suspension points are defined as output channel. Because the maximum speed of the washing machine is 1200 RPM, the vibration frequency range is set as 0.01 Hz-20 Hz.
4.2. Spring stiffness variables analysis
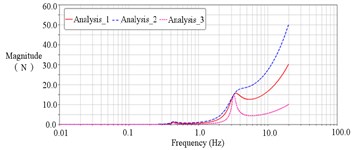
The simulation of frequency domain response is conducted in different spring stiffness variables [13] in this section. The spring stiffness value is set as 7.5 N/mm (Analysis_1), 10 N/mm (Analysis_2) and 5 N/mm (Analysis_3) respectively, then the output channels can be calculated as shown in Fig. 5.
Fig. 5Response contrast under different spring stiffness
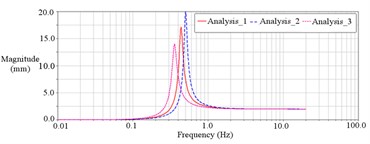
a) direction displacement response spectrum
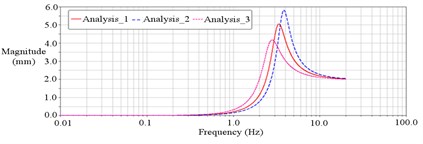
b) direction displacement response spectrum
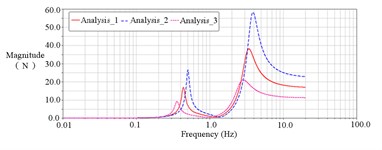
c) Spring force response spectrum
It can be seen that the resonance frequency of the system is rising along with the increasing of spring stiffness, displacement and resonance peak force. To conclude, under the condition of allowed carrying capacity, if the spring stiffness increases, the vibration will be amplified.
4.3. Damping coefficient variables analysis
Using the same scheme, the damping coefficient value is settled with three different value, including 0.15 N/(mm/s) (Analysis_1), 0.25 N/(mm/s) (Analysis_2) and 0.05 N/(mm/s) (Analysis_3). The calculation results are shown in Fig. 6. It can be seen apparently that damping coefficient is irrelevant variable for the system resonance frequency.
According to the simulation results of response contrast characteristics, it can be found that the amplitude of resonance point displacement decreases with the increasing of damping coefficient, as well as the damping force. Thus, if the damping coefficient is too small, there will be no damping effect. Otherwise, if the damping coefficient is too large, the instability of the whole machine model on the ground will be decreased.
Fig. 6Response contrast under different damping coefficient
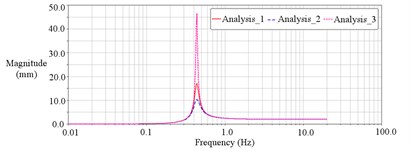
a) direction displacement response spectrum
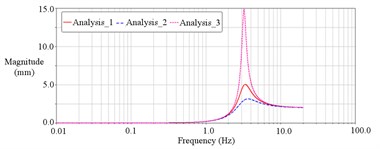
b) direction displacement response spectrum
c) Damper force response spectrum
4.4. Experimental verification
In order to ensure the reliability of the simulation results, the displacement response of the vibration isolation system is tested on the LMS Test.Lab device, as shown in Fig. 7(a). The initial parameters definition of the experiment is settled as follows: the spring stiffness is set as 7.5 N, the damping coefficient is set as 0.15 N, and the mass of eccentric block that fixed to the inner cylinder wall is set as 0.3 kg. Two acceleration sensors locate in the center of the upper balance weight surface for displacement test of direction and direction, as shown in Fig. 7(b). According to the motor control program and transmission ratio, the starting characteristics of inner cylinder are measured and filtering processed, as shown in Fig. 8(a).
Fig. 7Experimental condition
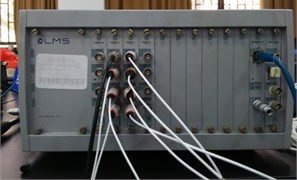
a) Test device
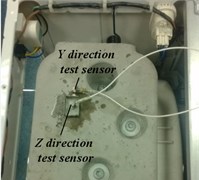
b) Test sensor installation
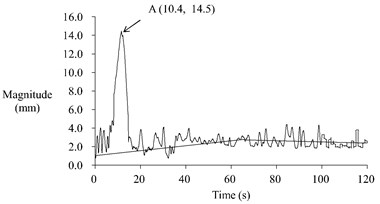
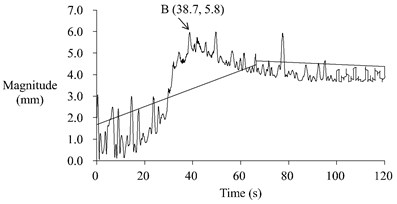
In the test process, the displacement amplitude of the measured point in the direction and the direction can be obtained by wave filtering and numerical integration, as shown in Fig. 8(b) and Fig. 8(c). From the measuring results of Fig. 8(a) and Fig. 8(b), it can be seen that the maximum displacement in direction is 14.5 mm, and appears at the time of 10.4 s (at point A), while the inner cylinder is at the speed of 30 r/min (0.5 Hz), which is in accordance with the Analysis_1 in Fig. 5(a). Similarly, from Fig. 8(a) and Fig. 8(c), it can be seen that the maximum displacement in direction is 5.8 mm, and appears at the time of 38.7 s (at point B), while the inner cylinder is at the speed of 216 r/min (3.6 Hz), which is in accordance with the Analysis_1 in Fig. 5(b). As a result, the simulation method is proved to be accurate and feasible.
Fig. 8Experimental measuring results
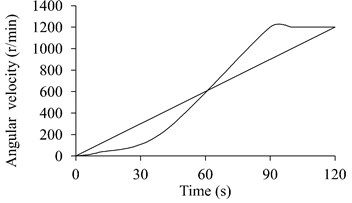
a) Angular velocity condition
b) direction displacement
c) direction displacement
4.5. Dynamic response analysis of flexible shell body
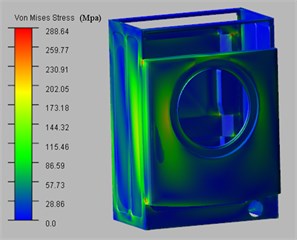
From Table 2, the first order natural frequency of shell body is 42.297 Hz, which is relatively close to the highest vibration frequency of 20 Hz under the normal operating conditions Because the stress suffered by enclosure is changing all the time, the static stress analysis can’t meet the design requirements of accuracy. Therefore, the paper uses ADAMS/View to calculate dynamic stress of the shell body, as shown in Fig. 9(a), which can consider the stress response of the flexible body for failure structure inspection.
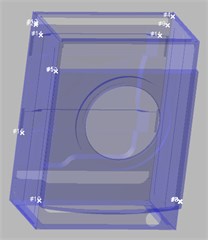
At the same time, in order to improve the stiffness of the shell body properly, ADAMS/Durability module is used for calculating the operation process of “hot spots”, as shown in Fig. 9(b). Through the results, 15 positions (“hot spots”) which stand for the maximum stress is distributed and the easiest failure structure are marked in the whole running condition.
Fig. 9Dynamic response analysis
a) Dynamic stress
b) Hot spots
5. Optimization
5.1. Selection of optimization variables and object
As we all know, the major vibration comes from the centrifugal force of eccentric mass. According to multiple degrees of freedom vibration theory, the vibration amplitude of the isolation system with synchronous rotation eccentric mass can be expressed as follows:
where and are respectively the eccentric mass and inner cylinder angular velocity, , and are respectively the total mass, spring stiffness and damping coefficient of the isolation system. The parameter of and are calculated as follows:
where is resonance speed.
According to Eq. (29), ignoring the effect of balance weight, the optimization variables respectively are settled as DV_1 (standard spring stiffness value of 7.5 N/mm) and DV_2 (standard damping coefficient value of 0.15 N/(mm/s)). The variable types are real, and the optimization value range is 50 %.
The system state equation is settled as , so the optimization problem [14-16] can be converted as follows:
where is design variables, is the objective function, stands for the design variable extremum. In order to ensure that the transient barycenter displacement and the shell force is minimum, the optimization object function [17, 18] was settled as follows:
where and are barycenter displacement in and direction as OB_1 and OB_2, and are suspension point force in top and bottom position as OB_3 and OB_4.
5.2. Sensitivity calculation and design study
The sensitivity is expressed as the gradient changes of the independent variables, which can show the potential relationship between performance parameters and structural parameters. Using the parameter to design variable and sensitivity to measure the vibration, the objective function method is advanced and appropriate, which plays an important role in dynamic model optimization and modification. Using the sensitivity as evaluation factor can improve optimization efficiency evidently.
In essence, sensitivity is the derivative between objective function and the optimization variables. Assuming that the objective function of the system is , the design parameters is (1, 2, 3,...), the sensitivity can be calculated as follows:
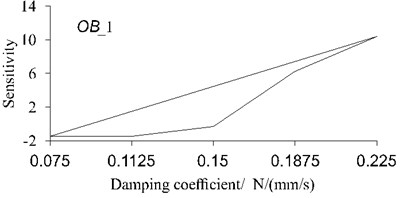
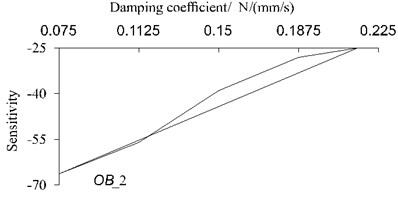
During the optimization process, the purpose of sensitivity calculation is providing basis for design study, of which results can be obtained in ADAMS environment. In order to make sure the sensitivity is comprehensive; the research level of the sensitivity calculation is set as 5 for each design variable and target function. According to Eq. (34) and ADAMS/insight, the sensitivity of these four optimization objects are acquired under different spring stiffness and damping coefficient as shown in Fig. 10 and Fig. 11, of which results can provide an important basis for parameter optimization. Through the continuous iterative computation with virtual prototype technology, the design study results are obtained in Table 3 and Table 4, including those four optimization objectives as shown in Eq. (32) and Eq. (33).
Fig. 10Sensitivity calculation for different spring stiffness
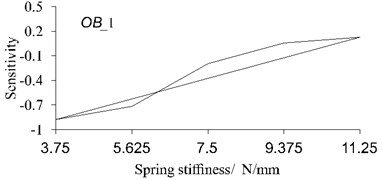
a) Sensitivity of OB_1
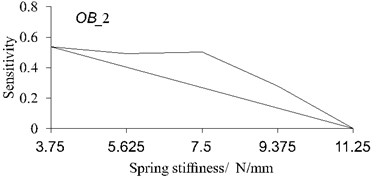
b) Sensitivity of OB_1
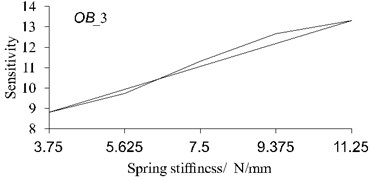
c) Sensitivity of OB_3
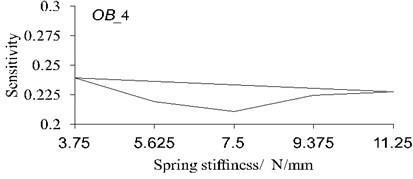
d) Sensitivity of OB_4
As shown in Fig. 8 and Table 3, the design study results of spring stiffness can be concluded as followed: (1) Barycenter displacement in direction has minimum value because the sensitivity is changed from negative to positive during 5.625-9.375. (2) The maximum amplitude in direction tends to be constant because the sensitivity is nearly zero when the spring stiffness value is 11.25. (3) The load of suspension point increases along with spring stiffness.
Table 3Design study results of DV_1
Trial | DV_1 (N/mm) | OB_1 (mm) | OB_2 (mm) | OB_3 (N) | OB_4 (N) |
1 | 3.750 | 8.934 | 12.461 | 24.022 | 62.059 |
2 | 5.625 | 7.292 | 13.466 | 40.562 | 62.508 |
3 | 7.500 | 6.240 | 14.303 | 60.455 | 62.881 |
4 | 9.375 | 6.572 | 15.345 | 83.000 | 63.297 |
5 | 11.25 | 6.817 | 15.348 | 107.93 | 63.724 |
Table 4Design study results of DV_2
Trial | DV_2 (N/(mm/s) | OB_1 (mm) | OB_2 (mm) | OB_3 (N) | OB_4 (N) |
1 | 0.0750 | 6.350 | 18.503 | 92.938 | 31.314 |
2 | 0.1125 | 6.296 | 16.013 | 78.760 | 47.064 |
3 | 0.1500 | 6.240 | 14.030 | 60.455 | 62.881 |
4 | 0.1875 | 6.3187 | 13.087 | 50.912 | 78.734 |
5 | 0.2250 | 6.709 | 12.190 | 43.813 | 94.602 |
From Fig. 9 and Table 4, conclusions can be obtained as followed: (1) There is a minimum displacement in direction when the damping coefficient value is between 0.1125-0.15. (2) The influence of damping coefficient is similar for OB_2 and OB_3. (3) Damping coefficient has a huge impact on suspension point force in bottom position.
Fig. 11Sensitivity calculation for different damping coefficient
a) Sensitivity of OB_1
b) Sensitivity of OB_1
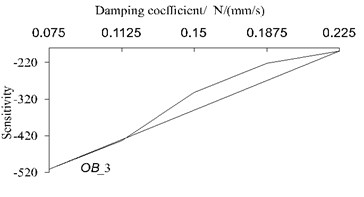
c) Sensitivity of OB_3
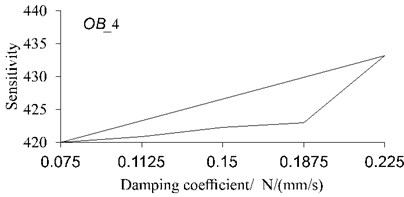
d) Sensitivity of OB_4
5.3. Optimization results
The optimization results can be obtained by experiment design module in ADAMS, which can provide proper design consideration for the isolation vibration system. After the calculation of 9 trials, the best parameter combinations and optimization objects are obtained in Table 5. It can be seen that the spring stiffness value is chosen as the range of 5.625-9.375, while damping coefficient is chosen in the range of 0.1125-0.15. The key factors that affect the system vibration, such as suspension angle, installation angle, system mass and moment of the inertia all can be optimized for vibration attenuation.
Table 5Optimization variables calculation results
Trial | OB_1 (mm) | OB_2 (mm) | OB_3 (N) | OB_4 (N) | DV_1 (N/mm) | DV_2 (N/(mm/s) |
1 | 6.907 | 14.824 | 48.387 | 46.788 | 5.625 | 0.11250 |
2 | 7.087 | 14.100 | 44.216 | 54.642 | 5.625 | 0.13125 |
3 | 7.292 | 13.166 | 40.562 | 62.508 | 5.625 | 0.15000 |
4 | 6.295 | 16.013 | 73.750 | 47.064 | 7.500 | 0.11250 |
5 | 6.268 | 15.089 | 66.486 | 54.966 | 7.500 | 0.13125 |
6 | 6.240 | 14.303 | 60.455 | 62.881 | 7.500 | 0.15000 |
7 | 6.610 | 17.112 | 90.786 | 47.371 | 9.375 | 0.11250 |
8 | 6.606 | 16.168 | 90.799 | 55.329 | 9.375 | 0.13125 |
9 | 6.572 | 15.345 | 83.000 | 63.297 | 9.375 | 0.0150 |
6. Conclusions
The idealized and discretized mechanical model of drum washing machine isolation vibration system is established and analyzed in the paper. The mass matrix, damping matrix and stiffness matrix are calculated by the Lagrange dynamics equation and the motion differential equation, which concludes the key factors that affect the system vibration. Mode neutral file of shell body is convert by finite element software ANSYS with Shell63 element and Mass21 element. After model calculation, the mode neutral file is imported to ADAMS environment for rigid-flexible coupling virtual model. According to the washing machine industry test requirements, the dynamic response with continuous excitation frequency of 0-20 Hz is researched under different spring stiffness and damping coefficient. The experiment that based on the LMS Test.Lab device proves the accuracy and feasibility of the CAE method. In the dynamic operation, former 15 hot spots are obtained, which can provide basis for structure optimization. Sensitivity analysis method is used in the optimization calculation, which can offer an excellent optimization scheme. On the basis of the proper selections for spring stiffness and damping coefficient based on sensitivity, the best parameter combinations and optimization objects are obtained by ADAMS, which has great significance for new product research.
References
-
Zuo Y. Y. Drum washing machine chassis dynamic characteristics analysis. Noise and Vibration Control, Vol. 3, 2007, p. 55-58.
-
Chen Z. Noise and vibration control study of drum washing machine. Journal of South China University of Technology, Vol. 25, 1997, p. 78-72.
-
Qin Z. Y. Eccentric incentive multi-rigid-body though laser equations of vibration system modeling. Mechanical Strength, Vol. 29, 2007, p. 544-547.
-
Liu W. Q. Damping efficiency analysis with balance device. Noise and Vibration Control, Vol. 6, 2010, p. 72-75.
-
Conrad D. C., Soedel W. On the problem of oscillatory walk of automatic washing machines. Journal of Sound and Vibration, Vol. 188, 1995, p. 301-304.
-
Almeida R. A. B., et al. Identification of rigid body properties from vibration measurements. Journal of Sound and Vibration, Vol. 29, 2007, p. 884-899.
-
Kim W., Lee S. K., Jo H. J. Optimized washing method for performance improvement of a washing machine for boxthorn berries. The Korean Journal of Community Living Science, Vol. 24, 2013, p. 187-194.
-
Kim J. Y., Park Y., Ch Yun S. Comparison of environmental and economic impacts caused by the washing machine operation of various regions. Energy Efficiency, Vol. 8, 2015, p. 905-918.
-
Boyraz P. Dynamic modeling of a horizontal washing machine and optimization of vibration characteristics using genetic algorithms. Mechatronics, Vol. 23, 2013, p. 581-593.
-
Zheng Y. Computer simulation study of washing machine vibration process. Vibration, Test and Diagnosis, Vol. 21, 2001, p. 544-547.
-
Wei Y. D. Drum washing machine dynamics modeling and its equalizer design. Journal of Tianjin University, Vol. 20, 2001, p. 77-80.
-
Qian J. Top mounted washing machine vibration modeling and dynamic characteristics analysis. Journal of Vibration and Shock, Vol. 20, 2001, p. 77-80.
-
Sh Yi Y., Sh Chen D. The effect of structure parameters change of two-stage vibration isolation system on structure vibration. Ship Engineering, Vol. 26, 2004, p. 43-47.
-
Duan H. J., Tao H. Random vibration isolation and parameter optimization on two-stage vibration isolation system in vehicle. Noise and Vibration Control, Vol. 3, 2007, p. 79-82.
-
Gupta S., Liu W. F., Degrande G., et al. Prediction of vibrations induced by under ground railway traffic in Beijing. Journal of Sound and Vibration, Vol. 310, 2008, p. 608-630.
-
Wang X. F. SQP algorithms in balancing rotating machinery. Mechanical Systems and Signal Processing, Vol. 21, 2007, p. 1469-1478.
-
Shi P. Ch., Li W. J. Mounting system optimization based on vibration transmissibility and energy decoupling. Advanced Manufacturing Technology, Vol. 26, 2009, p. 16-21.
-
Que Y. Ch., Li Sh. X., Hui Y. Vibration isolating system optimization design based on minimum transmissibility. Noise and Vibration Control, Vol. 5, 2007, p. 79-82.
About this article

