Abstract
To study the effect of on energy performance and unsteady characteristics of the single-channel pump, the experimental tests about the energy characteristics, head pulsation, pressure fluctuation and radial force have been conducted by the synchronous test. 3 different impellers with the blade outlet angle of 8°, 16° and 25° respectively are studied. The results show that with the increase of from 8° to 25°, the head increases gradually and the maximum increase amplitude reaches 22.6 %. As changes from 8° to 25°, there is a maximum efficiency. The mixing loss at the impeller outlet can be decreased by reducing . With the increasing of , the minimum head in time domain gradually lag and the maximum head gradually advances. The pressure fluctuation in each measuring point shows the trend of increasing first and then decreasing with the increasing of the flow rate. With increasing, the radial force also increases and the maximum increase amplitude of minimum radial force is larger than 8 %. The research can provide some reference for the optimization of single channel pumps.
1. Introduction
As the favorable no-clogging performance of the single channel pump, it has been the key facilities in sewage treatment. However, due to the highly asymmetry structure of the single channel impeller, the unsteady characteristics is obvious during its operation, such as huge head fluctuation and radial force pulsation. Therefore, it is important to control instability of the single channel pump.
Berna [1] simulated the inner flow in a single blade pump, and the results show that the head pulsation increases with the increasing of flow rate. At different flow rate, the maximum head and the minimum head all appear at the same impeller rotation position. Daly [2] simulated the inner flow in the single blade pump. The results show that the blade position has little effect on pressure distribution in impeller, while the pressure distribution in volute changes obviously with the impeller rotating. The high pressure domain appears at the downstream of blade outlet edge and the low pressure domain appears at upstream of blade outlet edge, which agrees well with the head pulsation. Siekmann [3] studied the effect of wrap angle (from 289° to 420°) on the radial force in a single blade pump and found that with the increase of wrap angle the radial force gradually increases at 0.5 and gradually decreases at the design and large flow rate. Nishi [4-6] studied the radial force of the single channel impeller by experiments carefully and the results show that the radial force mainly comes from flow induced force on impeller.
The research above mainly focused on the head pulsation, pressure fluctuation and radial force of the pump and the geometric parameters have obvious influence on the performance of the single channel pump.
What is well known that the influence of the on the energy characteristic and inner flow is pretty complex. Wu [7] studied the effect of the on the performance curve of centrifugal pump and indicated that the has more effect on high specific speed centrifugal pump. Tan [8] researched the effect of the blade outlet angel on the energy performance and indicated that the has an importance effect on the jet-wake structure in the centrifugal pump. So, the has more effect on the middle and high speed centrifugal pumps. Therefore, the as a significant parameter of single channel pump is set as the study variable.
Hence, a single channel pump, whose specific speed is 140, is selected as the research model and a synchronous experiment rig was built to reveal the influence of the on the energy performance and the unsteady characteristics of the single channel pumps. The research findings can be set as the foundation of establishing the design method for unsteady reliability of the single channel impeller applied to engineering practice by further research.
2. Test model and rig and scheme
2.1. Test model
The main geometrical and hydraulic data of the model pump are displayed in Table1.
2.2. The test rig
It is shown as the Fig. 1 that an opened-loop test rig was conducted to test the energy performance and unsteady characteristics of the single channel pump. The tested pump was driven by a variable speed electric AC submersible motor controlled by a frequency converter. The test apparatus includes the magnetic flow meter, Hall induction coil, three-phase power acquisition instrument, static pressure transfer, pump parameters acquisition instrument and pump parameter analysis software.
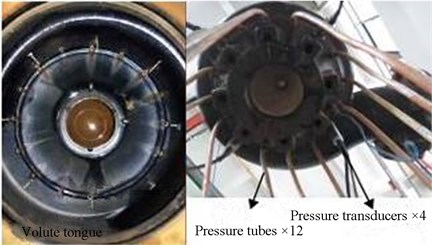
The pressure measuring points were distributed at impeller outlet to obtain the unsteady characteristics of the pump [9]. As shown the Fig. 2, the 16 pressure measuring points were set at the impeller outlet in an absolute coordinate and the angle between two consecutive measuring points is 22.5°, and P1 is at 0°. The measuring points on the model pump are presented in Fig. 3. Pressure fluctuation was measured by the waterproof pressure transducers (HY6305 series) at P2, P6, P10 and P14. And the other 12 monitoring points was connected by flexible pipes and used to measure pressure.
Table 1Main geometric parameters and hydraulic data
Geometric parameters | Symbol | Value |
The impeller inlet diameter (mm) | 125 | |
The impeller outlet diameter (mm) | 300 | |
The impeller outlet width (mm) | 100 | |
The blade inlet thickness (mm) | 10.5 | |
The blade outlet thickness (mm) | 5.15 | |
Blade wrap angle | 340° | |
The blade inlet width (mm) | 115 | |
Design parameters | ||
Flow rate (m3/h) | 220 | |
Head (m) | 20 | |
Rotational speed (r/min) | 1474 | |
Fig. 1Test rig
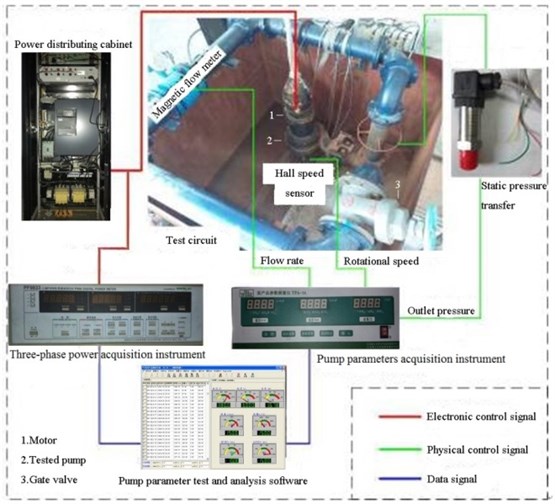
Fig. 2The coordinate and measuring points
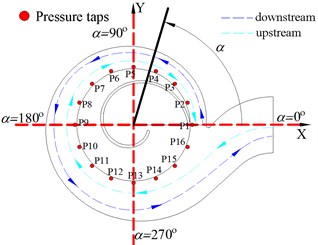
Fig. 3The measuring points on the model pump
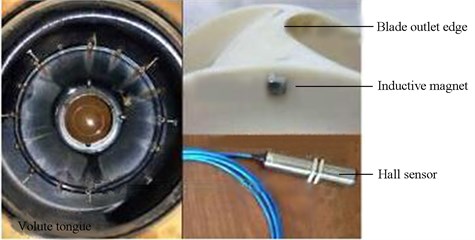
The impeller position was monitored by Hall sensor [10, 11]. As shown in Fig. 4, the sensor was installed at the volute tongue and the inductive magnet was fixed on the blade outlet edge. When the blade outlet passes the tongue, the Hall sensor gives a square pulse signal. To show impeller position conveniently, is applied to indicate the impeller rotation angle. The impeller rotation angle is 0° when blade outlet edge just sweeps across the tongue.
Fig. 4The installation of Hall sensor
2.3. Test schemes
To study the effect of the on the energy performance and unsteady characteristics, 3 schemes were designed, namely the is 8°, 16° and 25° respectively. Three impeller models are shown in Fig. 5.
Fig. 5Impellers with different blade outlet angle
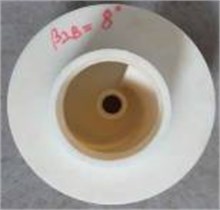
a) 8°
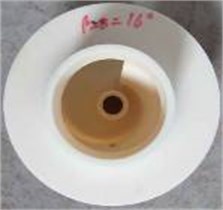
b) 16°
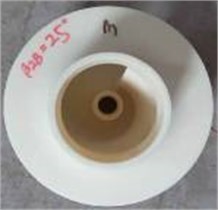
c) 25°
3. Results and discussion
3.1. The effect on the energy characteristics
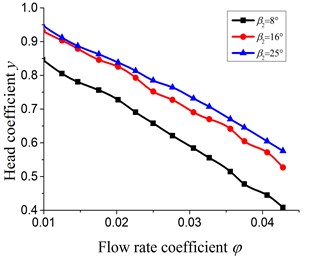
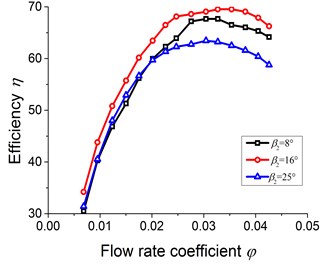
The pump head and efficiency under different blade outlet angles are shown in Fig. 6.
From Fig. 6(a), it can be seen that pump head all decreases gradually with the increase of flow rate under different . With the increase of , the pump head gets bigger. What is obvious is that the increase amplitude is different with the variation of . When the changes from 8° to 16°, the increase amplitude of head at design flow rate is 15.7 %, while it is 22.3 % as the varies from 16° to 25°. Therefore, the increase amplitude of head gradually decreases as increases.
It can be found from the Fig. 6(b) that pump efficiency reaches the maximum while the flow rate coefficients respectively is 0.0306, 0.0345, 0.0321, corresponding to 1.09, 1.23 and 1.15, under of 8°, 16° and 25°. At the design flow rate and large flow rate, the effect of on efficiency is more obvious. As the varies from 8° to 16°, under all flow rates the efficiency increases. In this case, the maximum efficiency increases 6.48 percentages. When the changes from 16° to 25°, under all flow rates the efficiency decreases. Under the circumstances, the maximum efficiency decreases 2.18 percentages. At small flow rate, even the efficiency of pump with of 25° is smaller than that of pump with of 16°. So, the effect of on pump efficiency is more complicate than that on pump head.
The explanation for this phenomenon may be the diversity effect of . With the increase of , although the pump head would increase, the hydraulic loss of flow separation and shock also would increase.
Fig. 6The performance curves under different β2
a) The head curves
b) The efficiency curves
3.2. The effect on the mixing loss
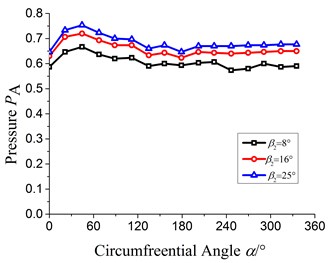
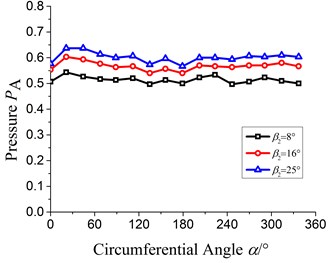
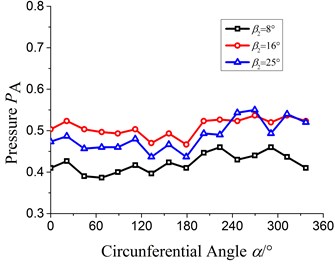
Because the of the single channel impeller is far greater than the multi-blade centrifugal pump, the uniformity of the velocity and pressure at the impeller outlet isn’t good obviously, which means the maxing loss at the impeller outlet is huge. The static pressure distribution at impeller outlet can be used to represent the mixing loss between impeller outlet and volute inlet. The more uniform the static pressure distribution is, the less the mixing loss is [12, 13]. So, the static pressure distribution is tested by the 16 measuring points at the impeller outlet. To analyze conveniently, non-dimensional treatment for pressure signal was applied, and the formula is .
Fig. 7 shows the static pressure distribution at impeller outlet under 0.6, 1.0 and 1.4. It is seen that at 0.6, the maximum pressure all arises at 45° under different and under of 8°, 16° and 25°, the maximum pressure is 0.66, 0.72 and 0.75 respectively. At 1.0, the maximum pressure appears between 22.5° and 45° and under of 8°, 16° and 25°, the maximum pressure is 0.54, 0.60 and 0.65 respectively. At 1.4, the maximum pressure occurs at 300°, 270° and 270° respectively under of 8°, 16° and 25° and the corresponding maximum pressure is 0.45, 0.54 and 0.52 respectively.
According to the above analysis, it can be concluded that the pressure at impeller outlet increases with the increasing. The high pressure region gradually moves to downstream of volute with the increase of flow rate. With the increase of , the pressure at the impeller outlet gets more non-uniformity, especially under large flow rate, which would result in more hydraulic loss.
In order to quantitatively describe the non-uniformity of static pressure distribution at the impeller outlet, the non-uniformity of the static pressure distribution is defined and obtained by the Eq. (1):
The Fig. 8 shows the non-uniformity of the static pressure distribution under different . From 0.4 to 1.2, the becomes larger with the increase of . At 1.0, as the varies from 8° to 16°, the increase amplitude of is 11 percentages, while it is 15 percentages as the varies from 16° to 25°.
It is clear that the minimum occurs at 1.0, 1.2 and 1.2 respectively under of 8°, 16° and 25°. Combined with Fig. 6(b), it can found that the mixing loss is the least at the best efficiency point.
Therefore, as the increases from 8° to 25°, the non-uniformity of the static pressure distribution and its increase amplitude all increase, which means the mixing loss gradually increases.
Fig. 7The static pressure distribution at impeller outlet
a) 0.6
b) 1.0
c) 1.4
Fig. 8The non-uniformity of static pressure at the impeller outlet
3.3. The effect on the head pulsation
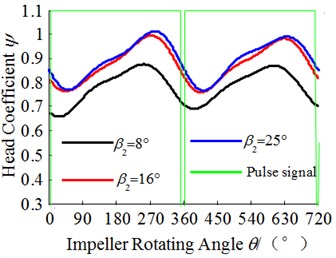
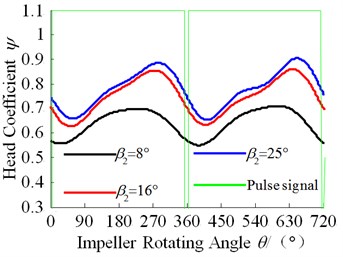
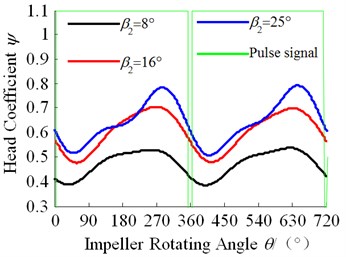
To study the effect of on the head pulsation, the test results of the head pulsation are shown in the Fig. 9. The horizontal coordinate represents the impeller rotation angle. When 0°, 360° and 720°, the low pulse signal means the blade outlet just sweeps across the tongue.
It can be seen from the Fig. 9 that all head pulsation curves are similar under different flow rates and blade outlet angles. Also, all head pulsation curves change periodically with . In each rotation circle, there are a maximum head and a minimum head.
Fig. 9Head pulsation in time domain
a) 0.6
b) 1.0
c) 1.4
What can be seen from the Fig. 9(a) is that the time domain of the maximum head and the minimum head is affected by the changing of and the impeller rotating angle corresponding to the minimum head at each respectively is 28°, 43° and 55°, and the rotating angle corresponding to the maximum respectively is 255°, 280° and 290°.
What is shown in the Fig. 9(b) is that the impeller rotating angle corresponding to the minimum head at each respectively is 30°, 50°, 62° and the rotating angle corresponding to the maximum head respectively is 247°, 278° and 289°.
As shown in Fig. 9(c), the impeller rotating angle corresponding to the minimum head at each respectively is 39°, 62°, 49.5° and the rotating angle corresponding to the maximum head respectively is 230°, 270°, 288°.
From the above analysis, the minimum head pulsation occurs between 28°-62°, and the minimum head in time domain indicates gradually lag with the increasing of . However, it doesn’t agree well with the former conclusion at large flow rate (1.4), which needs to be explored carefully in the future. The maximum head pulsation occurs between 230°-290° and it gradually advances with the increasing of .
The explanation for above conclusion may be the below analysis. When increases, the fluid velocity at the impeller outlet increases and the angle between the fluid velocity and the casing tongue angle is positive incidence, and then the kinetic energy translates into the pressure after it collides with the fluid in the volute ahead. And then the high pressure domain moves to the upstream along the volute profile and this condition brings about that the head in time domain shows hysteresis.
More than above, the head of this pump increases with the increasing of , which keeps in line with Fig. 6(a). Meanwhile the amplitude of the head pulsation shows the increasing trend, especially in large flow rate.
3.4. The effect on the pressure fluctuation
In order to analyze the pressure fluctuation quantitatively, the pressure fluctuation coefficient is defined as the following Eq. (2):
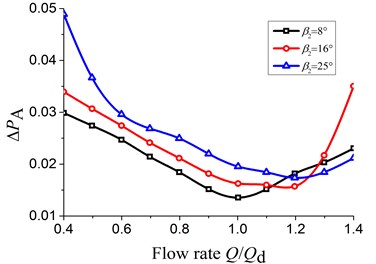
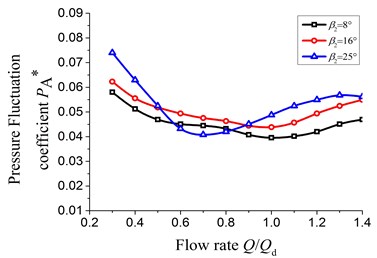
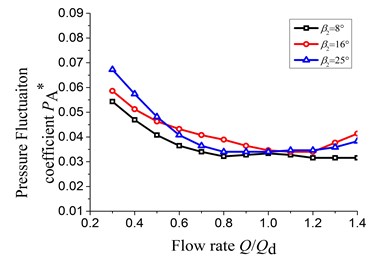
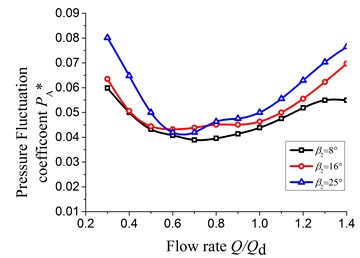
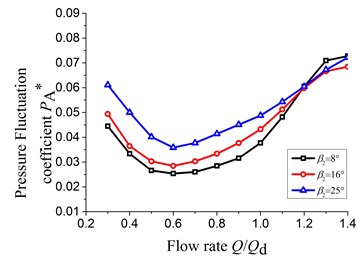
The Fig. 10 shows the pressure fluctuation of P2, P6, P10, and P14 under different flow rates.
The pressure fluctuation coefficient at P2 and P6 exits larger value under the small flow rate and is about 1.5 to 2 times under large flow rate. The pressure fluctuation coefficients get larger values under small and large flow rate at the P10 and P14. And compared to the large flow rate, the pressure fluctuation coefficient is small under the small flow rate; The maximum increasing amplitude of the pressure fluctuation coefficient in the four measuring points under the large flow rate respectively is 28.35 %, 22.4 %, 35.33 % and 40.0 % and the changing amplitude under the small flow rate respectively is 20.58 %, 23.11 %, 40.14 % and 13.6 %. Therefore, the maximum changing amplitude of the pressure fluctuation coefficient occurred at the P10 corresponding to the sixth section of the volute.
Fig. 10The pressure fluctuation at impeller outlet
a) P2 measuring point
b) P6 measuring point
c) P10 measuring point
d) P14 measuring point
Meanwhile the pressure fluctuation coefficients in each measuring point show the trend of increasing first and then decreasing with the increasing of the flow rate. The reason for this phenomenon is that absolute velocity angle of the fluid at the impeller outlet under small flow rate is not only less, but also positive incidence relative to the casing tongue angle. And then the velocity of fluid becomes bigger after flowing into the volute from the casing tongue and there will generate impulsion because of the difference in speed and direction between the high speed fluid flowing into the volute and the fluid in the volute. Therefore, the pressure fluctuation is more intense at P2 and P6 measuring points under small flow rate. Under the large flow rate, the flow velocity from the impeller outlet keeps accelerating along the flow direction and this velocity achieves maximum around at P10 and P14 measuring points. Therefore, the pressure fluctuation coefficient arise larger value at P10 and P14 measuring points in the volute.
3.5. The effect on the radial force
The radial force can be obtained by integration for the pressure of measuring points [14, 15] at impeller outlet along volute spiral channel and this can be considered as the reaction of fluid induced radial force in impeller. With this method, the measured radial force is the average value within a period of time, and defined as .
The effect of on the distribution of average radial force within a rotation period is presented in Fig. 11.
Fig. 11The radial force curves
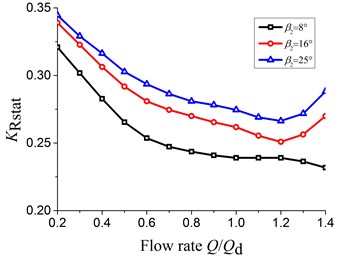
With the increasing of flow rate from 0.2 to 1.2, the radial force decreases gradually. When the flow rate is bigger than 1.2, the radial force under of 16° and 25° starts to increase. So, under of 16° and 25°, the minimum of radial force is all at 1.2, which is about the best efficiency point. Consequently, when is equal to or bigger than 16°, the has no effect on position of minimum radial force.
When 8°, the minimum radial force is 0.23. As the 16° and 25°, the minimum radial force is 0.25 and 0.26 respectively. Hence, with increasing, the minimum radial force also increases and the maximum increase amplitude is larger than 8 percentages.
What can be seen easily form the picture above is that as is equal to 8°, the radial force always decreases with the increasing of the flow rate. The reason may be that the load distribution at the blade outlet and the circumferential uniformity are small enough, which leads to radial force smaller. Meanwhile the flow separation and secondary flow can be suppressed since the is smaller, which causes the time-average radial force still decreases when the flow rate increases. Nevertheless when is equal to or bigger than 16°, the redial force represents first decrease and then increase.
On the other hand, the radial force increases at each flow rate condition with the increasing of . The reason of the effect of on the radial force is that the circumferential uniformity of the static pressure at the impeller outlet becomes bigger, and meanwhile the increasing amplitude of the static pressure at the impeller shows the trend of deceasing with the increasing of the blade outlet angle. Because the radial force is obtained by integration agrees with the changing of the uniformity of the static pressure at the impeller outlet.
4. Conclusions
The effect of the on the energy and unsteady characteristics of the single channel pump have been studied via the synchronous testing method. Some conclusions can be concluded.
1) With the increasing of the from 8° to 25°, the head represents the gradually increasing and the maximum increase amplitude gets touch with 22.6 %. The efficiency has the maximum value and the maximum increase is 6.48 percentage points. The mixing loss occurring at the impeller outlet can be decreased by reducing the .
2) With the increasing of , the minimum head in time domain gradually lag and the maximum head gradually advances. And meanwhile the amplitude of the head pulsation shows the increasing trend, especially in large flow rate.
3) The pressure fluctuation coefficients in each measuring point show the trend of increasing first and then decreasing with the increasing of the flow rate and the maximum changing amplitude of the pressure fluctuation coefficient occurred at the P10 corresponding the sixth section of the volute.
4) The radial force increases as the increases. The changing of the radial force is related to the static pressure at impeller outlet, which has a significant effect on the radial force under each blade outlet angle.
References
-
Benra F. K., Dohmen H. J. Investigation on the time-variant flow in a single-blade centrifugal pump. Proceedings of the 5th WSEAS International Conference on Fluid Mechanics, 2008, p. 59-64.
-
Daly J., De Souza B., Niven A., et al. Numerical simulation of transient flow and head distribution through a single blade centrifugal pump impeller. Proceedings of the 4th WSEAS International Conference on Fluid Mechanics and Aerodynamics, 2006, p. 343-348.
-
Siekmann H., Stark M. Analytical and experimental study of the hydrodynamic unbalance of single-vane impellers. 3rd International Symposium on Transport Phenomena and Dynamics of Rotating Machinery, Honolulu, HI, 1990, p. D-28A.
-
Nishi Y., Fukutomi J., Fujiwara R. Radial thrust of single-blade centrifugal pump. ASME-JSME-KSME Joint Fluids Engineering Conference, American Society of Mechanical Engineers, 2011, p. 43-51.
-
Nishi Y, Fukutomi J., Sakai M. Study on unsteady hydrodynamic force of closed-type centrifugal pump with single-blade. Transactions of the Japan Society of Mechanical Engineers Series B, Vol. 78, Issue 788, 2012, p. 837-849.
-
Nishi Y., Fukutomi J. Effect of β2 on unsteady hydrodynamic force of closed-type centrifugal pump with single blade. International Journal of Rotating Machinery, 2014.
-
Wu X. F., Tan M. G., Liu H. L., Wang Y., Wang K. Research on effects of centrifugal pump outlet angle on the shape of performance curves. Journal of Agricultural Research, Vol. 32, Issue 9, 2010, p. 166-169.
-
Tan M. G., Liu H. L., Yuan S. Q., Wang Y. CFD research on the effect of centrifugal pump outlet angles on the characteristics of energy. China Rural Water and Hydropower, Vol. 11, 2008, p. 104-106.
-
Li S., Dong C. H., Wang Z. C., Xu Y., Yan Y. J., Zhai D. L. Study on the vibration characteristics of structural of hydrocyclone based on fluid structure interaction. Journal of Measurements in Engineering, Vol. 4, Issue 2, 2016, p. 103-111.
-
Luo Y., Sun H., Lu J. X. Review for sensorless detection technology applied in centrifugal pumps. Journal of Drainage and Irrigation Machinery Engineering, Vol. 33, Issue 6, 2015, p. 547-552.
-
Zhang X., Lu S. L. The characteristics of the new type integrated Hall sensors and their applications in measurement and control. College Physics, Vol. 21, Issue 10, 2002, p. 28-31.
-
Zhu R. S., Wang T., Fu Q., Chen J. J. CFD numerical simulation of flow field in charging pump for nuclear power plants. Journal of Drainage and Irrigation Machinery Physics, Vol. 30, Issue 1, 2012, p. 30-34.
-
Chen H. S., Tan Q. C. Review of investigation into internal flow of turbo-machinery. Chinese Journal of Mechanical Engineering, Vol. 43, Issue 2, 2007, p. 1-12.
-
González J., Santolaria C., Parrondo J. L., Fernández J., Blanco E. Unsteady radial forces on the impeller of a centrifugal pump with radial gap variation. ASME/JSME 4th Joint Fluids Summer Engineering Conference, American Society of Mechanical Engineers, 2003, p. 1173-1181.
-
González J., Parrondo J., Santolaria C., Eduardo B. Steady and unsteady radial forces for a centrifugal pump with impeller to tongue gap variation. Journal of Fluids Engineering, Vol. 128, Issue 3, 2006, p. 454-462.
About this article

The authors gratefully acknowledge the support from the National Natural Science Foundation of China (No. 51579117, 51509109, 51679110), and the Foundation of Jiangsu Province (Grant No. BK20161350, BY2014123-07, ZBZZ-040) and the Priority Academic Program Development of Jiangsu Higher Education Institutions (PAPD).
Tan Minggao contributed his main experience to this manuscript and designed the experiment scheme. Zhu Zhipeng helped the author complete the experiment and devoted much energy. Liu Houlin gave many pertinent suggestions about the experiment process. Wu Xianfang and Feng Jinsheng spent much time to check the manuscript.
