Abstract
Firstly, the paper established a finite element model for a steel motor shell and computed related modals, vibration velocities, stress and strain respectively. Computational results show that the flange and end shield of the motor shell had the maximum vibration velocities and strain because these locations lacked the reinforcing ribs, while the maximum stress was mainly at joints between different structures. Secondly, the steel material was replaced by the aluminum alloy. Mechanical parameters of the motor shell were recomputed and compared with those of the steel structure. Results show that modal frequency on each order increased, which is good for avoiding the structural resonance. In addition, the maximum stress of the structure decreased by 4.4 MPa, and the maximum strain decreased by 0.27 mm, which could effectively improve the fatigue characteristics of the motor shell under long-term excitation. Then, the boundary element method was used to compute radiation noises of the motor shell in far field, where the radiation noise presented an obvious directivity. Finally, the paper proposed a GA-BP neural network model to predict the radiation noise of the motor and compared the prediction results with the boundary element. In the whole analyzed frequency band, the maximum difference between the neural network prediction and the real values did not exceed 5 dB, indicating that it is feasible to predict radiation noises of the motor by the neural network. Additionally, experiments were also conducted and compared with two kinds of numerical methods. Methods proposed in this paper provide some references for realizing the rapid noise reduction and light weight of motors.
1. Introduction
Vibrations and noises of motors have become an important technical index to evaluate the quality of motor products. Modern motors have started the development towards high current, high flux density and light structure. Therefore, problems with vibrations and noises of motors become especially prominent [1, 2].
The problem about vibrations and noises of motors is complex. Its research involves multiple disciplines such as electromechanics, electromagnetics, motor drive and control, mechanical vibration science, acoustics and mechanics [3-6]. The purpose of acoustic design is mainly shown as follows: in order to effectively reduce vibrations and noises, it is necessary to take full account of requirements regarding motor vibrations and noises at the earliest stages of the structural design of a motor. At present, there are many researches on motor vibrations and noises, and have obtained some achievements. Islam [7] researched and analyzed noises and vibrations of a permanent magnet synchronous motor, while research results show that noises and vibrations are from electromagnetic vibration caused by electromagnetic forces. He [8] used the finite element method to analyze vibration characteristics of a motor and obtained sound field distribution of the motor through boundary element method. Fu [9] firstly computed the electromagnetic field of a U-shaped single-phase permanent magnet synchronous motor and obtained the electromagnetic force of stator based on the two-dimensional nonlinear finite element method, then used Workbench software to establish a 3D model of the motor. He also computed vibration displacement, velocity and acceleration under stator electromagnetic force through numerical simulation of vibration responses of the motor. Finally, Virtual.Lab was used to extract acoustic boundary element conditions and obtain sound pressure distribution in space and sound pressure frequency response characteristics. Such research laid a foundation for further optimizing and improving this kind of motor structures, which can reduce vibrations and noises of motors and improve working performance. Aiming at the problem that the finite element software ANSYS cannot directly obtain acoustic response characteristics and compare results with experimental data during motor noise analysis, Cui [10] proposed the method which conducts combined simulation with the acoustic analysis software Virtual.Lab. With a permanent magnet direct current motor as the example, a structural dynamic model based on ANSYS was established, vibration frequency response characteristics was computed and added into Virtual.Lab as the input boundary excitation condition, and sound pressure frequency response characteristics were computed by Virtual.Lab.
However, the mentioned researches mainly focused on vibration and acoustic radiation problems of structures in a motor, while rare researches reported vibrations and noises of the motor shell. The paper firstly made comparative analysis of vibration characteristics of a steel motor shell and an aluminum motor shell. Results show that the vibration of the aluminum motor shell obviously is better than that of the steel structure. Finally, an acoustic boundary element model was established to compute radiation noises of the aluminum motor shell. The computational result was compared with that of neural networks, while both of them had a good consistency. Two kinds of computational methods are mutually verified and provide an effective method for noise reduction design of a motor shell. Finally, experiments were also conducted and compared with two kinds of numerical methods to validate the reliability.
2. Finite element analysis of the steel motor shell
Solidworks is a type of three-dimensional design software based on Windows operation platform. The software is featured by a series of advanced three-dimensional design functions and tools such as complicated surface modeling, combination between solids and surfaces, and constraint assembly. Meanwhile, SolidWorks can realize the connection with Hypermesh. Established solid models can be input into Hypermesh for analysis without any modification, which cannot be prevailed by other types of softwares.
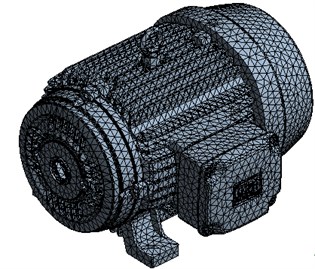
Among optional elements of mesh division, a tetrahedron element can be used for meshing of any solid model. However, a lot of elements may appear when the tetrahedron element is used for meshing of a solid model. This is caused by that small meshes must be used during meshing of a thin wall model, while large meshes may reduce mesh quality and result in inaccurately computational results. A motor shell is a thin-wall structure, so that the analyzed scale will be expanded greatly and computation can hardly be continued if a single solid mesh is used for structural dispersing. In order to ensure the computational accuracy and rationally control the computational scale, the paper applied hybrid elements for mesh division. Three-dimensional solid meshes were blended with the shell element. Finally, the finite element model of the motor was obtained, as shown in Fig. 1. The model contains 103873 tetrahedron elements and 20398 triangular shell elements. Structures are made of steel. Therefore, elasticity modulus is 2.1e11 Pa, density is 7800 kg/m3, and Poisson’s ratio is 0.3.
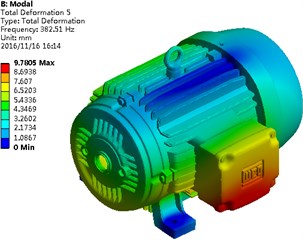
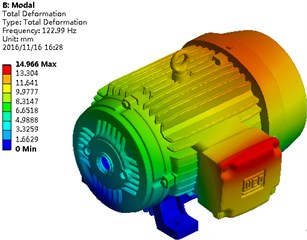
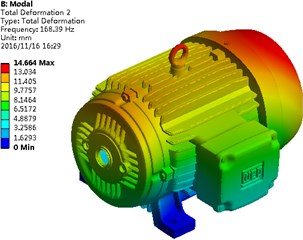
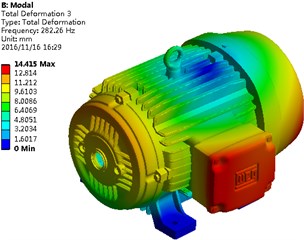
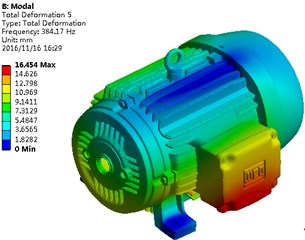
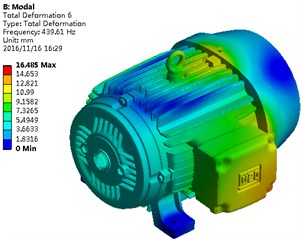
Based on the above finite element model, the base located on the lower part of the motor was constrained, and the whole degree of freedom will be fixed in this model. Modals of the motor under the constraint status were solved, as shown in Fig. 2. It is shown in the figure that mainly the endshield and flange of motors have an obvious vibration, because that these two structures lacked reinforcing ribs, while the vibration responses would be larger under the same excitation force. Full constraint was applied by bolts between the motor base and the ground, so that vibration responses were restrained. Therefore, the structural modals were presented, as shown in this figure.
Fig. 1Finite element model of a motor
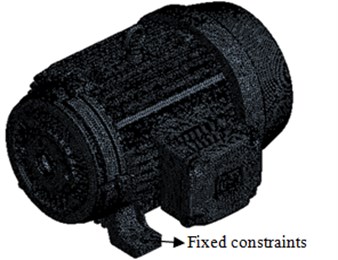
Fig. 2Modals of the motor on top 6 orders
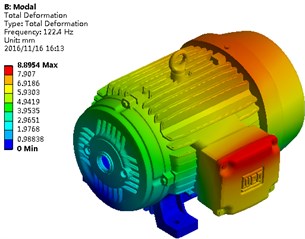
a) First order
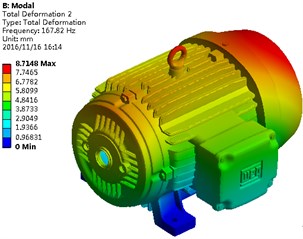
b) Second order
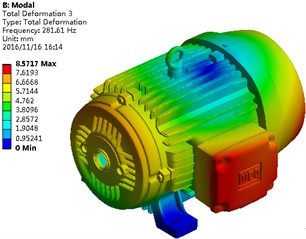
c) Third order
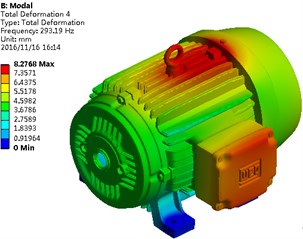
d) Fourth order
e) Fifth order
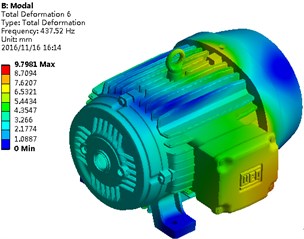
f) Sixth order
At two points of the motor finite element model, the vibration velocities in Fig. 3 were applied as the excitation respectively. As shown in the figure, the excitation lasted for 2 s, and a lot of peaks and valley values were presented in the vibration velocities. In Fig. 3(a), the maximum vibration velocity is 5.2 mm/s, the minimum vibration velocity is –3.6 mm/s, and the vibration velocity fluctuated around 0 mm/s; during the first half of the excitation duration, the vibration velocity was relatively small, while the vibration velocity was relatively large during the second half of duration. Similarly, it is shown in Fig. 3(b) that the vibration velocity mainly fluctuated around 0 mm/s with the maximum value of 4.3 mm/s and minimum value of –3.7 mm/s; during the first half of the excitation duration, the vibration velocities were relatively large, which is opposite to the vibration velocity situation at Point 1.
Fig. 3Excitation velocity at two points of the motor
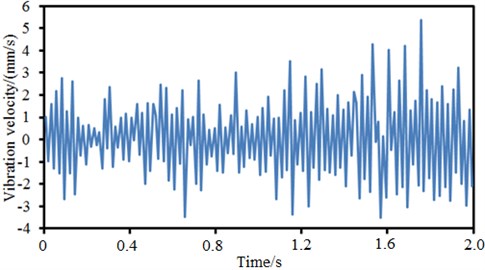
a) Vibration velocity at point 1
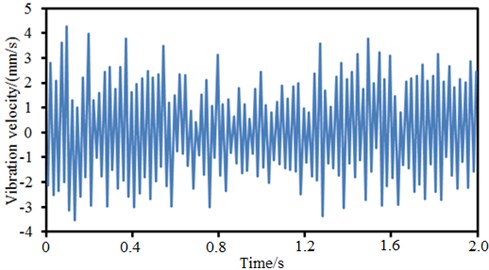
b) Vibration velocity at point 2
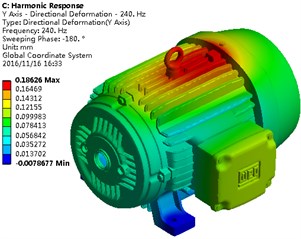
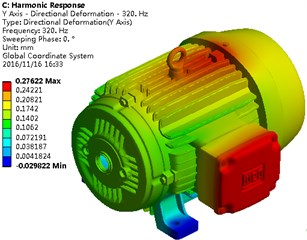
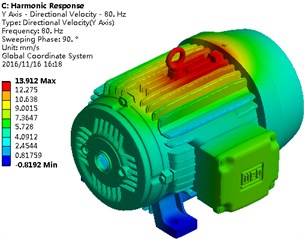
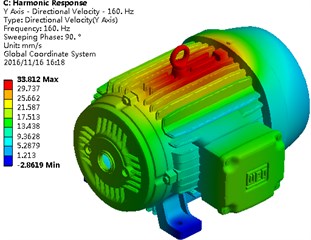
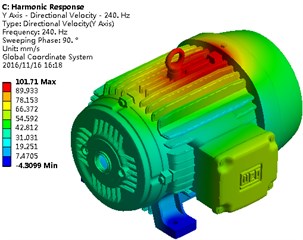
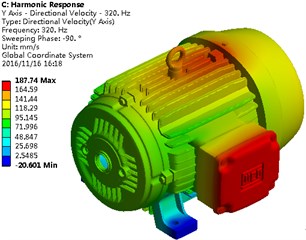
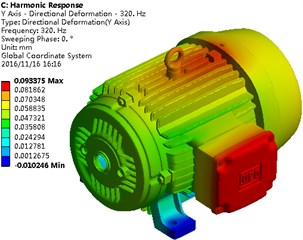
Based on above computation model, a vibration velocity contour of the motor shell under excitation can be obtained, as shown in Fig. 4. Excitation was mainly applied on a lifting hook of the motor, so that the vibration velocity was large here. The flange of the motor shell had large vibration modal, so that the vibration velocity would be large under excitation. In the whole analyzed frequency band, the vibration velocities of the motor shell gradually increased. When the analyzed frequency is 80 Hz, 160 Hz and 240 Hz, the maximum vibration velocity was presented around the lifting hook. At 320 Hz, the maximum vibration velocity was presented at the flange.
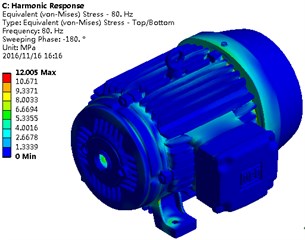
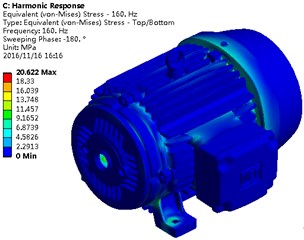
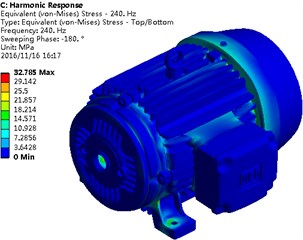
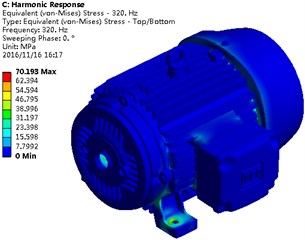
The stress contour of the motor shell was extracted, as shown in Fig. 5. It is shown in Fig. 5 that the maximum stress is presented at the position different from the position of the maximum vibration velocity. The maximum stress is presented at joints because stress concentration could easily be caused at these positions such as joints between base and ground, and the endshield. In addition, with increase of the analyzed frequency, the maximum stress of the motor also increased, while the maximum stress value was 74.6 MPa.
Fig. 4Contours of the motor vibration velocity
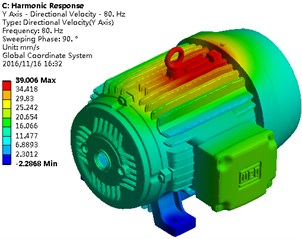
a) 80 Hz

b) 160 Hz

c) 240 Hz
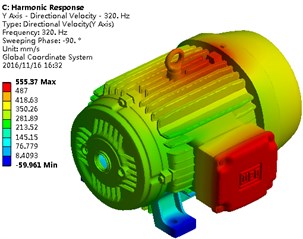
d) 320 Hz
Fig. 5Contours of the motor stress

a) 80 Hz
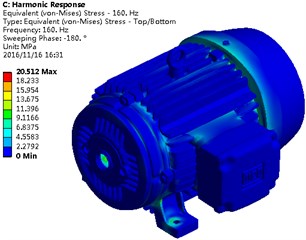
b) 160 Hz

c) 240 Hz

d) 320 Hz
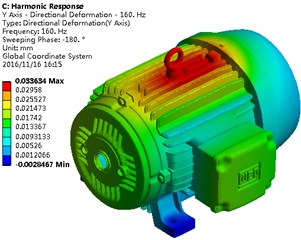
Similarly, strain values of the motor under each frequency were also extracted, as shown in Fig. 6. By comparing Fig. 4 and Fig. 6, we can find that the strain distribution of the motor shell was similar to its velocity distribution. With increase of the analyzed frequency, the maximum strain on the motor surface gradually increased. When the analyzed frequency is 80 Hz, 160 Hz and 240 Hz, the maximum strain of the motor is mainly presented around the lifting hook. At 320 Hz, the maximum strain of the motor is presented at the flange, mainly because that the excitation was applied on the motor flange, while the flange with a smooth surface had large vibration response due to the lack of reinforcing ribs.
Fig. 6Contours of the motor strain

a) 80 Hz

b) 160 Hz
c) 240 Hz
d) 320 Hz
3. Finite element analysis of the aluminum motor shell
Material parameters of the motor shell were replaced by the aluminum. Structural modals were recomputed and compared with those of the steel structure. Results are shown in Table 1. It is shown in Table 1 that each modal frequency of the aluminum motor exceeded that of the steel structure. A high modal frequency could effectively avoid the structural resonance. A vibration modal contour of the aluminum structure was extracted, as shown in Fig. 7. It is shown in Fig. 7 that obvious vibrations still appeared at the endshield and flange, which is consistent with the steel structure. When the analyzed frequency is below 294.6 Hz, with the increase of the analyzed frequency, the vibration displacement of the motor gradually decreased. When the analyzed frequency exceeded 294.6 Hz, the vibration displacement of the motor gradually increased with the analyzed frequency.
Table 1Modal comparison of motors with two different materials
Order | Steel motor / Hz | Aluminum motor / Hz | Absolute error / Hz |
1 | 122.4 | 123.0 | 0.6 |
2 | 167.8 | 168.4 | 0.6 |
3 | 281.6 | 282.3 | 0.7 |
4 | 293.2 | 294.6 | 1.4 |
5 | 382.5 | 384.2 | 1.7 |
6 | 437.5 | 439.6 | 2.1 |
Based on the computation model, a contour of vibration velocities of the motor shell can be obtained, as shown in Fig. 8. The excitation was mainly applied on the lifting hook of the motor, so that the vibration velocities here were large. The flange of the motor shell had large vibration modals, so that vibration velocities were large under the excitation. This result is highly similar with that of steel structure mainly because only the material parameter was changed while the structural characteristic was not changed for the computational model. In the whole analyzed frequency band, the vibration velocity of the motor shell gradually increased. When the analyzed frequency is 80 Hz, 160 Hz and 240 Hz, the maximum vibration velocity is presented around the lifting hook. At 320 Hz, the maximum vibration velocity is at the flange. Compared with the vibration velocity contour of the steel structure, we can find that the vibration velocities of aluminum structure were much lower. Therefore, when the motor shell material was replaced by the aluminum alloy, the structural vibration would be obviously improved.
Fig. 7Modals of the motor on top 6 orders
a) First order
b) Second order
c) Third order

d) Fourth order
e) Fifth order
f) Sixth order
The stress contour of the motor shell was extracted, as shown in Fig. 9. It is shown in Fig. 9 that the maximum stress is at the position different from the position of the maximum vibration velocity. The maximum stress is mainly at the joints because the stress concentration could easily be caused at these positions such as the joints between base and ground, and the endshield. In addition, with the increase of the analyzed frequency, the maximum stress of the motor also increased, while the maximum stress value was 70.2 MPa. Compared with the maximum stress 74.6 MPa of the steel motor shell, the maximum stress decreased by 4.4 MPa. It can effectively improve the fatigue failure caused by too large motor shell stress.
Fig. 8Contours of the motor vibration velocity
a) 80 Hz
b) 160 Hz
c) 240 Hz
d) 320 Hz
Fig. 9Contours of the motor Stress
a) 80 Hz
b) 160 Hz
c) 240 Hz
d) 320 Hz
Similarly, strain values of the motor under each frequency were also extracted, as shown in Fig. 10. By comparing Fig. 7 and Fig. 10, we can find that the strain distribution of the motor shell was similar to the velocity distribution. With increase of the analyzed frequency, the maximum strain on the motor surface gradually increased. When the analyzed frequency is 80 Hz, 160 Hz and 240 Hz, the maximum strain of the motor is mainly around the lifting hook. At 320 Hz, the maximum strain of the motor is at the flange. This was mainly caused by that the excitation was applied on the motor flange, while the flange with a smooth surface had large vibration response due to the lack of reinforcing ribs. The maximum strain of the aluminum motor shell was 0.093 mm. Compared with the maximum strain 0.28 mm of the steel motor shell, the maximum strain decreased by 0.27 mm. Strain performance of the motor could be improved greatly. Through comparison of stress, strain, vibration velocity and modal, we can find that the mechanical performance was obviously improved after the aluminum alloy was used as the motor shell material.
Fig. 10Contours of the motor strain

a) 80 Hz
b) 160 Hz

c) 240 Hz
d) 320 Hz
4. Prediction of radiation noises based on boundary element method
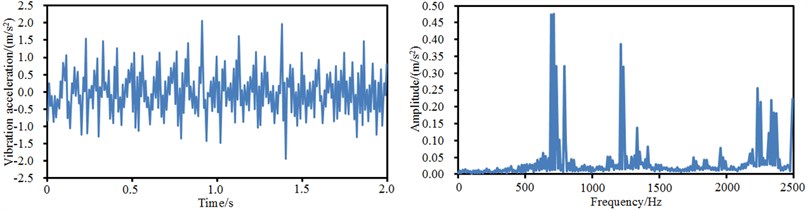
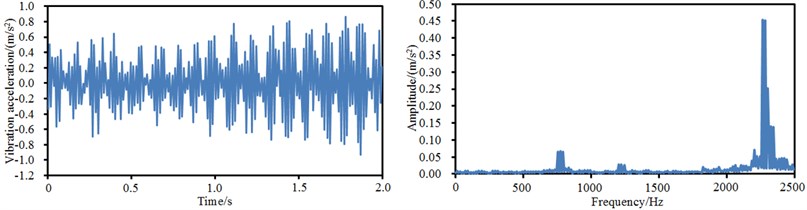
Vibration accelerations in time-domain and frequency-domain at four observation points of the aluminum motor shell were extracted, as shown in Fig. 11. By comparing time-domain vibration accelerations at 4 points in Fig. 11, we can find that the vibration accelerations have an obvious periodicity, while the vibration accelerations fluctuated around 0. Different from the time-domain vibration accelerations, the frequency-domain vibration accelerations had obvious differences in the whole analyzed frequency band. Obvious peaks were at the 4 positions around 2000 Hz-2500 Hz.
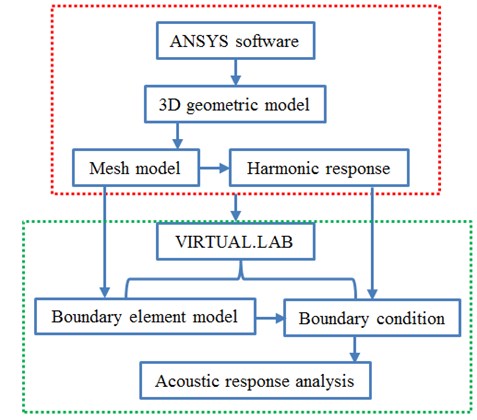
As shown in Fig. 12, at the step 1, solid mesh division technology was used, and solid meshes could not be used as boundary elements, so that the original finite element model should be processed appropriately and transformed into a relevant acoustic boundary element model. The vibration frequency response characteristics of the motor, which was computed at the step 2, should be added in acoustic computation as the input boundary excitation condition of the acoustic boundary element model, so that shelling was implemented to the finite element model, and local characteristics which could only slightly influence the computational results of sound field outside the whole motor mechanism were further simplified. However, no processing is conducted to the nodes. In this way, node consistency between the finite element model and the boundary element model could be maintained, and thus accurate data input can be ensured. In addition, in the noise radiation computation of boundary elements, the refinement degree of elements depended on structural dimensions as well as the maximum frequency value obtained in pre-computation in the acoustic fluid domain.
Fig. 11Time-domain and frequency-domain vibration accelerations at 4 observation points
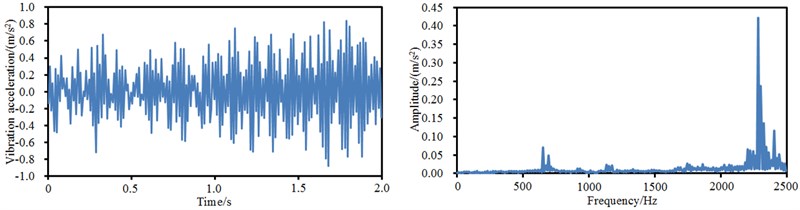
a) Time-domain and frequency-domain vibration accelerations at point 1
b) Time-domain and frequency-domain vibration accelerations at point 2
c) Time-domain and frequency-domain vibration accelerations at point 3
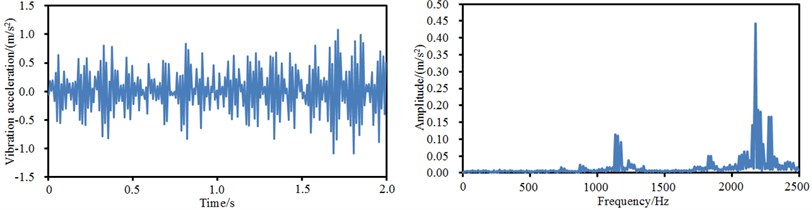
d) Time-domain and frequency-domain vibration accelerations at point 4
When element characteristic size is smaller than 1/6 of the sound wave length decided by the maximum concerned frequency, the computational accuracy of acoustic results could satisfy requirements. Based on comprehensive consideration for the computational accuracy, modeling complexity and probability in successful solution, the paper selected triangular elements for the motor shell to realize dispersing of the boundary element mesh model. The paper confirmed that the maximum element length applied by the acoustic boundary element mesh was 2 mm, so that the frequency accuracy of the model to be analyzed could be kept below 2500 Hz. The acoustic boundary element mesh model obtained according to the mesh division principles is shown in Fig. 13(a). The model contains 10254 triangular elements and 11536 nodes.
Fig. 12Analysis processes of acoustic boundary element
Both the structural vibration responses and the boundary element model were input into Virtual.Lab. After that, the structural vibration responses were mapped into the boundary element mesh. In this way, the boundary element mesh could obtain all the characteristics of structural vibrations, and vibro-acoustic coupling could be realized. With the motor center as the original point, a spherical mesh with radius of 1m was established as the field point, as shown in Fig. 13(b). It was used to compute radiation noises of the motor, as shown in Fig. 14. It is shown in Fig. 14 that the radiation noise contour was similar at each frequency point and showed certain directional distribution. Vibration velocities of the motor were distributed in a concentrated manner rather than a uniform way, so that the noise radiated by vibration had certain directivity.
Fig. 13Models of boundary element meshes and field point meshes
a) Boundary element meshes
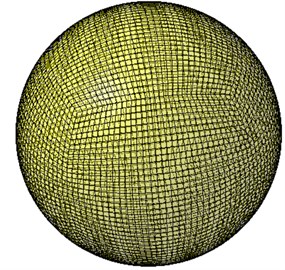
b) Field point meshes
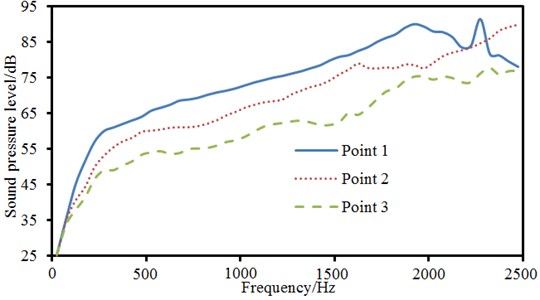
Sound pressure levels of 3 observation points in the field point model were extracted, as shown in Fig. 15. It is shown in the figure that the sound pressure levels of 3 observation points basically showed the same changing trends. Only the observation point 1 had obvious peak noises at 2000 Hz-2500 Hz.
Fig. 14Contours of radiation noises in the far field
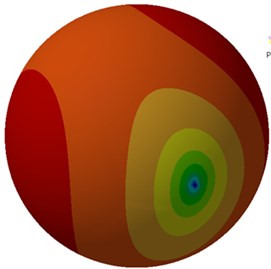
a) 80 Hz
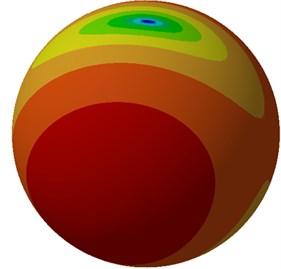
b) 160 Hz
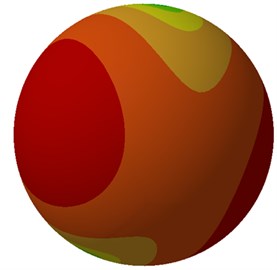
c) 240 Hz
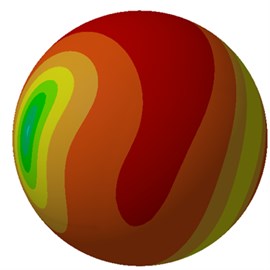
d) 320 Hz
Fig. 15Comparison of sound pressure levels of 3 observation points
5. Predication of radiation noises based on GA-BP neural networks
BP neural network [11-13] makes use of a learning method based on gradient descent and directional propagation, and aims to minimize mean square error of network output and training samples. Regarding capability of self-learning and generalization, it is especially applicable to solving problems with complex internal mechanisms. It is a currently mature artificial neural network with the most widely application. Nevertheless, BP network is deficient in that it can easily fall into local extremum; initial weight and threshold are random; stability is poor; convergence is low or even cannot be realized, etc.
Genetic Algorithm [14-16] (GA) adopts 3 main operators including selection, crossover and mutation to operate a population, where the individual information is exchanged by the operators; individuals in the population are optimized generation after generation; and optimal solutions are approximated step by step. GA-BP algorithm is an improved BP algorithm, where the initial weight is given by GA. It applies global search ability of GA to find the weight corresponding to initial sub-optimal solution of a network; then takes the weight as the network initial value; and finally uses the BP algorithm for network training to obtain the optimal solution. Algorithm processes are shown in Fig. 16. It can very effectively prevent the network from falling into local minimum, accelerate convergence and make the network get rid of dependence on the initial value.
Fig. 16Flow chart of GA-BP algorithm
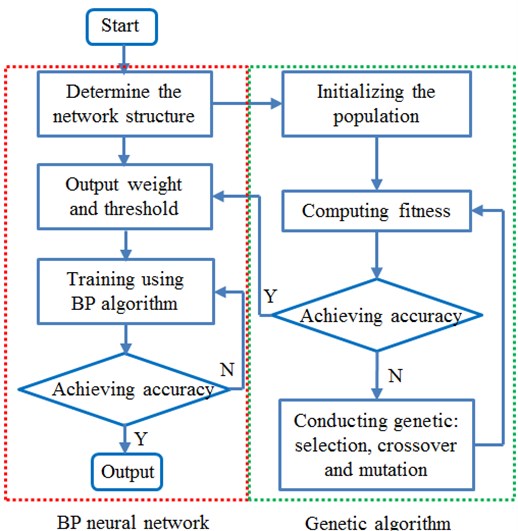
Fig. 17BP neural network topology structure
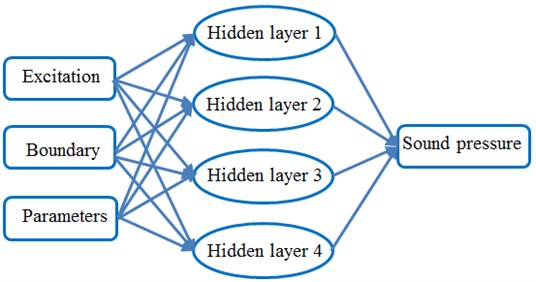
Sound pressure levels of radiation noises are taken as network output. Objective parameters representing the sound pressure level are taken as network input. A GA-BP network is used to realize mapping from objective parameters to sound pressure levels. In this way, a prediction model of motor radiation noises can be established. Related theories show that a 3-layer BP network with one S-shaped hidden layer and a linear output layer can approximate all the functions. Therefore, the paper adopted a 3-layer neural network to establish the prediction model of radiation noises. 3 objective parameters were taken as the input. Sound pressure levels were taken as the output layer. There was one node. Based on hidden layer selection regulation and experimental results, the paper adopted 8 nodes for the hidden layer. Finally, a network topology structure was established, as shown in Fig. 17. Logsig function was adopted for the network hidden layer. The purlin linear function was adopted for the output layer.
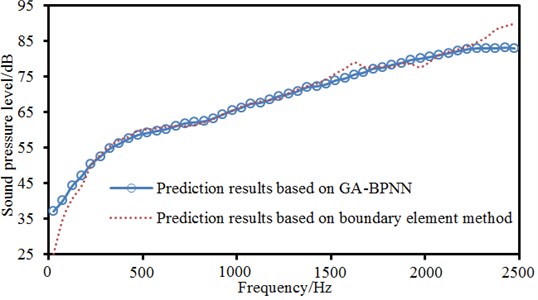
GA was used to train the network. Training errors are shown in Fig. 18. It is shown in Fig. 18 that the neural network training region became stable when the iteration was conducted to the 80th step. At that time, the computational results could better satisfy actual situations. The trained neural network was then used to predict radiation noises of the motor. Predication results were compared with boundary element, as shown in Fig. 19. It is shown in Fig. 19 that in the whole analyzed frequency band, prediction values of neural networks could coincide the computational values of boundary element method very well, while the maximum difference was not higher than 5 dB. This results show that it is feasible to predict motor radiation noises using the neural network.
Fig. 18Training errors of neural networks
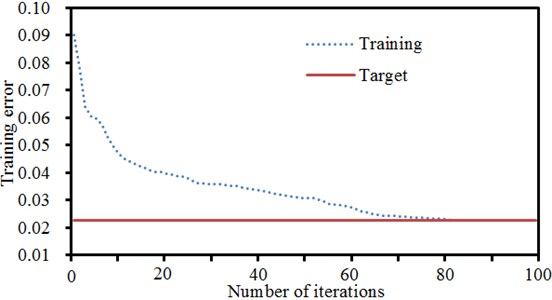
Fig. 19Comparison between real values and predication values of neural networks
6. Experimental validation of radiation noises of the aluminum motor shell
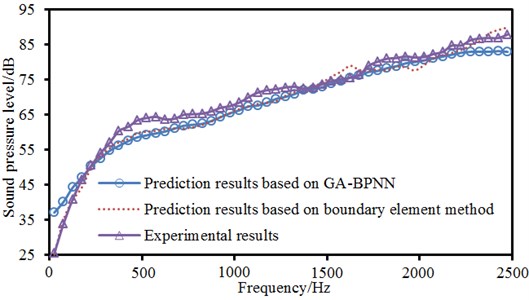
In order to validate the computational result of radiation noises of the aluminum motor shell, the corresponding experiment was conducted in this paper. When the sound pressure level of radiation noises of the motor was tested, the motor and microphone were installed according to the latest requirements of ISO [17]. The experimental field and equipment were shown in Fig. 20. In this figure, microphones were uniformly distributed on a hemisphere with a radius of 1m, and they were 0.25 m from the ground. The motor was fixed on the ground of semi-anechoic chamber, and it was located in the center of the hemisphere. Four microphones were arranged in the hemisphere. The size of the semi-anechoic chamber was 8.4 m×6.2 m×4.8 m. There were some serious requirements for background noises of the semi-anechoic chamber because background noises will affect the experimental accuracy. In the analyzed frequency band, the sound pressure level of background noises is at least 10 dB lower than that of the tested object. The background noise in this paper was shown in Fig. 21. In the analyzed frequency band, the sound pressure level of background noises is less than –10 dB, which was more than the requirement of ISO standards. The analysis showed that the tested radiation noise was not affected by background noises, and the experimental result was reliable. The experimental sound pressure level was compared with those of boundary element method and GA-BP neural network, as shown in Fig. 22. As can be seen from this figure, the prediction results based on boundary element method and GA-BP neural network were reliable.
Fig. 20The experimental process and equipment
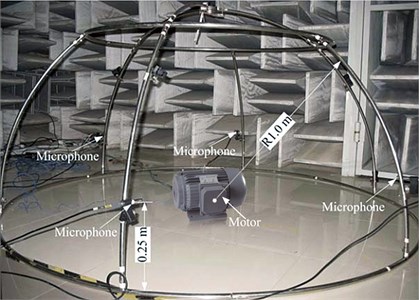
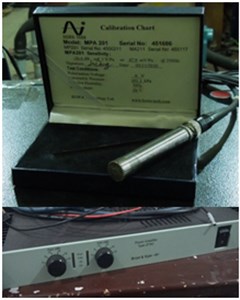
Fig. 21Sound pressure level of background noises
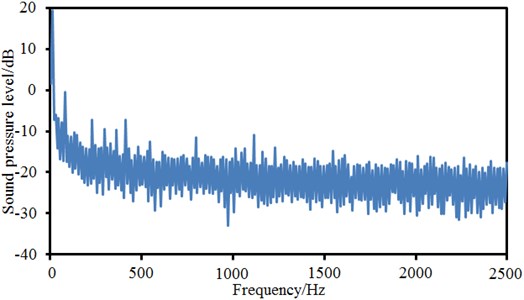
Fig. 22Comparisons of sound pressure level between experimental values and predication values
7. Conclusions
Firstly, the paper established a finite element model for a steel motor shell and computed related modals, vibration velocities, stress and strain respectively. Computational results show that the flange and endshield of the motor shell had the maximum vibration velocities and strain becasue these locations lacked the reinforcing ribs, while the maximum stress was mainly at joints between different structures. Secondly, the steel material was replaced by the aluminum alloy. Mechanical parameters of the motor shell were recomputed and compared with those of the steel structure. Results show that modal frequency on each order increased, which is good for avoiding the structural resonance. In addition, the maximum stress of the structure decreased by 4.4 MPa, and the maximum strain decreased by 0.27 mm, which could effectively improve the fatigue characteristics of the motor shell under long-term excitation. Then, the boundary element method was used to compute radiation noises of the motor shell in far field, where the radiation noise presented an obvious directivity. Finally, the paper proposed a GA-BP neural network model to predict the radiation noise of the motor and compared the prediction results with the boundary element. In the whole analyzed frequency band, the maximum difference between the neural network prediction and the real values did not exceed 5 dB, indicating that it is feasible to predict radiation noises of the motor by the neural network. Methods proposed in this paper provide some references for realizing the rapid noise reduction and light weight of motors.
References
-
Weilharter B., Biro O., Lang H., et al. Validation of a comprehensive analytic noise computation method for induction machines. IEEE Transactions on Industrial Electronics, Vol. 5, Issue 59, 2012, p. 2248-2257.
-
Shang R. C., Peng C. Q., Fang R. M. Summary on design points of low-noise induction motors. Explosion Proof Electric Machine, Vol. 47, Issue 5, 2012, p. 5-10.
-
Li X. H., Huang S. R., Li L. Z. Calculation and analysis of vehicle vibration and noise of permanent magnet synchronous motor applied in electric vehicle. Electric Machines and Control, Vol. 17, Issue 8, 2013, p. 37-42.
-
Kim D. J., Jung J. W., Hong J. P., et al. A study on the design process of noise reduction in induction motors. IEEE Transactions on Magnetics, Vol. 48, Issue 11, 2012, p. 4638-4641.
-
Seera M., Lim C. P., Ishak D., et al. Fault detection and diagnosis of induction motors using motor current signature analysis and a hybrid FMM-CART model. IEEE Transactions on Neural Networks and Learning Systems, Vol. 23, Issue 1, 2012, p. 97-108.
-
Smits-Engelsman B., Wilson P. H. Noise, variability, and motor performance in developmental coordination disorder. Developmental Medicine and Child Neurology, Vol. 55, Issue 4, 2013, p. 69-72.
-
Islam R., Husain I. Analytical model for predicting noise and vibration in permanent-magnet synchronous motors. IEEE Transactions on Industry Applications, Vol. 46, Issue 6, 2010, p. 2346-2354.
-
He G., Huang Z., Qin R. Numerical prediction of electromagnetic vibration and noise of permanent-magnet direct current commutator motors with rotor eccentricities and glue effects. IEEE Transactions on Magnetics, Vol. 48, Issue 5, 2012, p. 1924-1931.
-
Fu M., Chen Y. The vibration and noise finite element analysis of U type single phase permanent magnet synchronous motor. Journal of Harbin University of Science and Technology, Vol. 20, Issue 3, 2015, p. 86-90.
-
Cui S. M., Yu T. D., Song L. W. Simulation method of motor acoustic radiation based on ANSYS and SYSNOISE. Electric Machines and Control, Vol. 15, Issue 9, 2011, p. 63-67.
-
Guo Z., Wu J., Lu H., et al. A case study on a hybrid wind speed forecasting method using BP neural network. Knowledge-Based Systems, Vol. 24, Issue 7, 2011, p. 1048-1056.
-
Ruan J. H., Shi Y. Monitoring and assessing fruit freshness in IOT-based e-commerce delivery using scenario analysis and interval number approaches. Information Sciences, Vol. 373, Issue 10, 2016, p. 557-570.
-
Bin G. F., Gao J. J., Li X. J., et al. Early fault diagnosis of rotating machinery based on wavelet packets – empirical mode decomposition feature extraction and neural network. Mechanical Systems and Signal Processing, Vol. 27, 2012, p. 696-711.
-
Moradi M. H., Abedini M. A combination of genetic algorithm and particle swarm optimization for optimal DG location and sizing in distribution systems. International Journal of Electrical Power and Energy Systems, Vol. 34, Issue 1, 2012, p. 66-74.
-
Magnier L., Haghighat F. Multiobjective optimization of building design using TRNSYS simulations, genetic algorithm, and artificial neural network. Building and Environment, Vol. 45, Issue 3, 2010, p. 739-746.
-
Kannan G., Sasikumar P., Devika K. A genetic algorithm approach for solving a closed loop supply chain model: A case of battery recycling. Applied Mathematical Modelling, Vol. 34, Issue 3, 2010, p. 655-670.
-
Acoustics-Determination of Sound Power Levels of Noise Sources Using Sound Pressure-Precision Methods for Anechoic and Hemi-Anechoic Rooms. ISO 3745-2003, 2003.
Cited by
About this article

This work is supported by National Natural Science Foundation of China (Grant No. 51667017), Key research projects of Tibet Autonomous Region for Innovation and Entrepreneur (Grant No. Z2016D01G01/01).
