Abstract
At present, there are some researches focusing on optimization of aerodynamic noises on rear view mirrors, but researches on bionic noise reduction of rear view mirrors are rarely reported. Therefore, with an original rear view mirror as the basic model, the paper applied a head convex hull of a dung beetle to the original rear view mirror cover to obtain a bionic rear view mirror, then conducted numerical computation for aerodynamic noises of the bionic rear view mirror and compared the computational results with the original model. Finally, in order to verify correctness of computational results of aerodynamic noises of the rear view mirror, wind tunnel test was conducted on the rear view mirror. Experimental and numerical simulation results were highly consistent in the whole frequency band, so the wind tunnel test could be replaced by numerical simulation. Only one obvious vortex was behind the bionic rear view mirror, but two obvious vortexes with the opposite rotation directions were behind the original rear view mirror. The bionic rear view mirror did not present vortexes near the lateral window, so impacts of vortexes on noises in the vehicle could be eliminated effectively. Pressure difference in front of and behind the bionic view mirror was smaller than the pressure difference in front of and behind the original rear view mirror. Pressure resistance caused by the convex structure outside the rear view mirror was reduced, so noise reduction could be promoted. The convex structure mainly affected the aerodynamic noise in mid-high frequency regions. Compared with the original rear view mirror, noise reduction effects of the bionic rear view mirror were obvious, where the noise reduction amplitude reached 10dB. Noise source size and intensity of the bionic rear view mirror were reduced obviously.
1. Introduction
When the running speed of a vehicle reaches a certain value, airflows would intensely hit the body, so the reversed vehicle performance in the construction space will be also affected. Aerodynamic noises caused by the rear view mirror will also become an important part of vehicle noises. How to reduce the aerodynamic noise during high-speed running has become a studied hot topic [1-4]. Noises caused by running airflows include: noises caused when air enters a vehicle through door windows; aerodynamic noises caused by vortexes which are generated when airflows get contact with the body, as well as vibration noises caused by friction between air and the body; vibration noises caused by convex structures on the body. From the perspective of aerodynamics, a rear view mirror outside a vehicle is a bluff body with a large structural size, which is exposed in high-speed airflows; the flow field in the wake flow region behind the rear view mirror has a complicated structure, and resistance brought by it is 2 %-5 % of air resistance of the complete vehicle; turbulent flow structures will directly affect pressure distribution in lateral window region; the shape of rear view mirrors obviously affects aerodynamic noises of the vehicle [5-8]. Therefore, it is very necessary to study flow fields and aerodynamic noises around the rear view mirror.
At present, aerodynamic noises of rear view mirrors are mainly studied by two methods as follows. Firstly, a wind tunnel lab is used for model wind tunnel experiments [9-11]. The wind tunnel test is an experimental method which could simulate air flowing around the rear view mirror, quantify effects of airflows on objects and observe physical phenomena through manual generation and control for the airflows. It is an indispensable part at the design stage. For example: Chen [12] applied wind tunnel experiments to test aerodynamic noises at 8 observation points in a wake flow region of rear view mirrors. Experimental results showed that aerodynamic noise caused by the rear view mirror was increased obviously with the increased vehicle speed. Tomac [13] quantitatively studied the impact of those design features of rear view mirrors on the vibration amplitude; developed a methodology for testing mirror vibrations in a small, low-speed wind tunnel using only the mirror of interest; and delved into the interactions between the bluff body mirror geometry and its wake. Onur [14] has tested the flow fields over a rearview side mirror in a wind tunnel and the results showed that the static pressures are presented different distribution over the rear view mirror and took smaller values at the separation points of the boundary layer from the mirror surface. However, despite of high accuracy and reliability of the experimental results, wind tunnel experiments are still deficient in some aspects. For example, wind tunnel experiments require very high cost and long experimental time, so that repeatability of experimental results is not high, and collection of experimental data is greatly limited. Secondly, computer simulation technologies are used for numerical simulation [15-17]. Numerical simulation technologies could select any structural parameter of a studied object to conduct in-depth researches, and have good computational effects. Based on Lattice Boltzmann theories and the statistic energy analysis method, Gong [18] simulated aerodynamic noises in the rear view mirror region, finding that aerodynamic noises could be reduced effectively through improving water bars of the rear view mirror. Based on the hybrid computation method, Xu [19] studied aerodynamic noises of the rear view mirror, and completed sound pressure frequency spectrum computation of observation points through coupled solution between flow fields and sound fields. Ogawa [20] has used CFD simulation technology to clarify the vibration modes of side-view mirror experimentally and to capture forces on the mirror surface induced by separating vortices around the mirror numerically. Eddies behind the rear view mirror would exert serious effects on noise inside an automobile. Hence, it is necessary to optimize the structure of rear view mirror so as to reduce effects of airflows.
In recent years, bionics design ideas have been applied to vehicles more and more extensively. By simulating shapes of animals and plants, designers combined vehicles with animals and plants in the nature perfectively [21-24]. Clever utilization of bionics has achieved obvious effects in engineering field, science and technologies, fully indicating the finite application prospect and development space of bionics [25-29]. At present, there are some researches focusing on optimization of aerodynamic noises on rear view mirrors, but researches on bionic noise reduction of rear view mirrors are rarely reported. Therefore, with an original rear view mirror as the model, the paper applied a head convex hull of a dung beetle to the rear view mirror cover, conducted numerical computation of aerodynamic noises of the bionic rear view mirror and compared the computational results with the original model.
2. Numerical computation of flow fields of the original rear view mirror
In order to know pressure pulsations on the surface and tail part of the real rear view mirror more clearly, the real shape of rear view mirrors was taken as the studied model. The rear view mirror was 0.25 m long and 0.12 m wide. Detailed characteristic of the rear view mirror were neglected as these structures only had very tiny effects on flow field results, but would increase difficulty and computational time of mesh division. A panel was disposed under the rear view mirror, so wall face effects of the lateral window could be simulated and boundary conditions would be consistent with experimental conditions. The front edge of panel was 6 m away from the entrance of computation domain.
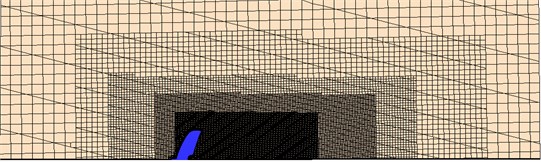
During surface mesh division, size of meshes on the surface of rear view mirrors was uniformly set to be 10 mm; node distance on edges of the panel was 40 mm. In this way, size of surface meshes on the panel could get uniform transition from 10 mm to 40 mm. Node distances on boundaries of far fields, inlet and outlet ranged within 125 mm-200 mm. Boundary layers were composed of hexahedron elements. The first layer was 1mm high; increase ratio was 1.2; number of layers was 3. Mesh division was conducted after generation of the boundary layers, wherein hexahedron elements were used as the solid meshes. In order to guarantee high accuracy of computational results, mesh encryption should be conducted around the rear view mirror. An encryption frame was set, wherein the maximum surface size of the encryption frame was 6 mm, and the maximum solid mesh size was 10 mm. From boundaries of the encryption frame to boundaries of the computation domain, the mesh size increased gradually, and the total amount of solid meshes was 6 million, as shown in Fig. 2. Tetrahedral meshes were used in the computational domain far away from the boundary layer. It is practically proved that application of solid meshes could effectively reduce the total amount of meshes, increase convergence speed and reduce computational time. Generation rules of solid meshes are similar to those of surface meshes. Solid meshes around the rear view mirror are relatively small, while meshes far from the rear view mirror are amplified gradually.
Fig. 1Computational domain of the flow field of the rear view mirror
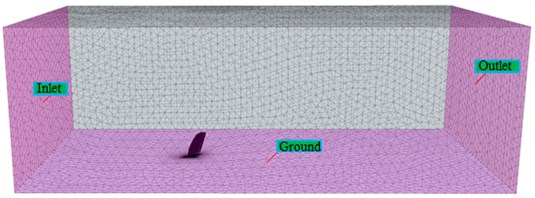
Fig. 2Meshes of the computational domain and rear view mirror
Before conducting numerical simulation, specific boundary conditions should be set to simulate wind tunnel experiments under actual situations. Inlet of the simulated wind tunnel was set as the velocity inlet, wherein the velocity was 33.3 m/s. Outlet of the simulated wind tunnel was set as the pressure outlet, wherein the surface pressure was a standard atmospheric pressure. Lateral faces, upper face and bottom face of the simulated wind tunnel were set as non-slippage wall faces. is the air density of 1.225 kg/m3; is the characteristic length of fluid, wherein diameter of the rear view mirror was taken as the characteristics length; is the fluid speed; is the aerodynamic viscosity of 1.789e–5. According to computational results, the Reynolds number was 0.1, belonging to a low mach number. Therefore, air could be deemed as an incompressible fluid. Time step length of numerical simulation of aerodynamic characteristics directly affects the computational frequency. Computational time should be 4-5 times more than the characteristic cycle of fluid flowing changes, so unsteady flow characteristics could obtain full development. According to the strouhal number, the computational time is determined to be , wherein is a characteristic frequency, is the characteristic length, and v is the fluid velocity. Characteristic frequency of the rear view mirror flow field was about 30 Hz, namely the characteristic cycle was about 0.033 s. The total time step amount was set to be 4000 and the time step length was set to be 0.0002 s, so the sampling times was 0.8 s. The sampling time was about 25 times the characteristic cycle of the rear view mirror flow field and could fully reflect flow characteristics. Smagorinsky model was used as the sub-grid model. Central difference format was set as the spatial dispersion format. Crank-nicolson was set as the time dispersion format.
After mesh division and boundary conditions were completed, flow fields around the rear view mirror were computed, as shown in Fig. 3, Fig. 4 and Fig. 5. It is shown in Fig. 3(a) that two obvious vortexes were behind the rear view mirror. It is shown in Fig. 3(b) that the low-velocity region behind the rear view mirror in the longitudinal cross section was composed of two low-velocity vortexes with opposite rotation directions. Driven by high-velocity airflows which flowed through the top part and lateral part of rear view mirrors, the vortexes were formed through accelerated rotation motion of low-velocity airflows behind the rear view mirror. Through analyzing vortexes in the longitudinal plane of rear view mirrors, we can find that sizes of the two vortexes were very different. The vortexes near the lateral window surface had higher intensity and velocity; intensity of the vortexes near the rear view mirror edge was relatively weak; and the shape was presented to an oval shape along the airflow flowing direction. A part of airflows passed through outer edges of the rear view mirror, while the other part of airflows passed through gaps between the lateral window surface and the rear view mirror. The two parts of airflows were similar to water flows coming from different sizes of valves. Under the same incoming flow pressure and velocity, the water flow velocity would be higher under the smaller valve opening degree. Therefore, the flow velocity of airflows flowing between the rear view mirror and the lateral window was much higher than that of airflows flowing through outer edges of the rear view mirror. High-speed airflows passing through gaps between the rear view mirror and the lateral window drove low-velocity airflows behind the rear view mirror to make violate rotation motion, so strong clockwise vortexes were caused near the lateral window and on the inner side of the rear view mirror, and aerodynamic noises in the vehicle would be affected seriously. Velocity of the airflows flowing through gaps between the rear view mirror and the lateral window was relatively large, while the flow velocity of airflows flowing through outer edges of the rear view mirror was relatively small. Therefore, rotary vortexes were firstly generated near the lateral window, as shown in Fig. 3(c) and Fig. 3(d). High-velocity airflows flowing through outer edges of the rear view mirror would also cause rotary vortexes behind the rear view mirror, but made small contribution to the noise level in the vehicle. It is shown in Fig. 4 that two vortexes with opposite rotation directions were on the windward face of rear view mirrors, while intensity of size of the vortexes increased with time. It is shown in Fig. 5 that the windward face of the rear view mirror was a positive high-pressure region, and the leeside was a negative low-pressure region. Especially in regions near the lateral window, the pressures were large as flow velocity of airflows here was large, and pressures caused by collision to the bottom of rear view mirror would be larger.
Fig. 3Velocity streamlines on rear part of rear view mirrors

a) Three-dimensional velocity streamlines
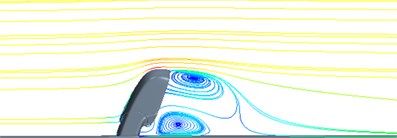
b) 0.8 s (Final time)
c) 0.2 s
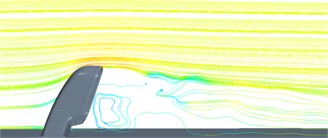
d) 0.4 s
Fig. 4Velocity streamlines on front part of rear view mirrors
a) 0.2 s

b) 0.4 s
Fig. 5Contours of pressure distribution of rear view mirrors
a)
b)
3. Numerical computation of aerodynamic noises of original rear view mirrors
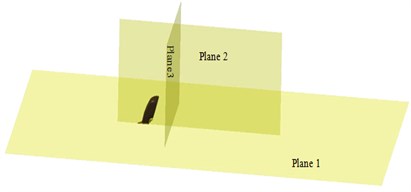
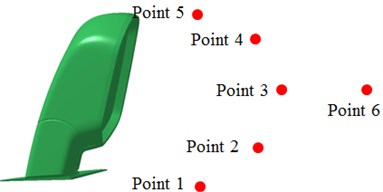
Flow field results are the foundation of aerodynamic noises of the rear view mirrors. Therefore, flow field results obtained in Section 2 were input into acoustic software for computing aerodynamic noises of the rear view mirror. The boundary element method refers to integral-form solution of boundary problems. Compared with the finite element method, this method is superior in simpler data, fewer elements, etc. The reason is that the boundary element method only requires element division of boundaries, and then the integral algebra method is used for solution and computation. Shell elements shall be used in the boundary element model. During computing noise radiation, the meshes should satisfy the 1/6 principle. Specifically, as for linear finite element and boundary element models, it is generally assumed that there are 6 elements within the minimum wavelength, namely the side length of the maximum element shall be smaller than 1/6 minimum wavelength of the computational frequency, or shall be smaller than 1/6 wavelength of the maximum computational frequency point. The established fluid mesh model of rear view mirrors was input into HYPERMESH for extracting surface meshes. The meshes would be taken as boundary element meshes in sound field computation. In sound field computation, air was taken as the medium; related parameters included density of 1.225 kg/m3, and sound propagation speed of 340 m/s in air. Air medium properties were set in regions outside the boundary element meshes of the rear view mirror. Finally, the acoustic boundary element model was established, as shown in Fig. 6(a), where plane observation points in , and directions were involved. In order to observe impacts of vortexes behind the rear view mirror on the aerodynamic noise, 6 observation points were arranged behind the rear view mirror, as shown in Fig. 6(b).
Fig. 6Boundary element model and observation points of the rear view mirror
a) Boundary element model
b) Observation points
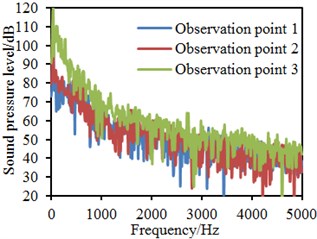
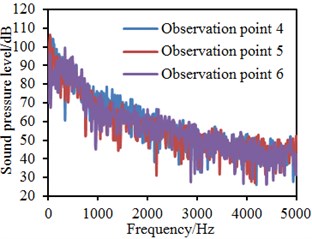
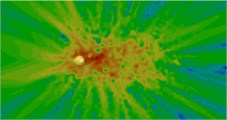
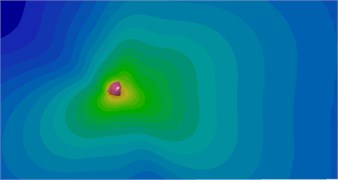
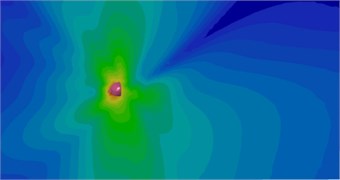
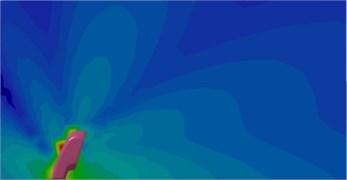
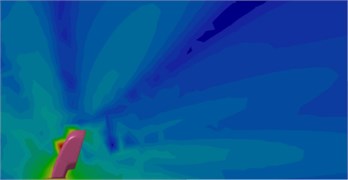
Fig. 7 presents aerodynamic noises of 6 observation points. Basic rules of aerodynamic noises of each observation point were consistent. When the analyzed frequency was less than 1000 Hz, sound pressure levels of each observation point were high, and the sound pressure levels decreased obviously with the increased frequency. When the analyzed frequency was more than 1000 Hz, sound pressure levels of each observation point tended to become steady, where the sound pressure levels decreased gently with the increased frequency. Within the whole frequency, the sound pressure levels did not present peaks, belonging to a wide band noise. In addition, aerodynamic noises of observation points 4, 5 and 6 were obviously stronger than those of observation points 1, 2 and 3, as the observation points 4, 5 and 6 were located in the vortex region behind the rear view mirror. Observation point 1 had the minimum aerodynamic noise because it was far from the vortex region behind the rear view mirror. Fig. 8 shows the contour of aerodynamic noises at different plane observation points. It is shown in the figure that aerodynamic noises on Panel 1 was distributed uniformly and had high intensity. The plane represented a lateral window in vehicles, and strong vortexes were caused in regions near the lateral window as shown in Fig. 3(a), so strong radiation noises would be caused inevitably. In addition, through computing sound pressure contours at 2000 Hz and 4000 Hz, it could be found that sound pressures were distributed uniformly at the high frequency because wavelength of sound waves at the high-frequency was short and the generated small-size vortexes were distributed uniformly. It is shown in Fig. 8(c) and Fig. 8(d) that sound pressures near the lateral window were more than those far from the lateral window. The results indicate that the positions were affected by large-size vortexes.
Fig. 7Sound pressure levels of different observation points with lateral windows
a) Observation points 1, 2, 3
b) Observation points 4, 5, 6
Fig. 8Contours of sound pressures of three observation panels
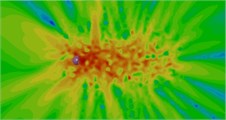
a) 2000 Hz (panel 1)
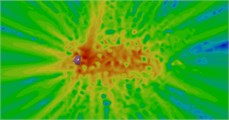
b) 4000 Hz (panel 1)
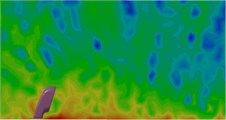
c) 2000 Hz (panel 2)
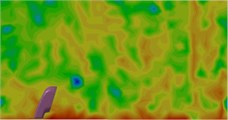
d) 4000 Hz (panel 2)
e) 2000 Hz (panel 3)
f) 4000 Hz (panel 3)
4. Experimental verification of flow noises of rear view mirrors
In order to verify correctness of computational results of aerodynamic noises of the rear view mirror, wind tunnel test was conducted on the rear view mirror. The rear view mirror was fixed by a panel. Therefore, wind noises caused by the rear view mirror could be analyzed separately; interference of other factors would be eliminated; and experimental target for developing a low-noise rear view mirror could be satisfied. In addition, tests on the aerodynamic noise of rear view mirrors were conducted in a wind tunnel, wherein the wind tunnel was a closed circuit structure, size of the experimental section was 8 m × 4 m × 2 m, and the experimental wind speed was controlled within 5 m/s-60 m/s. The rear view mirror was fixed on a round disk, and then the round disk was fixed on the panel, wherein the panel was 1000 mm long and 120 mm wide. Both the length and the width were enough to cover turbulent flow regions behind the rear view mirror. In order to make pipeline layout convenient and place the rear view mirror in a free flow region of the wind tunnel, 7 supports with height of 1000 mm were used to fix the plane, and edges of the plane and supports were processed by round corner polishing, so effects of sharp edge noises on aerodynamic noises of the rear view mirror could be reduced, as shown in Fig. 9(a). Microphones in Fig. 9(b) were installed in tail flow regions of the rear view mirror, wherein the end part of the microphone was as high as the plane. Amounts and positions of observation points are shown in Fig. 9(a). Five observation points were located on circumference with the radius of 200 mm and at the interval of a 15° angle. The 6th observation point was located at the position 400 mm away from the downstream of the round disk. Schematic diagram of the wind tunnel test was shown in Fig. 9(c). After the fan in the wind tunnel was started, the wind speed was increased gradually. After the wind speed was stabilized to 120 km/h, sound pressure levels of each observation point were collected, wherein the sampling frequency was 10000 Hz. Each experimental test was conducted for 3 times. The average value of three results was taken as the final experimental result and compared with the numerical simulation results, as shown in Fig. 10.
Fig. 9Experimental test of sound pressure levels of the rear view mirror
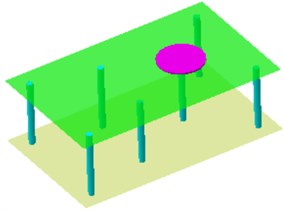
a) Fixation of the rear view mirror
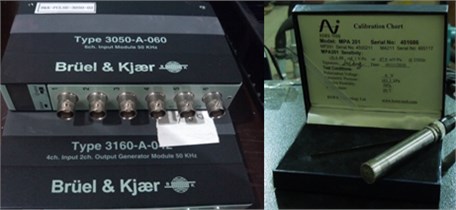
b) Experimental equipment
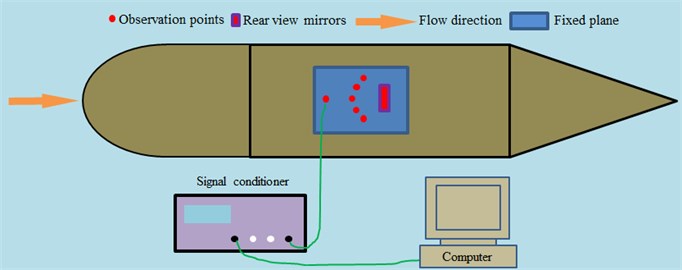
c) Schematic diagram of experimental test
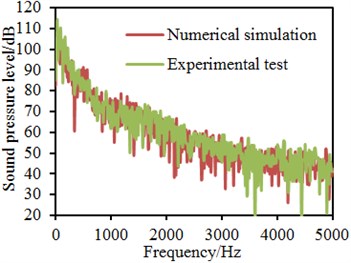
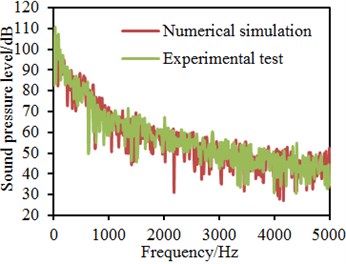
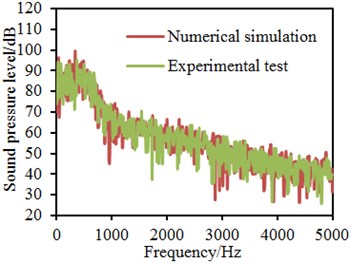
It is shown in Fig. 10 that changing rules of sound pressure levels in the experiment and numerical simulation were basically consistent at each observation point. When the analyzed frequency was less than 1000 Hz, sound pressure levels of each observation point were high, and the sound pressure levels decreased obviously with the increased frequency. When the analyzed frequency was more than 1000 Hz, sound pressure levels of each observation point tended to become steady, where the sound pressure levels decreased gently with the increased frequency. Within the whole frequency, the sound pressure levels did not present peaks, belonging to a wide band noise. In addition, aerodynamic noises of observation points 4, 5 and 6 were obviously stronger than those of observation points 1, 2 and 3, as the observation points 4, 5 and 6 were located in the vortex region behind the rear view mirror. Observation point 1 had the minimum aerodynamic noise because it was far from the vortex region behind the rear view mirror. Differences only appeared at some sound-pressure valley frequency points. In the wind tunnel experiment, in order to obtain free flow fields, the rear view mirror was fixed on the plane as shown in Fig. 9(a), so the panel and the fixed round disk would cause interference to experimental results, and would then affect experimental results. However, experimental and numerical simulation results were highly consistent in the whole frequency band, so the wind tunnel test could be replaced by numerical simulation.
Fig. 10Comparisons of sound pressure levels between simulation and experimental test
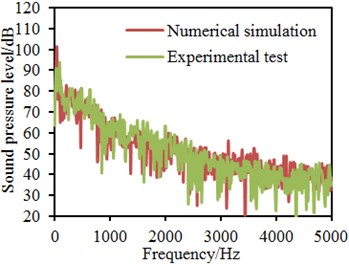
a) Observation point 1
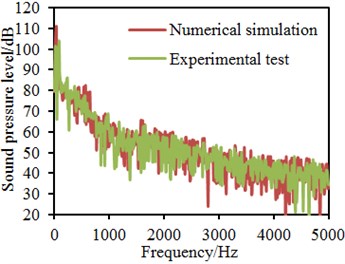
b) Observation point 2
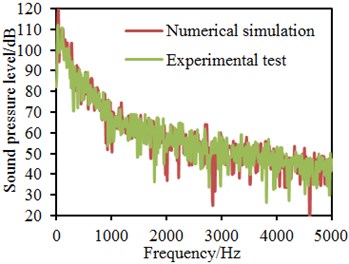
c) Observation point 3
d) Observation point 4
e) Observation point 5
f) Observation point 6
5. Numerical optimization of flow noises of rear view mirrors
5.1. Numerical optimization of flow noises of rear view mirrors
All the convex and concave structures on a creature surface will reduce motion resistance and noise [30, 31]. There are some successful cases. For example, convex structures of a rugby ball and concave structures of golf balls would effectively reduce flight resistance and noise. Therefore, the paper took an original rear view mirror as the model, applied the bionic noise reduction principles, and applied aerodynamic noise characteristics of the head convex hull of dung beetle in Fig. 11(a) to modify the rear view mirror cover, as shown in Fig. 11(b) and Fig. 11(c). The bionic convex structure was a hemisphere with radius of 3 mm, and distance between the adjacent convex structures was 20 mm. In this way, effects of the bionic structure on aerodynamic characteristics and aerodynamic noise of the region could be studied. Due to the bionic structure, small streamline vortexes would be generated around the rear view mirror. These vortexes could effectively stabilize airflows of the rear view mirror.
Fig. 11Structures of bionic rear view mirrors
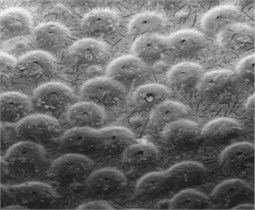
a) Head convex hull of dung beetle
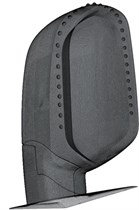
b) Bionic rear view mirrors
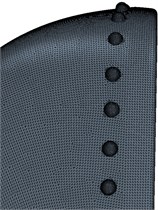
c) Convex hull
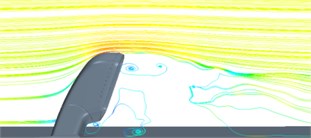
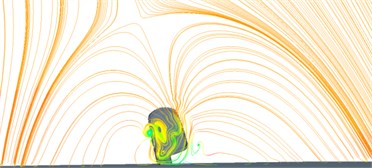
Flow fields of the bionic rear view mirror were computed. Computational results were compared with the original model, as shown in Fig. 12, Fig. 13 and Fig. 14. It is shown in Fig. 12: two obvious vortexes with the opposite rotation directions were behind the original model of rear view mirrors; because of the convex shape, no obvious vortexes were caused behind the rear view mirror, so aerodynamic noises near the lateral window was reduced. Vortexes in the longitudinal cross section of the rear view mirror were extracted, as shown in Fig. 13. It could be found: only one obvious vortex was behind the bionic rear view mirror, but two obvious vortexes with the opposite rotation directions were behind the rear view mirror in the original model. The reason was that the convex hull of the bionic rear view mirror would cause generation of tiny streamline vortexes around the rear view mirror, while these vortexes played an important role in stabilizing airflows of the rear view mirror. Because of the convex structure on the rear view mirror cover, stability of boundary layers on the rear view mirror cover could be improved. In this way, total amount of airflows flowing through the bionic rear view mirror within the unit time would be reduced relatively, and more air would flow under the rear view mirror, so that airflows on the bottom were strengthened and vortexes were affected. The bionic rear view mirror did not present vortex near the lateral window, so impacts of vortexes on noises in the vehicle could be eliminated effectively. Fig. 14 shows comparison results of velocity streamlines in front of the rear view mirror. It is found in the figure: two obvious large vortexes with opposite rotation directions were in front of the rear view mirror of the original model and only a small-size vortex was in front of the bionic rear view mirror, so pressures in front of the bionic rear view mirror would be low.
Fig. 12Comparison of three-dimensional velocity streamlines of rear view mirrors
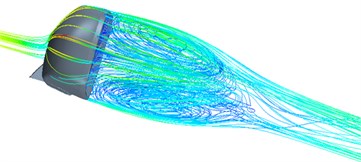
a) Original rear view mirrors
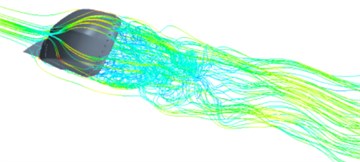
b) Bionic rear view mirrors
Fig. 13Comparison of vortexes behind rear view mirrors
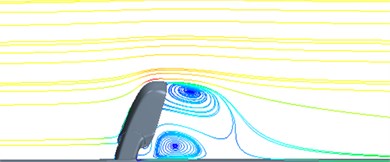
a) Original rear view mirrors
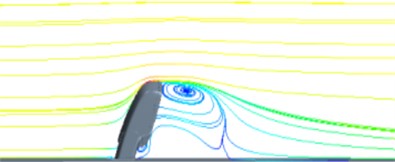
b) Bionic rear view mirrors
Fig. 14Comparison of velocity streamlines in front of rear view mirrors
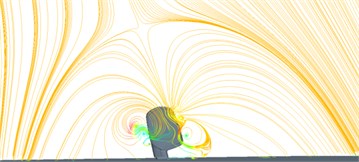
a) Original rear view mirrors
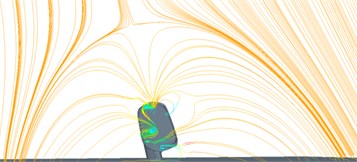
b) Bionic rear view mirrors
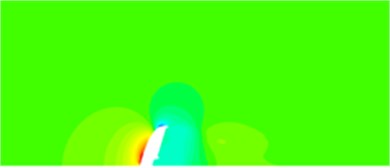
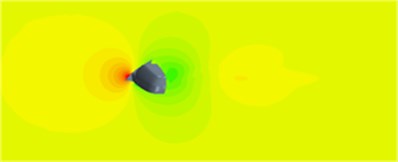
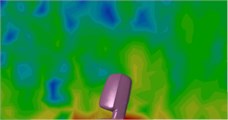
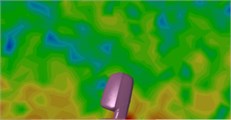
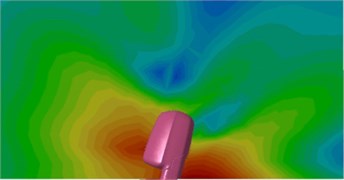
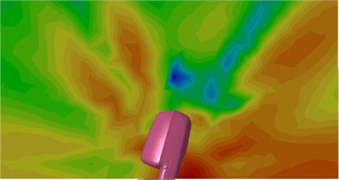
Pressure and noise source contours of the original and bionic rear view mirrors were extracted for comparison, as shown in Fig. 15 and Fig. 16. The windward face of the rear view mirror was a positive high-pressure region, and the leeside was a negative low-pressure region. Through comparison of pressure contours of the rear view mirror before and after modification, it could be found: the pressure difference in front of and behind the bionic view mirror was smaller than the pressure difference in front of and behind the original rear view mirror. Pressure resistance caused by the convex structure outside the rear view mirror was reduced, so noise reduction could be promoted. Pressures were large especially near the lateral window as the flow velocity of airflows here was large and pressures caused by collision to the rear view mirror bottom would be larger. A low-pressure region was at the tail part of the rear view mirror, and positions of the low-pressure region and vortex centers were basically consistent because the static pressure at the low-pressure center was low and force caused by the pressure difference provided the centripetal force for vortex motion. Therefore, when the vehicle ran, the low-pressure region and low-pressure center would appear at the rear part of the rear view mirror. As a result, violent turbulent flows appeared at the tail part of the rear view mirror and aerodynamic noises were intensified. In addition, it could also be found that the pressure at the front part of the bionic rear view mirror was also smaller than that of the original structure. When airflows blew in the face, pressure fluctuations could be generated easily on the downstream of the rear view mirror. This region became a very strong aerodynamic noise source. However, noise source intensity and scope of the bionic rear view mirror were obviously smaller than those of the rear view mirror of the original model. It was found through comparison that vortex shapes and sizes of two kinds of rear view mirrors were different, wherein the size of vortexes above the bionic rear view mirror was smaller than that of the original rear view mirror. According to vortex sound theories, the rotating vortexes would cause pressure fluctuations, while pulsation pressures acting on the body surface will generate surface vibration and thus cause aerodynamic noises. Meanwhile, rotating vortexes would also increase aerodynamic resistance. It could be deduced that aerodynamic noises and aerodynamic resistance of the bionic rear view mirror were smaller than those of the original rear view mirror.
Fig. 15Comparison of pressure contours of rear view mirrors before and after optimization

a) Original rear view mirrors

b) Bionic rear view mirrors
Fig. 16Comparison of noise sources of rear view mirrors before and after optimization
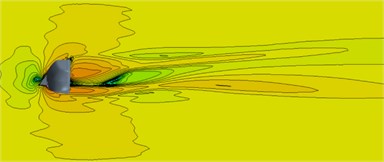
a) Original rear view mirrors
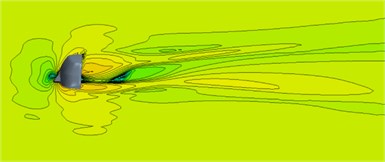
b) Bionic rear view mirrors
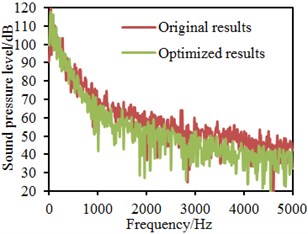
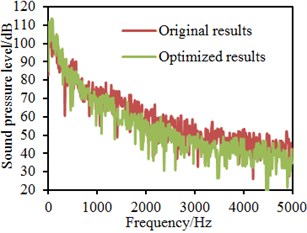
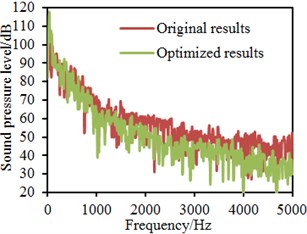
Aerodynamic noises at each observation point of the bionic rear view mirror were computed. Computational results were compared with the original model, as shown in Fig. 17. It is found: the convex structure mainly affected the aerodynamic noise in mid-high regions. During vehicles running, low-frequency noises were mainly manifested by vibration noise of an engine. Therefore, the paper mainly studied noise reduction effects of the bionic rear view mirror in mid-high regions. Aiming at the mid-high regions, sound pressure levels of two kinds of rear view mirrors differed a lot at observation points 1, 2 and 6. Compared with the rear view mirror of original model, noise reduction effects of the bionic rear view mirror were obvious at the positions, wherein the noise reduction amplitude reached 10 dB. The improved effect in the observation point 3 was not very obvious because this point was at the special position, and the bionic structure did not affect the flow field in this region. Basic rules of aerodynamic noises caused by two kinds of models were consistent. When the analyzed frequency was less than 1000 Hz, sound pressure levels of each observation point were high, and the sound pressure levels decreased obviously with the increased frequency. When the analyzed frequency was more than 1000 Hz, sound pressure levels of each observation point tended to become steady, where the sound pressure levels decreased gently with the increased frequency. Within the whole frequency band, the sound pressure levels showed no peaks, belonging to a wide band noise. Sound pressure contours of the rear view mirror on each observation plane were extracted, as shown in Fig. 18. Compared with Fig. 8, it could be found that noise source size and intensity of the bionic rear view mirror were reduced obviously. The reason was that when airflows flowed through the convex hull of rear view mirrors, vortexes would be broken due to collision to the convex hull, and size of the vortexes would be reduced. Size of the small-size vortexes was small compared with the rear view mirror, so obvious aerodynamic noises would not be generated.
Fig. 17Comparisons of sound pressure levels before and after optimization
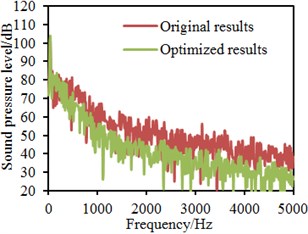
a) Observation point 1
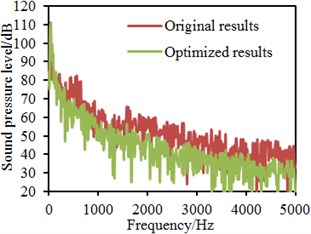
b) Observation point 2
c) Observation point 3
d) Observation point 4
e) Observation point 5
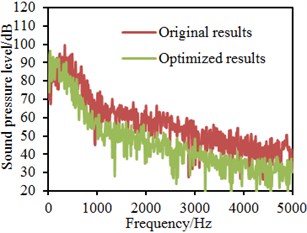
f) Observation point 6
Fig. 18Sound pressure contours of different observation panels after optimization
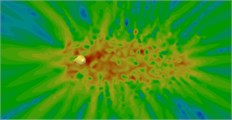
a) 2000 Hz (panel 1)
b) 4000 Hz (panel 1)
c) 2000 Hz (panel 2)
d) 4000 Hz (panel 2)
e) 2000 Hz (panel 3)
f) 4000 Hz (panel 3)
5.2. Impacts of lateral windows on aerodynamic noises of rear view mirrors
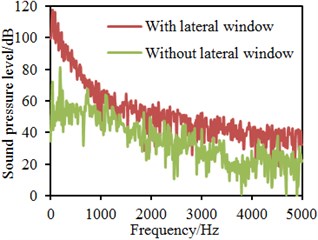
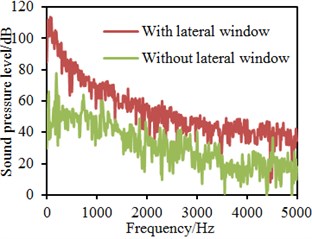
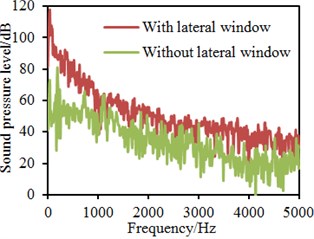
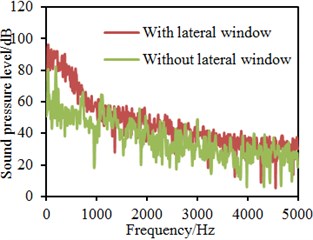
In the mentioned computation of aerodynamic noises of the rear view mirror, both the rear view mirror and the lateral window wall face were considered as the noise sources. In order to study impacts of lateral windows on aerodynamic noises of the rear view mirror, only the rear view mirror was taken as the noise source during computing aerodynamic noises of the rear view mirror. Obtained results were compared with computational results with considering the rear view mirror and the lateral window wall faces, as shown in Fig. 19.
Fig. 19Comparisons of sound pressure levels with and without lateral windows
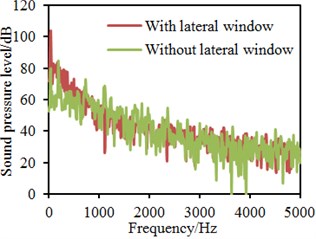
a) Observation point 1
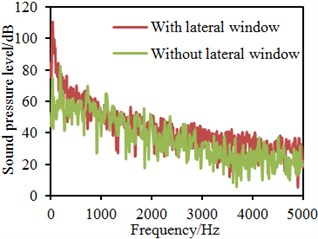
b) Observation point 2
c) Observation point 3
d) Observation point 4
e) Observation point 5
f) Observation point 6
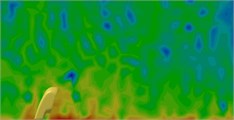
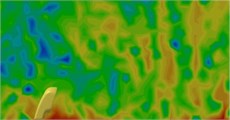
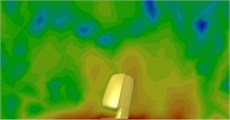
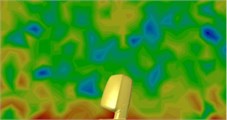
It is shown in the figure that the lateral window wall face had large impacts on aerodynamic noises of the rear view mirror especially at observation points 3, 4, 5 and 6. Impacts on observation points 1 and 2 were not obvious. The reason was that airflows would cause obvious vortexes near the lateral window wall face. Observation points 1 and 2 were far from the vortex region behind the rear view mirror, while other observation points were located in the vortex region behind the rear view mirror. When the lateral window wall face was neglected, impacts of vortexes of lateral windows on aerodynamic noises would be neglected. Observation points 1 and 2 were far from the vortex region of the lateral window wall face, noises would not be obviously affected when the lateral window wall face was neglected. Therein, impacts of the lateral window on observation point 6 were not as obvious as impacts on observation points 3, 4 and 5 because the observation point 6 was located at the tail part of the vortex region of the rear view mirror and only slightly affected by the vortex. Noise contours of three observation planes of the rear view mirror were extracted, as shown in Fig. 20. Compared with Fig. 18, it could be found: noise intensity without considering the lateral window wall face was obviously lower than the result with considering the lateral window wall face. Especially on the plane 1, the noise contour without considering the lateral window is similar to results caused by a monopole noise source. The reason is that only the rear view mirror was taken as the aerodynamic noise source, the size of rear view mirrors was small compared with the whole observation plane and the computational domain, and thus it could be roughly deemed as a monopoly sound source. As shown in Fig. 18, the noise contour with considering the lateral window was obviously different from the monopole noise source as obvious vortexes were on the lateral window wall faces; noise caused by vortexes would cause noise superposition with the rear view mirror; and noise caused by vortexes of lateral windows would play a dominant role in the plane.
Fig. 20Sound pressure contours of different observation panels without lateral windows
a) 2000 Hz (panel 1)
b) 4000 Hz (panel 1)
c) 2000 Hz (panel 2)
d) 4000 Hz (panel 2)
e) 2000 Hz (panel 3)
f) 4000 Hz (panel 3)
6. Conclusions
With an original rear view mirror as the basic model, the paper applied a head convex hull of a dung beetle to the original rear view mirror cover to obtain a bionic rear view mirror, then conducted numerical computation for aerodynamic noises of the bionic rear view mirror and compared the computational results with the original model. Finally, in order to verify correctness of computational results of aerodynamic noises of the rear view mirror, wind tunnel test was conducted on the rear view mirror. Experimental and numerical simulation results were highly consistent in the whole frequency band, so the wind tunnel test could be replaced by numerical simulation. Based on the simulation model, the addressed conclusions can be achieved:
1) The low-velocity region behind the rear view mirror in the longitudinal cross section was composed of two low-velocity vortexes with opposite rotation directions. Sizes of two vortexes were very different. The vortexes near the lateral window surface had higher intensity and velocity; intensity of the vortexes near the rear view mirror edge was relatively weak; and the shape was presented to an oval shape along the airflow flowing direction. The windward face of the rear view mirror was a positive high-pressure region, and the leeside was a negative low-pressure region. Especially in regions near the lateral window.
2) Only one obvious vortex was behind the bionic rear view mirror, but two obvious vortexes with the opposite rotation directions were behind the original rear view mirror. The bionic rear view mirror did not present vortexes near the lateral window, so impacts of vortexes on noises in the vehicle could be eliminated effectively.
3) Pressure difference in front of and behind the bionic view mirror was smaller than the pressure difference in front of and behind the original rear view mirror. Pressure resistance caused by the convex structure outside the rear view mirror was reduced, so noise reduction could be promoted. Noise source intensity and scope of the bionic rear view mirror were obviously smaller than those of the rear view mirror of the original model.
4) The convex structure mainly affected the aerodynamic noise in mid-high frequency regions. Aiming at the mid-high frequency regions, sound pressure levels of two kinds of rear view mirrors differed a lot at observation points 1, 2 and 6. Compared with the original rear view mirror, noise reduction effects of the bionic rear view mirror were obvious, where the noise reduction amplitude reached 10 dB. Noise source size and intensity of the bionic rear view mirror were reduced obviously.
5) The lateral window wall face had large impacts on aerodynamic noises of the rear view mirror especially at observation points 3, 4, 5 and 6. Impacts on observation points 1 and 2 were not obvious. Noise intensity without considering the lateral window wall face was obviously lower than the result with considering the lateral window wall face. Especially on the plane 1, the noise contour without considering the lateral window is similar to results caused by a monopole noise source. The noise contour with considering the lateral window was obviously different from the monopole noise source.
References
-
Kang Q., Zuo S., Wei K. Study on the aerodynamic noise of internal flow of regenerative flow compressors for a fuel-cell car. Proceedings of the Institution of Mechanical Engineers, Part C: Journal of Mechanical Engineering Science, Vol. 228, Issue 7, 2014, p. 1155-1174.
-
Beigmoradi S., Hajabdollahi H., Ramezani A. Multi-objective aero acoustic optimization of rear end in a simplified car model by using hybrid robust parameter design, artificial neural networks and genetic algorithm methods. Computers and Fluids, Vol. 90, 2014, p. 123-132.
-
Sharma R. B., Bansal R. CFD simulation for flow over passenger car using tail plates for aerodynamic drag reduction. IOSR Journal of Mechanical and Civil Engineering, IOSR-JMCE, Vol. 7, Issue 5, 2013, p. 28-35.
-
Yang Z., Gu Z., Wang Y., et al. Prediction and optimization of aerodynamic noise in an automotive air conditioning centrifugal fan. Journal of Central South University, Vol. 20, Issue 5, 2013, p. 1245-1253.
-
Kim J. H., Han Y. O. Experimental investigation of wake structure around an external rear view mirror of a passenger car. Journal of Wind Engineering and Industrial Aerodynamics, Vol. 99, Issue 12, 2011, p. 1197-1206.
-
Phan V. L., Tanaka H., Nagatani T., et al. A CFD analysis method for prediction of vehicle exterior wind noise. SAE International Journal of Passenger Cars-Mechanical Systems, Vol. 10, 2017, p. 286-298.
-
Ding G. M., Tan Z. H. Efficient indoor fingerprinting localization technique using regional propagation model. IEICE Transactions on Communications, Vol. 97, Issue 8, 2014, p. 1728-1741.
-
Yuan H., Yang Z., Li Q. Effects of installation environment on flow around rear view mirror. SAE International Journal of Passenger Cars-Mechanical Systems, Vol. 10, 2017, p. 580-590.
-
Maffei M., Bianco A. Improvements of the beamforming technique in pininfarina full scale wind tunnel by using a 3d scanning system. SAE International Journal of Materials and Manufacturing, Vol. 1, 2008, p. 154-168.
-
Du J., Xiao P., Wu J., et al. Design of isotropic orthogonal transform algorithm-based multicarrier systems with blind channel estimation. IET Communications, Vol. 6, Issue 16, 2012, p. 2695-2704.
-
Khalighi B., Johnson J. P., Chen K., et al. Experimental Characterization of the Unsteady Flow Field Behind Two Outside Rear View Mirrors. Lecture Notes in Applied and Computational Mechanics, Vol. 41, Springer, Berlin, Heidelberg, 2008.
-
Chen X., Feng X., Shen C. L., Wang S., Hu C. S. An experimental study on the effects of exterior rearview mirrors styling on aerodynamic noise. Automotive Engineering, Vol. 39, Issue 2, 2017, p. 206-213.
-
Tomac M. N., Yugulis K., Gregory J. W. Investigation of side-view mirror flow induced vibration phenomena. Applied Acoustics, Vol. 70, Issue 7, 2009, p. 964-972.
-
Onur Y. Pressure measurements of the flow over a rearview side mirror. International Journal of Sciences, Vol. 2, Issue 8, 2013, p. 66-69.
-
Martini H., Gullberg P., Lofdahl L. Comparative studies between CFD and wind tunnel measurements of cooling performance and external aerodynamics for a heavy truck. SAE International Journal of Commercial Vehicles, Vol. 7, 2014, p. 640-652.
-
Yang K., Martin S., Xing C. W., et al. Energy-efficient power control for device-to-device communications. IEEE Journal on Selected Areas in Communications, Vol. 34, Issue 12, 2016, p. 3208-3220.
-
Ask J., Davidson L. A numerical investigation of the flow past a generic side mirror and its impact on sound generation. Journal of fluids Engineering, Vol. 131, Issue 6, 2009, p. 61102-2.
-
Gong J. Analysis and test on aerodynamic noise of water blocking strip for vehicle rear view mirror. Auto Engineer, Vol. 1, 2017, p. 18-21.
-
Xu P., Li C. H., Zhao W. F., Liu E. B. Aerodynamic noise control of a SUV rearview mirror. Auto Engineer, Vol. 11, 2014, p. 37-40.
-
Ogawa S., Kawate T., Takeda J., Omori I. Side-view mirror vibrations induced aerodynamically by separating vortices. Open Journal of Fluid Dynamics, Vol. 6, 2016, p. 42-56.
-
Song X., Zhang G., Wang Y., et al. Use of bionic inspired surfaces for aerodynamic drag reduction on motor vehicle body panels. Journal of Zhejiang University-SCIENCE A, Vol. 12, Issue 7, 2011, p. 543-551.
-
Yang K., Yang N., Xing C. W., et al. Space-time network coding with transmit antenna selection and maximal-ratio combining. IEEE Transactions on Wireless Communications, Vol. 14, Issue 4, 2015, p. 2106-2117.
-
Ge C., Sun Z. L., Wang N., et al. Energy management in cross-domain content delivery networks: a theoretical perspective. IEEE Transactions on Network and Service Management, Vol. 11, Issue 3, 2014, p. 264-277.
-
Gu Z. Q., Guo J. C., Zhang Q. L., et al. Simulation study into the influence of appearance variation of a sport car's rear wing on the aerodynamic lift. Transactions of Beijing Institute of Technology, Vol. 32, Issue 3, 2012, p. 248-252.
-
Le T. Q., Ko J. H., Byun D., et al. Effect of chord flexure on aerodynamic performance of a flapping wing. Journal of Bionic Engineering, Vol. 7, Issue 1, 2010, p. 87-94.
-
Shang J. K., Combes S. A., Finio B. M., et al. Artificial insect wings of diverse morphology for flapping wing micro air vehicles. Bioinspiration and Biomimetics, Vol. 4, Issue 3, 2009, p. 36002.
-
Han F. X., Zhao S. J., Zhang L., et al. Survey of strategies for switching off base stations in heterogeneous networks for greener 5G systems. IEEE Access, Vol. 4, 2016, p. 4959-4973.
-
Serrano P., Costa Perez X., Wu J. S., et al. Green communications. Computer Networks, Vol. 78, 2015, p. 1-3.
-
Zhao G., Gu Y., Zhao H., et al. Numerical simulation of the drag reduction characteristics of a bionic jet surface aperture coupled with jet speed. Journal of Harbin Engineering University, Vol. 33, Issue 8, 2012, p. 1001-1007.
-
Luo Q. L., Fang W. Reliable broadband wireless communication for high speed trains using baseband cloud. EURASIP Journal on Wireless Communications and Networking, Vol. 2012, 2012, p. 1-12.
-
Xiao P., Sellathurai M. Iterative multiuser detection and decoding for DS-CDMA system with space-time linear dispersion. IEEE Transactions on Vehicular Technology, Vol. 58, Issue 5, 2009, p. 2343-2353.
Cited by
About this article

This project was Supported by Major Program of National Natural Science Foundation of China (61534003), National Natural Science (81371663), and Natural Science Foundation of Jiangsu Province of China (BK20170448).
