Abstract
In order to figure out the dynamics response of vibrator baseplate and why baseplate performs poorly at high frequencies, a finite element model of vibrator-ground is developed to analyze acceleration, deformation and decoupling of the baseplate at low and high frequencies. Results show that the acceleration at low frequencies is in accordance with the function of hydraulic pressure. On the contrary, the acceleration at high frequencies is irregular and fluctuant. Within the bandwidth, the maximum deformation locates in the central area, and the baseplate deformation in long-axis direction is greater than that in minor-axis direction. Compared to low frequencies, dynamics response at high frequencies suffers response delay, and the vibrator structure is very sensitive to asymmetry, resulting in warping and waveform deformation. Baseplate experiences decoupling at both low and high frequencies, however, the decoupling at high frequencies occurs more frequently, which leads to more serious distortion. It is also found that symmetrical structure is helpful for reducing negative deformation. In conclusion, high fluctuation of acceleration, response delay and harmonic caused by complicated deformation and decoupling distortion reduce the quality of output signal and block the bandwidth towards high frequencies.
1. Introduction
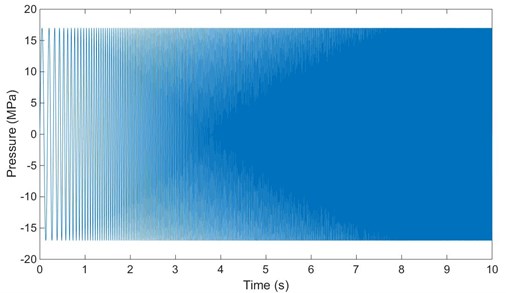
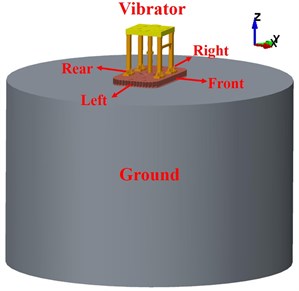
Vibroseis (as shown in Fig. 1) is widely used in oil and gas exploration because of its environmental protection, safety and high efficiency. The major performance indexes of vibroseis include bandwidth, phase, ground force and degree of harmonic and distortion. High precision exploration puts higher requirements on output signal characterized with big broadband, synchronization, and low harmonic distortion. Output signal is generated by sweep signal (input signal) acting on vibrator, and then transmitted into the ground through the vibrator baseplate. Sweep signal is sin-shaped hydraulic fluid. Fig. 2 shows a linear sweep from 5 Hz to 120 Hz with a length of 10 seconds at pressure amplitude of 17 MPa. The bandwidth and quality of output signal are important factors in determining the depth and precision of oil and gas exploration. Low frequencies are helpful for the inversion of seismic trace data, which can highly improve the accuracy of surface-derived velocity sections [1, 2]. High frequencies are most useful for enhancing spatial and temporal resolution as found in shallow or vertical seismic profiling (VSP) surveys [3].
As the source of output signal, vibrator directly determines the bandwidth and quality of output signal. In field application, the output signal at low frequencies is satisfactory with good synchronism and high signal-noise ratio, but poor at high frequencies with insufficient ground force, high phase, high harmonic and serious distortion [4]. In order to obtain large ground force and high-quality output signal, many engineers and scholars have attempted a lot of approaches and researches. Baeten et al. implemented a down hole test, which showed that signals as low as 3 Hz could be recorded successfully, and the accuracy of ground force could also be improved by using multiple accelerometers [5]. Bagaini proposed a new method, maximum displacement sweep, for enhancing low frequency signal [6, 7]. Borehole seismic data indicated that this new approach significantly improved the signal-to-noise ratio of the output signal and it was an economical and effective way for industrial application. Sallas provided an excellent description and analysis of vibroseis, and concluded that there were two elements that limited the expansion towards low frequency: one was the stroke of reaction mass, and the other was the flow of pump [8]. Margrave et al. carried out a seismic survey on the performance of vibroseis at low frequencies [9]. They found that suitably designed vibroseis with custom sweeps could perform very well down to frequencies approaching 2 Hz. In 2015, Bureau of Geophysical Prospecting (BGP) designed a new generation of vibroseis, adopting long-stroke vibrator and multi-pumps confluence technology. This vibroseis could provide low frequencies down to 1.5 Hz, and field test demonstrated that the vibroseis was successful and reliable that it would be used in exploration soon [10].
Fig. 1Vibroseis in exploration field
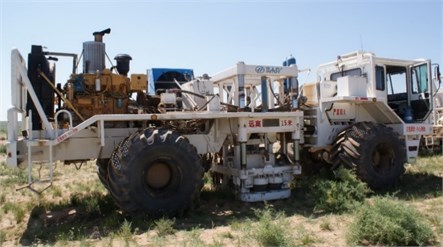
Fig. 2Sweep signal
Extension and application of low frequencies have achieved great progress, but the vibrator can’t provide high-quality output signal due to the poor performance of baseplate at high frequencies. In a 1984 paper, Sallas introduced weighted sum method which was based on measuring the acceleration of reaction mass and baseplate to calculate the ground force [11]. Unfortunately, researchers have verified that the weighted sum method does not provide a true representation of the ground force [12-14], because the acceleration measured by the sensors is not reliable as the baseplate suffers unpredictable deformation at high frequencies [15-17]. Hendrix analyzed the response of baseplate at high frequencies using multiple accelerometers mounted on the baseplate [18]. His analysis indicated that the deformation of baseplate was not uniform and the edge of baseplate experienced more severely, and Wei et al. [19] got the same conclusion. Dean employed a thin-film pressure pad and a downhole tool for the first time to reveal the baseplate-ground interaction [20]. The test showed that decoupling existed between the baseplate and ground, thus the response of baseplate was more complex than previously thought.
The vibroseis has achieved satisfactory progress at low frequencies, but output signal at high frequencies is still in poor quality. The performance of baseplate is quite well at low frequencies but poor at high frequencies, which has been confirmed by different tests, yet no in-depth or detailed study is developed from micro view. To successfully transmit high-quality output signal for the vibroseis, it is crucial to fully understand the response of baseplate and how the response affects the output signal. It is very difficult to obtain accurate and graphic response of baseplate under operating conditions, but finite element analysis (FEA) can provide an effective approach. Therefore, a finite element analysis model of vibrator and ground is established for simulating the vibrator baseplate dynamics response, analyzing acceleration, deformation and decoupling at low and high frequencies, and evaluating the impact of response on output signal. Moreover, a structure of vibrator is developed based on the analysis, which is proved to be helpful for reducing deformation. Finally, suggestion for vibrator design and application is proposed, to enhance the quality of output signal in bandwidth, especially at high frequencies.
2. Vibrator structure
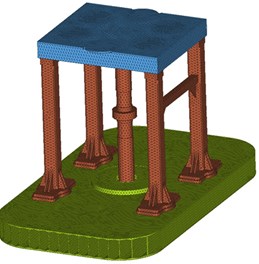
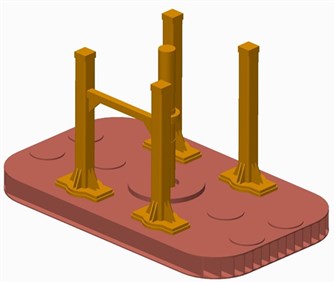
Vibrator is the key component of vibroseis, consisting of top plate, reaction mass, piston, baseplate, supporting columns and other accessory structures, as shown in Fig. 3. Top plate rigidly connects with baseplate by four supporting columns and one piston, and the piston is mounted in the center of baseplate. Reaction mass rings on piston, and is supported by two air suspensions on baseplate. Upper chamber and lower chamber are between reaction mass and piston, where the hydraulic force drives reaction mass to move. During working process, the vibroseis is lifted up by the lifting hydraulic cylinder, and most of its weight (hold-down weight) applies on top plate and baseplate to maintain good contact with the ground. Then high-pressure hydraulic fluid flows into the upper chamber and lower chamber alternately, driving reaction mass to move up and down. At the same time, the reactive force impacts on the piston face, then force and output signal are transmitted into the ground through the baseplate.
Fig. 3Vibrator structure: a) a vibrator mounted on vibroseis, b) CAD model of vibrator
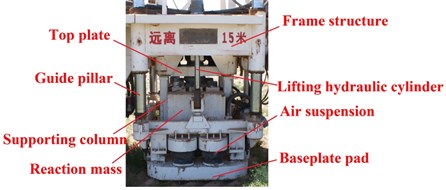
a) A vibration mounted on vibroseis
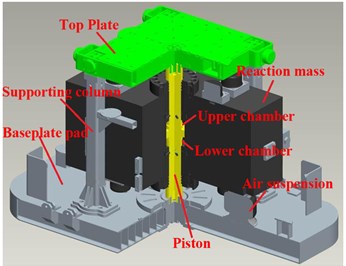
b) CAD model of vibratoe
3. Finite element model of vibrator dynamics simulation analysis
3.1. Geometry model
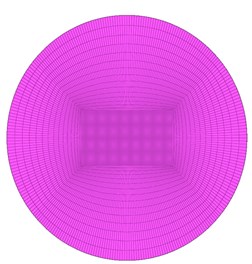
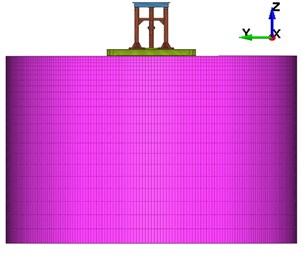
According to the structure and operating principle of vibrator, two simplifications of the structure are carried out as follows: (a) removing the reaction mass and the appurtenances of the baseplate as the role of the reaction mass is replaced by dynamic load; (b) ignoring small chamfers and fillets. Each part of the vibrator was developed based on real geometries of the vibrator. For example, the height of the vibrator model is 1283 mm, the size of the baseplate is 2130×1240×160 mm, and the corner radius of the baseplate is 308 mm. The dimension of the captured ground (ground coupled with baseplate) is a hemisphere with about 1.2 m radius [21]. To ensure the captured ground is fully considered, the ground is modeled as a cylinder with 7 m in diameter and 4.5 m in height. On the basis of above simplification and analysis, geometry model of vibrator-ground is established as shown in Fig. 4, and the directions of the model are also demonstrated.
Fig. 4Geometry model of vibrator-ground
3.2. Meshing and material setting
Fig. 5 shows the meshing of the model. The vibrator is meshed with tetrahedron grid as tetrahedron grid is used in complex structure to guarantee accuracy, and the size is from 10 to 20 mm. The ground model is meshed with hexahedral grid, element size of contact region is 20 mm, and the rest part is meshed with sparse grid from central area to edge to calculate precisely and efficiently. The material of top plate, supporting columns and piston is 1045 steel, and the baseplate is A210C steel. The ground is rock and soil which is similar to regular working field.
Fig. 5Meshing of vibrator-ground model
a) Vibration meshing
b) Ground meshing
c) Vibration-ground meshing
3.3. Load applying
3.3.1. Static load
1) Gravity: gravity applies on every grid node in form of gravitational acceleration.
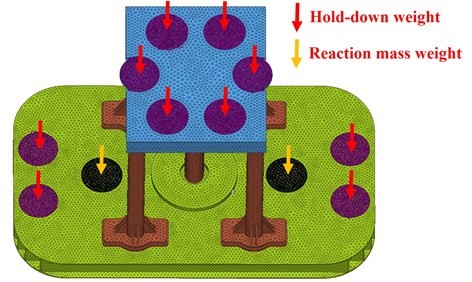
2) Hold-down weight: hold-down weight is 80 % of the vibroseis weight, about 225 KN. 90 % of hold-down weight applies on the top plate, and the rest applies on the baseplate, as the purple regions clearly illustrated in Fig. 6.
3) Reaction mass weight: the black circles in Fig. 6 represents reaction mass weight, which equally loads on the two pedestals of air suspensions.
Fig. 6Acting positions of hold-down weight and reaction mass weight
3.3.2. Dynamic load
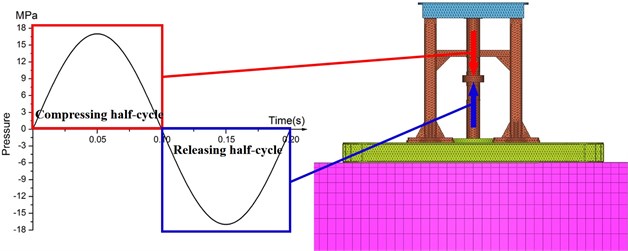
Dynamic load is the hydraulic pressure acting on the faces of piston. The hydraulic pressure is a sin shaped load with 17 MPa peak value. Generally, due to the limitation of hydraulic system, low frequencies are below 10 Hz and high frequencies are above 100 Hz. In field exploration, the bandwidth of operating sweep signal is from 5 to 120 Hz. It is impossible and unnecessary to simulate every frequency, so dynamics simulation analysis is conducted at 5, 8, 10, 100, 110, 120 Hz. In order to obtain stable and reliable simulation solution, each frequency sweeps for 5 cycles. In Fig. 7 the sin curve represents the dynamic load of one cycle at 5 Hz. The load cure in red box means the compressing half-cycle, which applies on the upper face of the piston. The cure in blue box shows the releasing half-cycle, which acts on the lower face of the piston.
Fig. 7The dynamic load and the acting positions
3.4. Boundary setting
The contact type between the baseplate and the ground is automatic surface to surface contact, which allows free separation. The ground model as a whole does not move, so full displacement constraint is applied to the bottom and around of the ground. Non-reflecting boundary is also applied to the bottom and around of the ground, which can simulate the infinite earth. In this case, the stress wave is absorbed by the boundary instead of reflecting. Finally, the dynamic simulation was conducted through LS-DYNA program.
4. Dynamics response of vibrator baseplate
Vibroseis is a closed-loop control system, using ground force as feedback signal. Ground force is the resulting contact force at the interface of baseplate and ground, which represents how much energy is transferred into the earth. Calculation of ground force depends on the acceleration of baseplate (the default direction is vertical). If the acceleration is not accurate, it will result in inaccurate calculation of the ground force, affecting the phase control of output signal [22]. As the baseplate is not a rigid body, deformation occurs during the working process, which will generate harmonic that drops the quality of output signal [15]. Once the baseplate output region and the ground lose contact in the releasing half-cycle, decoupling will occur. It is destructive to the vibrator and degrades record quality [23, 24]. Therefore, to fully understand the dynamics response of vibrator baseplate, simulation analysis is carried out in three aspects: acceleration, deformation and decoupling.
Through the comparison of simulation results of 5 Hz, 8 Hz, 10 Hz, 100 Hz, 110 Hz, 120 Hz, the responses at low frequencies (5 Hz, 8 Hz, 10 Hz) are similar, while high frequencies (100 Hz, 110 Hz, 120 Hz) responses are also similar. It is unnecessary to illustrate all the results of the six frequencies. Comparison also shows that 5 Hz representing the low frequency stage and 120 Hz representing the high frequency stage have typical difference. Therefore, to describe accurately and analyze in detail, analysis of 5 Hz and 120 Hz is conducted.
4.1. Acceleration analysis of vibrator baseplate
Weighted sum method is widely used in this industry to calculate ground force. The ground force is defined as the weighted sum of the reaction mass and the baseplate accelerations multiplied by their respective mass:
where is ground force, is the mass of reaction mass, is the acceleration of reaction mass, is the mass of baseplate, is the acceleration of baseplate. In Eq. (1) mass of reaction mass and mass of baseplate are fixed; the acceleration of reaction mass can be predicted as the motion of reaction mass is a rigid body motion driven by the sweep signal. In this condition, the acceleration of baseplate is the only variable one and has significant effect on the accuracy of ground force calculating. As the acceleration of the first cycle is unreliable because of loading impact, so the analysis is based on the stable data of the other four cycles. For the same reason, deformation analysis and decoupling analysis would pay attention to the same cycles.
Fig. 8Acceleration of the baseplate at 5 Hz
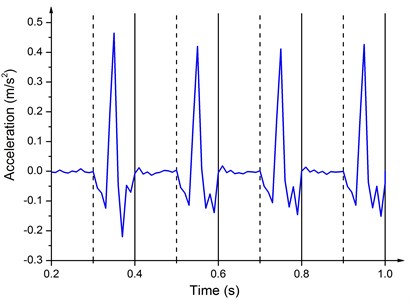
Fig. 8 shows the Z direction (as shown in Fig. 5) acceleration response of the baseplate in latter four cycles at 5 Hz. The value is almost zero in the compressing half-cycle, because the loading process is slow and the downward movement of the baseplate is restricted by the ground. In the releasing half-cycle, as the upward hydraulic force acts on the lower face of the piston and the ground no longer limits the motion of baseplate, the acceleration of baseplate increases sharply, and then, with the decrease of the load, the acceleration also gradually reduces. Some fluctuations of the acceleration happen, because the hydraulic force is decreasing and the elastic restoring force begins to play a leading role, which is similar to mass-spring motion.
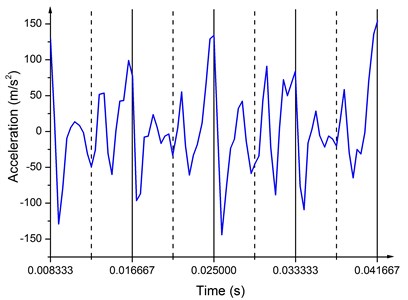
Fig. 9 illustrates the direction acceleration of the baseplate at 120 Hz. The acceleration at 120 Hz fluctuates drastically. The amplitude is from –150 m/s2 to 150 m/s2 and the periodicity is not obvious. Irregular and uncertain acceleration of the baseplate increases the phase difference between the baseplate acceleration and the reaction mass acceleration, reducing the ground force. Compared to the uncertainty at high frequencies, acceleration of the baseplate is stable at low frequencies, thus larger ground force and better quality of the output signal can be achieved.
Fig. 9Acceleration of the baseplate at 120 Hz
4.2. Deformation analysis of vibrator baseplate
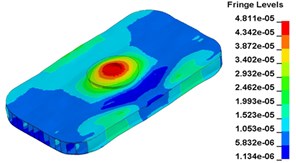
The deformation response of baseplate in each cycle is almost the same. To avoid repetitive work, deformation analysis of low and high frequencies is carried out at several representative time points in the second cycle, including the starting time of the cycle, the peak of the sweep signal, the transition point of the deformation, and the turning point of the deformation. In Fig. 10, sin curve means the sweep signal and 9 red marks represent the time points of the second cycle at 5 Hz. These points are respectively A (0.200 s), B (0.225 s), C (0.0250 s), D (0.275 s), E (0.300 s), F (0.325 s), G (0.350 s), H (0.375 s), I (0.400 s). The deformation analysis of 5 Hz is based on the deformation of these nine time points.
Fig. 10The nine time points of 5 Hz
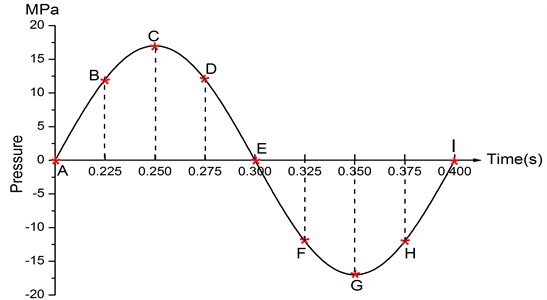
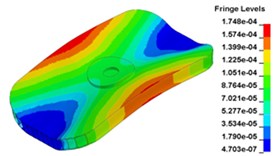
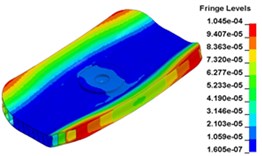
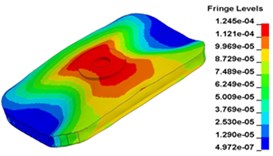
Fig. 11 demonstrates the deformation of the 9 time points in Fig. 10 at 5 Hz, and the deformation is magnified 1500 times to make clear demonstration. Deformation plots from (a) to (e) show that downward deformation occurs in the compressing half-cycle at the central region of the baseplate, and the deformation of piston-baseplate junction is bigger than other part of the baseplate. From 0.300 s to 0.400 s or in the releasing half-cycle, the central region of the baseplate also suffers bigger upward deformation. Plot of time point G shows that the upward deformation is biggest at the peak of the sweep signal, and the left and right edges of the baseplate move downward at the same time. In one sweep cycle, deformation of the releasing half-cycle is much bigger than that of the compressing half-cycle because of the limit of ground. The deformation of left-right direction and front-rear direction are respectively symmetrical at each time points, but the deformation of left-right direction is larger than that of front-rear direction. At the symmetry time points, such as time point B and time point D, time point F and time point H, deformation of these corresponding points are nearly the same. Generally speaking, the deformation at low frequencies follows the trend of hydraulic pressure, like a butterfly flapping its wings.
Fig. 11Baseplate deformation of the 9 time points at 5 Hz (deformation: mm)
a) Time point A, 0.200 s
b) Time point B, 0.225 s
c) Time point C, 0.250 s
d) Time point D, 0.275 s
e) Time point A, 0.300 s
f) Time point F, 0.325 s
g) Time point G, 0.350 s
h) Time point H, 0.375 s
i) Time point I, 0.400 s
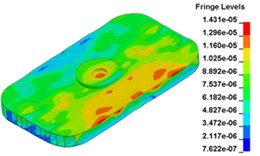
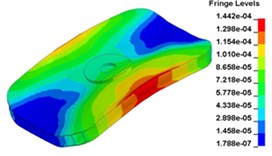
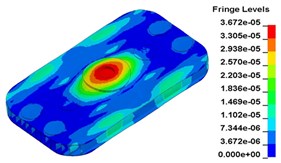
Deformation of 120 Hz is much different from that of 5 Hz. To accurately demonstrate the deformation of 120 Hz, fifteen time points are selected, A (0.00833 s), B (0.00900 s), C (0.009333 s), D (0.009667 s), E (0.010417 s), F (0.010999 s), G (0.011333 s), H (0.011833 s), I (0.012500 s), J (0.013000 s), K (0.0.013833 s), L (0.0.14583s), M (0.015333 s), N (0.015999 s), O (0.016666 s), as shown in Fig. 12.
Fig. 13 illustrates the deformation of the 15 time points in Fig. 12 at 120 Hz, and the deformation is also magnified 1500 times. In the compressing half-cycle (from time point A to time point I), the baseplate exists front-rear warping. The warping gradually moves from the center to the four corners, and disappears until time point I. At time point A, the warping occurs but the hydraulic pressure is zero, which indicates that the warping is from last sweep cycle and would influence the response of next sweep cycle. In the releasing, half-cycle (from time point I to time point O), the deformation gradually goes up from the center to the side, and it declines after time point M. In this process, the baseplate experiences wave shaped deformation from the rear side to the front side. The deformation of time point M is bigger than that of other time points but time point M is not the peak time of the dynamic load, indicating that the baseplate does not respond to the sweep signal immediately. Response delay occurs at high frequencies.
Fig. 12The fifteen time points of 120 Hz
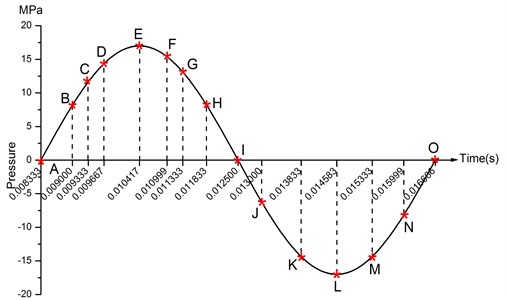
Fig. 13Baseplate deformation of the 15 time points at 120 Hz (deformation: mm)
a) Time point A, 0.00833 s
b) Time point B, 0. 00900 s
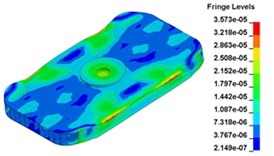
c) Time point C, 0. 009333 s
d) Time point D, 0. 009667 s
e) Time point A, 0. 010417 s
f) Time point F, 0. 010999 s
g) Time point G, 0. 011333 s
h) Time point H, 0. 011833 s
i) Time point I, 0. 012500 s
j) Time point J, 0. 013000 s
k) Time point L, 0. 013833 s
l) Time point L, 0. 14583s s
m) Time point M, 0. 015333 s
n) Time point N, 0.015999 s
o) Time point O, 0. 012500 s
Without the limitation of ground on the baseplate, the deformation of the compressing half-cycle is much larger and more uniform than that of the releasing half-cycle, as shown in Fig. 10 and Fig. 12. At low frequencies, the baseplate deformation is in accord with the hydraulic pressure, which is in favor of exciting high-quality output signal. In contrast, the deformation response at high frequencies shows obvious delay, leading to difficulty in employing feedback of the output signal. In addition, the baseplate suffers warping and wave shaped deformation at high frequencies, generating harmonic and decreasing the signal-noise ratio of the output signal. To improve the quality of output signal, measures like adding hold-down weight on the corners of the baseplate should be taken, which are helpful for reducing or even avoiding the negative deformation.
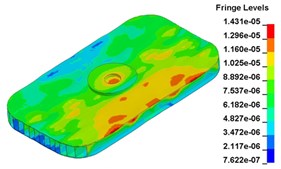
4.3. Decoupling analysis of the vibrator baseplate
One assumption of the weighted sum method is that the baseplate and ground are complete coupled. But during the operating process, coupling and decoupling with different status happen at different frequencies. Fig. 14 shows the displacement time histories plot of the central point on lower surface of the baseplate and its contact point on the top surface of ground at 5 Hz. The displacement of the central point on the baseplate is represented using the black line while the contact point on the top surface of the ground is the red line. Coupling means two curves are coincide with each other and decoupling means two curves are separated, both of which are steady at 5 Hz. Without the limitation of ground, decoupling occurs in the releasing half-cycle with much bigger amplitude than coupling. The maximum of decoupling appears at the time point of the peak of upward hydraulic pressure. Compared to the sweep signal curve, decoupling cure is more incisive, which indicates that decoupling comes and goes more rapidly.
Fig. 14Displacement time history of the central point on the baseplate lower surface and the contact point on top surface of the ground at 5 Hz
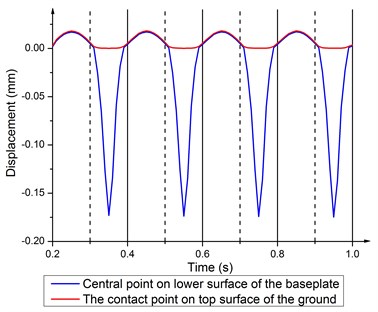
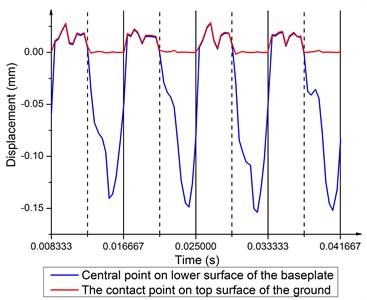
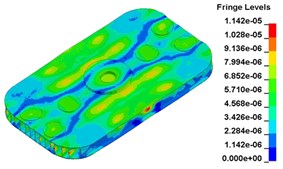
Fig. 15 demonstrates the coupling and decoupling at 120 Hz. In the compressing half-cycle, the center of the baseplate and the center of the ground are fully coupled with two large fluctuations. This may be a result of ups and downs motion of the center of baseplate when the four corners suffer warping. The maximum of decoupling is not at the middle time point of the releasing half-cycle. This is in accordance with the delay of deformation response at 120 Hz. Due to wave shaped deformation, some flexures appear on the displacement curve of the baseplate central point in the releasing half-cycle.
As shown in Fig. 14 and Fig. 15, displacement time history curves of the corresponding points are coincide with each other in the compressing half-cycle, indicating that the center of the baseplate and the center of the ground are fully coupled, and the baseplate transmits force of output signal into the ground. Due to upward hydraulic force, decoupling occurs in the releasing half-cycle, leading to impact an impulse of energy to the earth, which produces distortion and masks desirable reflection data [19]. The number of decoupling at high frequencies is far more than that at low frequencies. As a result, output signal is worse at high frequencies.
Fig. 15Displacement time history of central point on the baseplate lower surface and the contact point on top surface of the ground at 120 Hz
5. Discussion
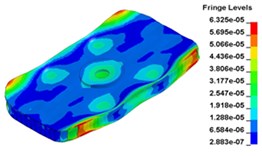
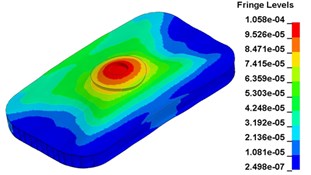
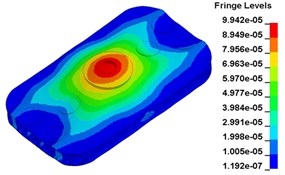
The load applied on the vibrator is symmetric and the baseplate structure is also symmetric, but the baseplate deformation of front-rear direction is not symmetric at 120 Hz. This asymmetric deformation might be due to the asymmetry of the vibrator structure as only one beam used to install some apparatuses is between the two front supporting columns, and there is no beam between the rear supporting columns, as shown in Fig. 16 (a). To verify this inference, the vibrator is modified by adding one identical beam between the rear supporting columns, as shown in Fig. 16(b), and FEA simulation of modified structure was developed in the same process as the original structure simulated.
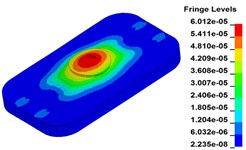
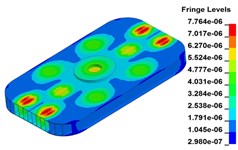
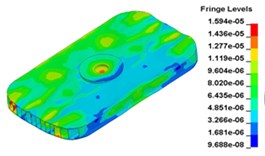
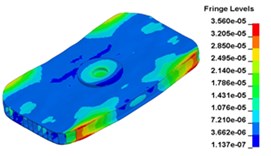
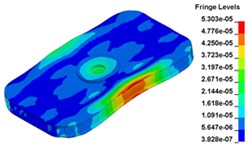
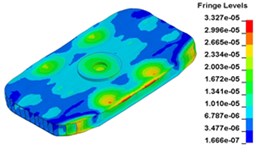
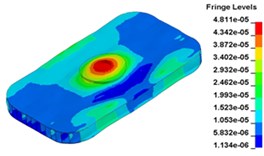
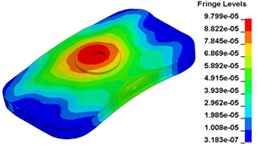
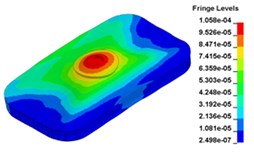
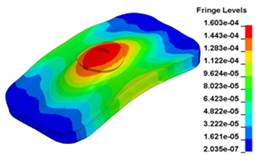
To clearly show the difference between original structure and modified structure, baseplate deformation of three time points I (0.012500 s), J (0.013000 s) and L (0.014583 s) (in Fig. 11) is selected, as shown in Fig. 17. The deformation of modified structure is more uniform than that of the original structure, and the maximum deformation of modified structure is also smaller. Plot (d) and plot (f) demonstrate that the wave shaped deformation disappears after modification, and most of the deformation concentrates on the central part of the baseplate, which is accessible for reducing harmonic caused by irregular deformation.
Fig. 16Structure contrast before and after the modification
a) Original structure
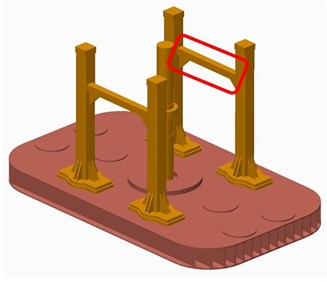
b) Modified structure
Compared to the deformation at 5 Hz, the deformation at 120 Hz is seriously asymmetric, especially in the releasing half-cycle. The baseplate suffers wave shaped deformation, indicating that deformation becomes more sensitive at high frequencies. Even indirect structure could have significant influence on deformation response. The wave shaped deformation is a typical case. As the baseplate is a rectangle and made of I-steel, rigidity in length direction is bigger than that in width direction. Even with symmetric structure and load, the baseplate deformation in left-right direction is still bigger than the deformation in front-rear direction. Therefore, the design of vibrator should follow the principle of symmetry. Both the structure and load should be in symmetry. Moreover, the baseplate should be centrosymmetric structure, like circle. Symmetrical structure and load can effectively reduce uncoordinated deformation, which is advantageous to reduce distortion of output signal and improving the signal-noise ratio at high frequencies.
Fig. 17Baseplate deformation contrast before and after the modification (deformation: mm)
a)0.012500 s, original structure
b)0.012500 s, modified structure
c)0.013000 s, original structure
d)0. 013000 s, modified structure
e)0. 014583 s, original structure
f)0. 014583 s, modified structure
6. Conclusions
1) Acceleration of the baseplate is stable at low frequencies, which is beneficial to feedback control. On the contrary, the acceleration at high frequencies is uncertain, resulting in poor feedback control and hindering high-quality signal output at high frequencies.
2) At low frequencies, the baseplate deformation is in accord with the hydraulic pressure, which is in favor of exciting high-quality output signal. In contrast, the deformation response at high frequencies exists obvious delay, and the baseplate suffers warping and wave shaped deformation, leading to harmonic and lower signal-noise ratio.
3) Decoupling occurs in the releasing half-cycle, causing impacts on the ground and producing distortion of the output signal. The times of decoupling at high frequencies are far more than that at low frequencies. As a result, output signal becomes worse at high frequencies.
4) Compared to low frequencies, deformation is more sensitive at high frequencies. Even indirect structure could have significant influence on it. Both the structure and load should be in symmetry. This is helpful for reducing distortion of output signal and improving the signal-noise ratio at high frequencies.
5) To increase ground force and reduce response delay, anomalous deformation and decoupling, the baseplate should be improved on new material, symmetric structure, hold-down optimization weight and other aspects. With such improvements, the baseplate can perform consistently and transmit high-quality output signal at both low and high frequencies to meet the requirements of high precision exploration.
References
-
Bell D. W. Low seismic frequencies: acquisition and utilization of broad-band signals containing 2-8 Hz reflection energy. SEG Annual Meeting, Society of Exploration Geophysicists, 1986.
-
Maxwell P., Lansley M. What receivers will we use for low frequencies. SEG Annual Meeting, Society of Exploration Geophysicists, 2011.
-
Dean T., Tulett J., Puckett M., Lane D. Timothy Improving land VSP resolution through the use of a broadband vibroseis source. SEG Technical Program Expanded, 2013, p. 5067-5071.
-
Wei Z., Phillips T. F. Break through the limits of vibroseis data quality. Geophysical Prospecting, Vol. 60, Issue 2, 2012, p. 373-393.
-
Baeten G., Egreteau A., Gibson J., Lin, et al. Low-frequency generation using seismic vibrators. 72nd Annual International Conference and Exhibition, EAGE, Vol. 15, 2010.
-
Bagaini C. Low-frequency vibroseis data with maximum displacement sweeps. The Leading Edge, Vol. 27, Issue 5, 2008, p. 582-591.
-
Bagaini C., Dean T., Quigley J., Tite G. A. Systems and Methods for Enhancing Low-Frequency Content in Vibroseis Acquisition. U.S. Patent, 2008.
-
Sallas J. J. How do hydraulic vibrators work? A look inside the black box. Geophysical Prospecting, Vol. 58, Issue 1, 2010, p. 3-18.
-
Margrave G. F., Bertram M. B., Bertram K. L., et al. A low-frequency seismic field experiment. SEG Annual Meeting. Society of Exploration Geophysicists, 2012.
-
Tao Zhi-Fei Effective tools for oil and gas exploration: technology for high precision vibroseis. Technology, Engineering, and Science News, Vol. 3, Issue 5, 2015, p. 76-78.
-
Sallas J. J. Seismic vibrator control and the downgoing P-wave. Geophysics, Vol. 49, Issue 6, 1984, p. 732-740.
-
Brook R. A., Crew G. A. Experimental analysis of vibrator baseplate dynamics. SEG Annual Meeting, Society of Exploration Geophysicists, 1991.
-
Baeten G., Strijbos F. Wave field of a vibrator on a layered half-space: theory and practice. SEG Annual Meeting, Society of Exploration Geophysicists, 1988.
-
Liu Bin, Zhang Zhi-lin, Zhao Guo-yong, He Jing-guo Harmonics and its attenuation on vibroseis data. Oil Geophysical Prospecting, Vol. 49, Issue 6, 2014, p. 1053-1060.
-
Lebedev A. V., Beresnev I. A. Radiation from flexural vibrations of the baseplate and their effect on the accuracy of traveltime measurements. Geophysical Prospecting, Vol. 53, Issue 4, 2005, p. 543-555.
-
Lebedev A. V., Beresnev I. A. Nonlinear distortion of signals radiated by vibroseis sources. Geophysics, Vol. 69, Issue 4, 2004, p. 968-977.
-
Rademacker T., Miller R., Xia J., Black R., Tsoflias G. Enhancing the vibroseis technique through equipment noise reduction and optimizing the weighted sum signal. SEG Annual Meeting, Society of Exploration Geophysicists, 2005.
-
Hendrix C. M. Evaluation of High Frequency Vibrator Response. Ph.D. Thesis, University of Kansas, Lawrence, Kansas, USA, 2012.
-
Wei Z., Phillips T. F. Integrated analysis of the vibrator-ground system at high frequencies. First Break, Vol. 31, Issue 1, 2013, p. 89-96.
-
Dean T., Vermeer P. L., Laycock M., et al. The complexity of vibrator baseplate-ground interaction measured with a thin-film pressure pad and a down hole tool. 77th EAGE Conference and Exhibition, 2015.
-
Wei Z., Phillips T. F. Characterizing the vibrator captured ground mass system using finite element analyses. SEG Annual Meeting, Society of Exploration Geophysicists, 2013.
-
Han W. G., Qu Y. M., et al. Method of suppressing harmonic noise based on refection coefficient and ground force signal. Progress in Geophysics, Vol. 30, Issue 6, 2015, p. 2647-2659.
-
Mitchell K. L. Force control of servo hydraulic vibrators. SEG Annual Meeting, Society of Exploration Geophysicists, 1984.
-
Cao Wu-xiang, Yan Zhi-hui, et al. Harmonic interference suppressing by force signal of vibroseis. Geophysical Prospecting for Petroleum, Vol. 50, Issue 1, 2011, p. 89-92.
Cited by
About this article

This work was financially supported by the National High Technology Research and Development Program of China (863 Program) through the project of Development of the High Precision Vibroseis (Grant No. 2012AA061201).
