Abstract
The subject matter of the paper is an analysis of chosen results of acceleration signals measurements obtained from the prototype of the Rail Vehicle and Rail Track Monitoring System. This prototype of the monitoring system measures acceleration signals on designated elements of the electric multiple unit (EMU). These elements comprise components such as: bogie frames, wheels and bodies of railway vehicles. The analysis was prepared on the basis of rail vehicle journeys on sample sections of the Polish National Railways (PKP Polskie Linie Kolejowe S.A.) network. The products of measurements were converted to values of specific diagnostic parameters (statistical parameters), e.g. an amplitude (zero-peak), a root mean square, a kurtosis coefficient, an interquartile range. Comparing the values of diagnostic parameters with their permissible values allows the monitoring of distinctive dynamic behaviors of rail vehicles and track condition, as well as the temperature of the bearings of rail vehicle wheelsets. It also allows the determining of the condition of rail vehicle structure. The permissible values of certain diagnostics parameters could not be obtained from the literature. Therefore, this paper in part presents a way of obtaining these permissible values. The main intention of the analysis described here is to determine the usability of various diagnostic parameters and to identify the course of further research related to condition monitoring and diagnostics of rail vehicles and tracks.
1. Introduction
Rail transport, as one of the main branches of transportation, has recently been dynamically developed in European countries. There are several reasons for this and the most important of them are following. Excessive development of road transport and related problems (such as: congestion, environmental pollution, increasing number of road accidents and incurred social costs) caused the necessity to use other transport media. Other reason is the need to ensure sustainable development of regions and urban agglomerations, and thus smooth and safe transportation of people and freight (cargo). In the case of rail transport, travel time of such is comparable to air transport over distances of 200-1000 km (taking into account travel time to an airport and check-in time [1, 2]). What is more, it is a key technology for greener transportation and it should be also mentioned that railway stations are usually built closer to city centers than airports. One more reason is that the possibility of combining cargo transport with various means of transport make it possible to organize combined, multimodal or intermodal transport.
The basic attributes of this development are increasing speed and travel comfort. However, as the events of the last few decades showed, the price for aspiration connected to these features of development is increasing. Many of the worst railway vehicles accidents in history occurred in the early 20th and 21st centuries. The causes behind most of these disasters could be gathered around brake failures, derailments or accidental fires [3]. The importance of railway safety increased then. Railway disasters in recent years (where mechanical damages were the cause of accidents) showed that considerations on safety issues in rail transport must be continued.
It should be noted that the mechanical reasons for lowering the level of rail transport safety can be divided into two groups. The first group includes damages related to the vehicles (locomotives, wagons, electric multiple units etc.), the second group includes damages related to the track. In fact, the technical condition of these facilities should be monitored and diagnosed continuously.
The problem of monitoring and diagnosing the technical condition of rail vehicles and track in on-line mode (in real time) is a complex research task. The rail vehicle – track system is a complex mechanical system with a nonlinear structure, which is superimposed by variable operating conditions [4, 5]. The structure of the vehicle as a mechanical system is characterized by a significant number of elastic elements (springs) and damping elements (dampers) connected to each other in various configurations. These configurations form primary and secondary suspensions. Moreover, in this system there is a strong coupling between a vehicle and track through contact zone between a wheel and a rail [6]. That is why the technical condition of vehicle and track should be monitored and diagnosed continuously.
The aspirations of constructors of vehicles and railway carriers to increase the operating speed of vehicles, and at the same time bearing in mind necessity of high comfort level and high level of passengers (or freight) safety, caused that monitoring of technical condition of vehicles and tracks became very important (especially, condition of the primary and secondary suspensions). Along with the production of high-speed trains, elaboration of monitoring methods and systems began to be carried out, by various research teams. Their aims are connected to development of methods for assessment condition of vulnerable systems with a view to identify damage of springs and damping elements before any accident occurs [7, 8]. The next stage of research activities should include undertaking activities aimed in development and implementation of operational monitoring systems for rail vehicles and tracks. It is likely that manufacturers of high-speed rail vehicles are working on such solutions, but as of today, there is no information on specific real-life solutions available in the scientific literature. One can find in the literature studies attempts to solve this problem [9, 10] with use of methods developed for other mechanical systems. However, these are solutions that have not been implemented under operating conditions.
When starting recognition of a rail vehicle as a diagnostic and monitoring object, it should always be borne in mind that a rail vehicle itself is part of particular mechanical system [4, 6]. It consists of following elements: rail vehicle, track and contact zone between vehicle’s wheel and a rail. Interactions characterized by following signals occur between these three elements: forces, accelerations, velocities and displacements during operations. Consideration of a vehicle itself, without taking into account connections with the other two elements of this mechanical system is correct only in some cases (mostly, quasi-static analyses) and generally should not proceed in the case of dynamic analyses. Hence, the idea of monitoring the whole mechanical system with use of a single monitoring system was taken into consideration. As it can be seen, the rail vehicle is a system that consists of a large number of elastic and damping elements. A simple solution due to monitor primary and secondary suspension levels would be to mount strain gauges on each of suspensions elements. This is unacceptable because of economic reasons. Moreover, passenger carriages and modern traction units are often equipped with pneumatic springs on the second level of suspension. In this case, the strain gauges could not be used. In addition to elastic elements (springs) in the suspension of vehicles, also dampers undergo wear and damage. The state of them, without disassembly from a vehicle or any other interference, cannot be directly examined. It is possible to be evaluated on the basis of indirect measures obtained from analysis of vibrational signals recorded in selected spots on a rail vehicle. The diagnostic difficulties, mentioned above, make the issue of monitoring of the technical condition of rail vehicle and track with use of signals registered on a vehicle a complex problem.
The current state of rail vehicle monitoring methods represents methods and systems that supervise the operation of systems directly related to vehicle control, e.g. power, drive and braking systems (and in the case of high-speed rail vehicles, it is obligatory to monitor the temperature of bearings). It is expected that in the near future the requirements for monitoring of rail vehicle systems will increase [11]. Monitoring is one of the methods of diagnosis that means regular qualitative and quantitative measurements, or observations of studied phenomenon, executed in accordance with a developed procedure [12]. Methods connected to detection of rail vehicle suspension damage can be classified as condition monitoring (part of structural health monitoring). Publications that regard monitoring of rail vehicle suspension belong to increasing but still a small group. A common feature of these methods is the use of acceleration signals recorded on the vehicle.
Condition monitoring of railway tracks and vehicles is essential for ensuring the safety of railways in general, [7, 13]. The Rail Vehicle and Rail Track Monitoring System is one of the developed solutions serve this purpose. The monitoring of the dynamic behavior of rail vehicles including the problem of rail vehicle suspension fault detection, as well as the state of tracks and their diagnostics are among the main functions and aims of the above system. Condition monitoring and diagnostics are based on the measurement of vibroacoustic signals (values of momentary acceleration signals) on specified spots on a vehicle (such as: railway car, segments of electric multiple unit and other kinds of rail vehicles), which are explicitly indicated in the patent obtained by the design-research team, [14, 15]. The system also monitors the temperature of axel boxes, however this is not subject of discussion in this paper. As part of the MONIT project (see: Acknowledgement), a system for monitoring the technical condition of the rail vehicle suspension and rail track was developed. When developing the system, it was assumed that it must be characterized by: an uncomplicated architecture, a measurement procedure similar to the standard ones used in the case of approval tests and a small cost of measuring equipment.
The analysis described in this paper is of data obtained from a supervised journeys under normal service conditions, during which the prototype system was installed on the rail vehicle. Before the supervised journeys, the monitoring system was examined on the test track in Żmigród (Lower Silesian voivodeship, Poland), [16].
One of the basic sources of information for the diagnostics of rail vehicles mechanical systems are vibroacoustic signals, mainly of velocity or acceleration. The subject of this paper is an analysis of selected results of acceleration measurement in axle boxes, wheel-set frames and bodies of rail vehicle: electric multiple unit (EMU) ED-740001 produced by PESA Bydgoszcz S. A. The prototype of the above system was installed on this type of vehicle. Analyses were made on sections of selected routes of the Polish railway network. Analyses of signals recorded by the system, on selected routes and under supervised operation conditions, concerned diagnostic indicators such as: amplitude, root mean square, kurtosis coefficient and interquartile range.
A variety of experimental studies that use methods of vibroacoustic signals analyzing for railway diagnostics can be found in the literature. Authors of [17] discussed the system for detecting wheel-flats on a wagon wheel through accelerations sensors located on rails. Wheel-rail impact caused by the wheel-flats was also discussed in [18]. Authors consider the problem of damaged wheels origin and its consequence during runs of rail vehicle on tracks through the assessment of selected measured parameters of a rail vehicle with wheel-flat (obtained from computer simulations).
Authors of [19] suggested using the symptom method for on-line monitoring system. In a typical four-axle passenger rail car used by the Greek Railways they considered following damages: loss of damper in the primary suspension (F1), loss of damper in the secondary suspension (F2) as well as loss of the pneumatic spring (F3). Faults F1 and F2 had less influence on the measurement results (thus these were more difficult to detect) than F3 damage. During the tests, signals from four accelerometers mounted on a bogie and a car body were collected. Two types of tests were carried out: the first with a car with efficient suspension running with velocity of 60 and 90 km/h, and the second with a car with damaged suspension elements F1 ( 90 km/h), F2 ( 90 km/h) and F3 with velocity 60 km/h (lower value of velocity due to the weight of damage that could cause a disaster). The analysis of each of acceleration signals in the current technical condition (which is assumed to be unknown) consisted of comparing its variance or the spectrum of the samples with the appropriate runs for a car without any damage. A signal analysis tool was used for fault detection, which evaluated the difference between the reference waveform and the waveform hail from disturbed state system. As a result of the research, it turned out that variance of a signal carried information about a fault, but not in all the measurement spots.
Another solution was presented by authors of [20], which is based on a new class of hypothetical mathematical description of fault mode obtained in the form of a stochastic FARX functional model, given in [21].
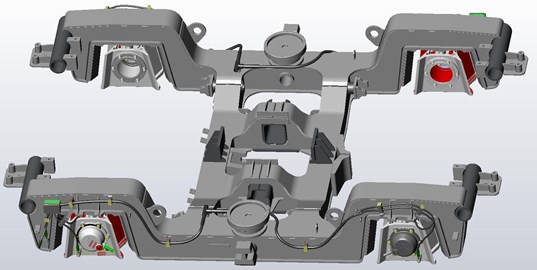
Authors of [22] presented a similar system, to the one described in this paper, designed for the safe operation of high-speed electric trains. They proposed following locations for 44 sensors in total: 5 measuring points on the current collecting device in two positions which correspond to extreme heights of the catenary, 12 measuring points on vehicle body, 5 measuring points on each bogie frame and 3 measuring points on each wheel set. Author of [23] presented a system consisting of 4 accelerometers. However, in the system described hereby, sensors are mounted on the vehicle body, one sensor above each bogie (it is located on the body at floor height, above the center of a bogie frame; 9 – transverse direction of sensor measurement, 10 – vertical direction of sensor measurement, in Fig. 1), and 2 sensors are mounted on each bogie frame (these are two measuring spots placed diagonally above the wheel set; 5 and 7 – transverse direction, 6 and 8 – vertical direction, in Fig. 1) and deployed in order to monitor secondary suspension condition. As far as the track condition is concerned, acceleration signals are registered by accelerometers located on wheel-set bearings – 4 per each bogie (1, 2, 3, 4 – transverse direction, 11, 12, 13, 14 – vertical direction, in Fig. 1). At each measuring spots, acceleration signals are recorded in the vertical and transverse directions (as it was hinted in previous brackets). Vertical and transverse accelerations measured on a bogie allow to evaluate the running safety in a simplified way. In addition, they also allow to monitor the behavior of a vehicle while it runs. While vertical and transverse accelerations recorded on a vehicle body are used to assess of vehicle running calmness. The monitoring of axle bearings temperature is based on signals recorded by temperature sensors located on wheelset bearings – 4 per each bogie. As the EMU consists of two rolling bogies (located under the three car bodies in the middle of EMU) and three driving bogies (located under peripheral car bodies) – sensors locations are given in separately Figs. 2-3.
Fig. 1Sensors spots in the monitoring system source: figure is compatible to the one given in [14]
![Sensors spots in the monitoring system source: figure is compatible to the one given in [14]](https://static-01.extrica.com/articles/19367/19367-img1.jpg)
As another example of condition monitoring in literature, metro vehicles in Prague and in Beijing were tested. In Prague, authors of [24] dealt with the issue of diagnostics of railway vehicle in operation. Authors analyzed vibration of the rails and noise emission in the time and frequency domain. In Beijing, authors of [25] studied the effects of rail roughness on the wheel-rail vibration load. The wheel-rail interaction model was established based on excitation of rail surface roughness in the research and all computing was based on the numerical model.
As a part of research addressing the problem of fault detection in rail vehicle suspension, a few more systems and methods are mentioned in the literature presented over the last twenty years. First of all, some methods based on the Kalman filter were described, as in [26-28]. Authors of [28] developed suspension diagnostics based on the vehicle half-car model. These methods were based on the extended filtration of signals with use of EKF filter (Extended Kalman Filter) and RBPF (Rao-Blackwellised Particle Filter), [10, 29, 30]. Finally, the method based on the EKF did not bring beneficial results, while the method based on RBPF filtration required high computing power (it is disadvantage of the method, as it involves a high cost of the measuring equipment). In addition, RBPF filtration can only be used in systems in case of which a fast failure detection is not required.
Authors of [31, 32] used an extended Kalman filter to diagnose the components of a bogie. For research purposes, a simplified vehicle model was used, identical to those used by authors of [26-28].
A specific multimodel approach to the problem is presented in [33-37] and methods utilizing dynamical interactions between bogie movements are given in papers [8, 9, 34].
The method proposed in papers [33, 35, 39] is characterized by a multimodal approach. This method assumed that the system is represented by one model belonging to a finite set of models that reflect the state of the system. The used simulation algorithms was the Interacting Multiple-Model (IMM) algorithm. Parameter estimation was performed with use of the Kalman filter.
The method proposed in [8, 9, 34] consisted of dynamical behavior comparison between two suspension systems (in case of front and back bogies), where elements with the same parameters were usually used. Authors assumed that if the system was functional, the vertical displacement and tilting of the bogie were independent of each other. In real conditions, there is little reciprocal coupling between these displacements. In case of faults occurring of suspension components, dynamic couplings occurred between vertical movements and inclination. The proposed method was based on the assessment of additional dynamic interactions that occur as a result of changes in the parameters of suspension elements. Faults detection in the above assumptions can be done by computing of relative correlation or relative variance. According to the authors, the use of variance to assess the suspension is effective, because this measure is largely insensitive to operating conditions.
In [40], authors presented a method for the diagnostics of rail vehicle suspension, in which the generalized Kalman-Yakubovitch-Popov lemma was used as observer of a rail vehicle state. Two types of damage were considered in simulation tests: reduction of damping coefficient of a damper in secondary suspension and damage of an accelerometer in transverse direction. In the analyzes, the half-vehicle model was used due to derive equations of dynamic state system.
It is known that the suspension system plays a crucial role in rail vehicles. The fault detection of suspension system is an effective way to ensure the security and stable operation (service) of rail vehicles. The paper [41] concerns the fault detection issue of rail vehicle suspension systems with the extended form of Partial Least Squares (PLS), which is Multi-block Partial Least Squares (MBPLS). The signal information used in the fault detection is obtained from the SimPack and Matlab co-simulation environment. In this paper, the typical spring and damper faults in primary and secondary suspension are detected successfully using MBPLS. MBPLS was applied to block data, and the statistical post-editing were used to monitor the performance of the suspension system. The proposed approach was demonstrated by the simulation results for several fault scenarios of primary and secondary suspensions.
The method using a measurement equipment, i.e. not dedicated to on-line monitoring systems, described in [42], needs to be discussed separately. In the conducted simulation tests, the diagnostic equipment consisted of inductors attached to wheelsets, which introduce the passenger car model into vibrations of a given amplitude and frequency. During the simulation, accelerations, velocities and displacements of selected spots located on wheelsets, bogies and car bodies were recorded. The recorded quantities served as input data for the Fahlman neural network teaching, which was used for simulation detection of dampers and springs of primary and secondary suspension.
Nevertheless, no information about implementation of mentioned methods in the actual monitoring systems could be found. Contrary, the monitoring system described in this paper can be experienced in numerous papers mentioned in the next section.
Fig. 2Accelerometers location on driving bogie. Source: monitoring of technical state of construction and evaluation of its lifespan – MONIT project archives
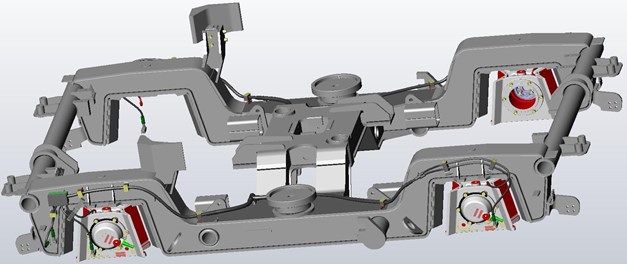
Fig. 3Accelerometers location on rolling bogie. Source: monitoring of technical state of construction and evaluation of its lifespan – MONIT project archives
It should be emphasized, that in practice most of measurement studies are realized separately for the railway vehicles and for the tracks. There are designated railway vehicle cars or whole trains specialized for taking measurements and equipment to gain measurement results. For example, inspection of tracks focuses on a track safety ensured by the use of a track recording vehicle (TRV) or hauled track recording coach (TRC) running on the rail network and gathering track geometry data. In the case of the research given in this paper measurements were made on a railway vehicle that is in a regular use (in this case EMU; the system also applies to freight wagons, metro vehicles, street-cars etc.) and both signals on the vehicle and the track were analyzed during vehicle runs.
The literature review showed that the problem of suspension fault detection in railway means of transport began to be analyzed relatively recently. In publications released in international journals in last 15 years, a certain number of methods was presented. However, there are no information about full-scale use of these methods in systems installed on real vehicles, which leads to the conclusion that these methods were not implemented in real conditions in the form of a ready-to-made system, and are only in the stage of simulation applications. The disadvantage of the proposed methods is the necessity of very precise modeling of the vehicle, taking into account damping, stiffness and inertia parameters. Already at modeling construction stage, simplifications are introduced that may limit the efficacy of these methods. In addition, access to the required parameters may be difficult, as the vehicle manufacturer does not provide such detailed information about the parameters due to patent protection or non-disclosure of technologies (disclosure could bring losses to patent owners). The current state of computational techniques and the ability to collect a significant amount of data on the monitoring system server in a short time also should be taken into account. The method for the proposed monitoring system must be adapted to the computing power of industrial computers that meet the railway milieu requirements.
Detection of faults to suspension components belongs to the most complex processes of diagnosing the technical condition of rail vehicles and track. According to the current state of knowledge, there is no commercial system that would allow monitoring the suspension status of primary and secondary suspension in rail vehicles. From the point of view of active safety, maintaining the correct state of spring and damping elements of the suspension is an extremely important issue. Condition of these elements determines dynamic behavior of a vehicle, which directly is translated into occurrence of dangerous derailment [12]. An important difficulty in developing of such a system is the lack of effective method allowing to distinguish the state of efficient and inefficient suspension. In the considered mechanical rail vehicle – track system, an important source of vehicle vibrations are geometric inequalities of the track. The dynamic response of a vehicle depends on amplitude of these irregularities, its wavelengths and driving speed. The exact parameters of track unevenness – extortion are not known. In many cases, a situation may arise where extortion is so significant that it can be misinterpreted as a suspension failure. This fact makes it very difficult to develop a method that would be insensitive to the form of this extortion. Therefore, it is needed to analyze several diagnostic measures at the same time.
Section 1 of the paper consists of introduction and literature review which aim is to prove the necessity of monitoring system elaboration that would monitor both a rail vehicle and rail track in the same time without separately equipment. In Section 2, the conditions and the research process were defined. In Section 3 and 4 analyses of chosen signals recorded by the monitoring system installed as the prototype on electric multiple unit were described. These signals were gathered on selected routes under supervised operating conditions of the monitoring system. Last section consists of summary of the research and plans announced for the future research.
2. Electric multiple unit condition monitoring under supervised operation
The vehicle and track monitoring and diagnosing system enables monitoring of the vehicle state through acquisition and data pre-analysis (understood here as processed vibroacoustic signals). Measured data are subjected to digital processing and validation. If an error is detected, the information is sent, via a GSM modem, to an external server, in the form of a control packet. Measured data are also sent to a server as data packets. Monitoring of the state of rail vehicles is carried out on-line and signals collected by sensors are continuously processed, analyzed and stored in the system server databases. The system and its other particular analyses of signals are presented in a more detailed way in papers [16, 43-55].
As it was mentioned, the data were gathered during supervised journeys of a railway vehicle in its regular operation. The study of the supervised run was conducted in accordance with the following stages:
– stage I: choosing and adjusting EMU ED74 vehicle to operate under supervision of researched system prototype (the system was installed on July 2011),
– stage II: tests of the system prototype in conditions of regular exploitation to determine the necessary of introducing corrections (October 2011-January 2012),
– stage III: supervised operation of EMU ED74 (February 2012-September 2012).
Activity of the system was dependent on the frequency of the vehicle journeys. As a result, 55 GB of data concerning vibroacoustic signals and temperature measurements were collected, requiring precise analysis.
Assumptions for the monitoring system, developed as part of the MONIT project, and monitoring methods have their origin in vehicle dynamics studies during their approval tests. The UIC 518 card [56] and the PN-EN 14363 standard [57] contain the requirements that rolling systems of railway vehicles must fulfill in order to be allowed to exploitation.
The concept of the rail vehicle state monitoring system assumes the use of acceleration signals recorded at selected spots on the vehicles. Acceleration signals measured on bogies and bodies of vehicles were used to evaluate their efficiency. Two of the tested basic parameters characterizing the acceleration signals used in this evaluation were root mean square value and acceleration maximum value likewise known as amplitude (according to the suggestions in [56], the maximum value of the signal is determined through its 99.85 % percentile). The permissible values for this kind of parameters are specified in the documents for the approval tests of rail vehicles in terms of the dynamics of the gear system such as described in [56, 57]. The permissible amplitude and root mean square values are the same for driving bogies and rolling bogies.
As a part of the supervised operation, the electric multiple unit ran on particular routes (in some cases the chosen routes between the following marginal points covered different mileage due to the specifics of Polish railway system): Warsaw-Poznań, Warsaw-Terespol, Warsaw-Kraków (via Łódź, Radom or Kielce), Kraków-Wrocław, Warsaw-Łódź.
3. Analysis of signals recorded by the system on selected routes under supervised operating conditions - analysis of individual diagnostic indicators
Identification of the technical condition of the suspension requires proper selection of parameters (diagnostic indicators). For a complex suspension system, the decision to use a specific parameter must be preceded by simulation analyzes and then by tests on a real existing object. The parameters used to assess the condition should meet two following basic conditions [58]:
– unequivocalness (only one determined value corresponds to each values of the structure parameter),
– sufficient range of value changes (large relative change of certain diagnostic indicator values for a given change in a parameter characterizing the tested object).
Based on the documents [56, 57], a decision was made to use a root mean square and an amplitude of measured signals in the monitoring system. However, other groups of statistic indicators were also considered: positional measure (mean value), dispersive measures (root mean square, signal energy, interquartile range, standard deviation, variance, coefficient of variation), measures with maximum value (other than amplitude: peak-to-peak, crest factor, clearance factor), shape measurement (kurtosis coefficient).
The interquartile range informs about the variability of the 50 % feature of the middle values in the series (distribution, sample) – therefore, it does not take into account 50 % of extreme values in the sample (often atypical). A value of the interquartile range is not affected by lower values than values in the first quartile and larger than the one in the third quartile.
It should be noted that the average value of the vibration signal recorded on a vehicle over a finite interval time is close to zero. Therefore, the mean value and coefficient of variation, within which mean value occurs as a denominator, cannot be diagnostic indicators, because they do not allow to distinguish whether a signal registered on a railway vehicle is connected to efficient or inefficient state of railway vehicles elements.
It is worth noting that a variance value is approximately equal to the root mean square value, therefore the standard deviation also was not included in parameters analysis.
The sensitivity of individual statistical parameters to a type of fault in suspension can be different. This can create a problem of matching the parameter to a given type of fault. In case of usage of more parameters, the analysis of each of them is bothersome and time-consuming. It is possible, for the defined parameters, to develop a method for diagnosing the suspension condition using a „combined approach”, that is under studies.
The obtained results of simulation tests (presented in [58]) confirm the complex influence of faults of the suspension elements on registered acceleration signals. While considering various simulation scenarios in [58], it was noted that researched parameters values for efficient vehicle may be smaller for certain speed of vehicle and higher for others than in the case of an inefficient vehicle (with damage). Changing conditions – e.g. deterioration of a track condition and/or vehicle runs on a curve additionally affect the differences between the parameter values for efficient and damaged vehicle. This fact makes it impossible to set one limit value for a selected parameter, both for vertical and lateral direction (the result is the content of standards [56, 57] and estimates of the limit values given in Table 3).
Parameters from a specified group (such as: positional measures, measures of dispersion, measures containing amplitude, shape measures) characterize acceleration signals in a similar way. This is clearly visible in the case of dispersion measures. In addition, the values of dispersion measures generally increase while speed of vehicle increases. This relationship cannot be determined in the case of crest factor, clearance factor and kurtosis coefficient. An additional difficulty in interpretation of the values of these three parameters is high variability of values obtained from tests of a damaged vehicle and a nominal vehicle, i.e. for a specified failure, parameter values are getting higher or lower with change of speed than in the case of vehicle without any failure. Based on these observations, it can be concluded that crest factor, clearance factor and kurtosis coefficient are not useful in diagnosing of suspension status of a rail vehicle.
The generalized influence of suspension faults on values of statistical parameters of measurement signals is presented in Table 1. The letter D indicates a decrease (D – down) and the letter U indicates an increase (U – up) of particular parameter value for inefficient suspension in relation to the value for efficient/nominal vehicle. The U/D symbol means that the values for an inefficient vehicle were in some cases both larger and lower than for an efficient/nominal vehicle. The letter U or D does not mean that the values were always larger or always lower, while for most observations it was possible to determine the trend.
Table 1Generalized impact of chosen suspension faults on parameter values
Diagnostic indicator | Spring reduction in primary suspension | Damping reduction in secondary suspension |
Root mean square | D | U |
Energy signal | D | U |
Interquartile rage | D | U |
Variance | D | U |
Amplitude | D | U |
Peak-to-peak | D | U |
Crest factor | D | U/D |
Clearance factor | U/D | U/D |
Kurtosis coefficient | U/D | U/D |
The analysis given in [58] shows that the statistical measures of certain registered accelerations sustaining significant fault information are the following parameters: concordance correlation coefficient, peak-to-peak value, standard deviation, kurtosis coefficient. The choice of other parameters, based on preliminary analyzes, was presented in [47, 60].
The easiest way to determine the relationship between the analyzed parameters is to calculate the Pearson's linear correlation coefficient. The results of the author's and co-authors' research in previous works, indicated earlier, are presented below in certain paragraphs.
The correlation coefficient can take values from the range [–1, 1], where the value 1 means exact linear relationship between two parameter values, 0 means no linear dependence. In the case when –1, it means exact negative linear correlation between parameters values, i.e. if the value of increases, the value of decreases and vice versa. Therefore, the computed correlation coefficient does not prove the usefulness of diagnostic indicators (statistic parameters), but it can indicate which statistic parameters can be treated as additional or excessive [61].
In the case of the primary suspension, the values of the correlation coefficient for dispersion measures are close to one. Strong correlation also occurs between dispersion measures and amplitude as well as peak-to-peak. The crest factor for signals recorded in the transverse direction is strongly positively correlated with the above measures. In the case of vertical direction, it is negatively correlated.
The values of the correlation of clearance factor and kurtosis coefficient with the dispersion measures are low and in the case of the vertical direction they are negative. Kurtosis coefficient with a crest factor is strongly correlated.
Values of correlation coefficient of parameters used in the process of diagnosis of the secondary suspension do not differ significantly from the values obtained for the case of reduction of stiffness of the primary suspension. Dispersive measures were strongly correlated with each other and positive. The same type of correlation also occurred between the amplitude and peak-to-peak parameters and the dispersion measures. The crest factor in the case of undergoing consideration was always negatively correlated with dispersion measures, independently to signal recording direction.
Kurtosis coefficient and clearance factor were strongly correlated each other. In addition, there was also a strong positive correlation between these parameters and crest factor.
Based on the analysis of correlation coefficients, it can be stated:
– due to the strong positive correlation between the dispersion measures, it is sufficient to use one parameter from this group for diagnostic purposes,
– amplitude and peak-to-peak parameters are strongly positively correlated – they can be used interchangeably,
– clearance factor, kurtosis coefficient and crest factor are strongly positively correlated each other in the case of damping reduction in secondary suspension,
– weak correlation between the dispersion measures and kurtosis coefficient occurred.
Finally, four diagnostic indicators were selected for the further study. The analysis of signals recorded by the monitoring system on selected routes, under supervised operating conditions, referred to four diagnostic indicators: an amplitude, a root mean square, a kurtosis coefficient and an interquartile range. Parameters of amplitude and root mean square were discussed in greater details in [62]. It was proven, that amplitude indicator, due to strong predisposition to changes in the rail-track vehicle set, was not an effective determinant to monitor and diagnose the state of the vehicle [62].
According to [56, 57] permissible value of the root mean square in case of acceleration signals is 0.5 [m/s2]. Due to the lower number of exceedances of the permissible value, in comparison to amplitude indicator [62], the root mean square could be subjected to and quoted in more meticulous analysis.
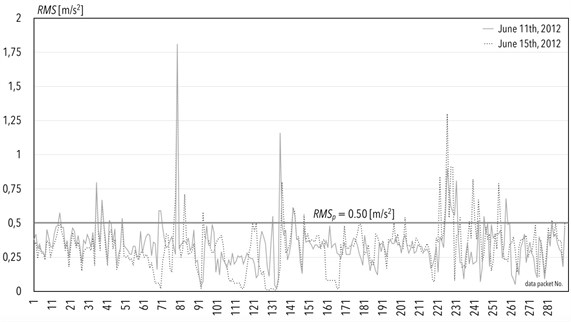
In Fig. 4, a graph of acceleration in transverse direction in A-body of vehicle (first segment of the electric multiple unit during journey on the route) is given. It is featured in the form of a root mean square value on two days: June 11th, 2012 and June 15th, 2012. The sample routes to express the perspectives of system analysis and the mileage of route was as follows:
– Kraków-Lewin Brzeski near Opole (for data packages number 1-99),
– Wrocław-Kraków (for data packages number 100-290).
Locations where cases of exceeding the permissible value of the diagnostic indicator of 0.5 [m/s2] occurred are specified below. The following data are given in Fig. 4: longitude, latitude, cause of exceedance or description of the environment in the location of exceeding occurrence as well as the number of the data packet that complies to exceedance location. The exceedances of permissible values on route of Kraków-Lewin Brzeski near Opole are given in rows 1-10 in Table 2. The exceeds of permissible values on route of Wrocław-Kraków are given in rows 11-24 in Table 2.
Based on the similarities of the routes that the rail vehicle was running on, the author decided to select the runs on June 11th and 15th, 2012 to be investigated in the analyses. For this reason, exceeded values of root mean square parameter on these routes were compared. In case of the pair of measurements, Pearson correlation coefficient was equal to 0.51. The way and the results of computing the track quality indicator, given in [63], confirmed that the state of the track on the route between Opole and Kraków as not of the best quality. This was the reason for numerous exceedances of , as shown in Fig. 4.
When considering a kurtosis coefficient, normal distribution was treated as a reference distribution. For this distribution, the value of a kurtosis coefficient was 3. When population scattering (in the analysis: data collected within a single packet) was greater than in the normal distribution i.e. when kurtosis coefficient was 3, a histogram for this population was higher and more extensive, [64]. It is then customary to say that analyzed data were platykurtic. Otherwise, it can be said that analyzed data were leptokurtic or mesokurtic. It is assumed, that for a kurtosis coefficient in a range between 0 and 6, there was a concentration of data around mean value of a population.
Table 2The exceeds of permissible values on route of Kraków-Lewin Brzeski near Opole (ordinals: 1-10) and route of Wrocław-Kraków (ordinals: 11-24)
Ordinal | Longitude | Latitude | Cause of exceedance or description of the environment in location of exceeding occurrence | No. of data packet |
1 | 19.3869576996725 | 50.1774003234426 | Crossroad near Luszowice | 15 |
2 | 18.9529876708984 | 50.2747611999512 | Chorzow Batory rail station | 35 |
3 | 18.8755569458008 | 50.3050804138184 | Ruda Chebzie rail station | 38 |
4 | 18.8602561950684 | 50.3138046264648 | Straight track | 42 |
5 | 18.2454395294189 | 50.3386764526367 | Straight track | 43 |
6 | 18.1916160583496 | 50.3579597473145 | Track transition curve | 49 |
7 | 18.1532364124945 | 50.3956697415463 | Straight track | 69 |
8 | 18.1455296209356 | 50.4032018665093 | Straight track | 70 |
9 | 18.0411911010742 | 50.4767837524414 | Straight track | 79 |
10 | 18.0216407775879 | 50.4899101257324 | Crossroad | 80 |
11 | 17.9709012763041 | 50.6186804220981 | Opole Grotowice rail station | 131 |
12 | 17.9756642450698 | 50.6102106300908 | Opole Grotowice rail station | 135 |
13 | 17.9823379516602 | 50.5983085632324 | Straight track | 142 |
14 | 17.9867135684125 | 50.5897669542468 | Straight track | 143 |
15 | 18.0290374755859 | 50.4824333190918 | Gogolin rail station | 225 |
16 | 18.0630391500341 | 50.4681466319255 | Crossroad | 226 |
17 | 18.6189651489258 | 50.3423614501953 | Gliwice Łabędy rail station | 228 |
18 | 18.6794948577881 | 50.299991607666 | Gliwice rail station | 230 |
19 | 18.7206287384033 | 50.2957077026367 | Crossroad | 231 |
20 | 18.7476228475731 | 50.3001846438351 | Track transition curve | 243 |
21 | 18.8607762083037 | 50.3135289036201 | Ruda Śląska rail station | 246 |
22 | 18.9167518615723 | 50.2895851135254 | Katowice rail station | 258 |
23 | 19.4350490570068 | 50.1601829528809 | Cross-road, Brzezinki | 260 |
24 | 19.9408836364746 | 50.0777931213379 | Track transition curve | 283 |
Fig. 4Comparison of acceleration in transverse direction on A-body, in the form of root mean square values (RMS) on June 11th and 15th, 2012
In the literature, the characteristic shapes of distributions corresponding to different kurtosis coefficients are illustrated in graphs of more pointed curves (with high peak) or more flattened than the normal distribution. It is often suggested, that this sharpening (mentioned high peak) was a distinguishing feature of the kurtosis coefficient sign. It is believed to be a mistake to link kurtosis coefficient sign with flatness or slenderness of distribution, [64]. Such an approach does not take into the account the influence of falling “shoulders” of distributions. In addition, kurtosis coefficient does not always accurately describe the analyzed data, as it was mentioned before. Interpretation of the kurtosis coefficient was not insignificant in this study and it was not possible to compare its value with other values without taking data distributions, sharpening of data distributions and thickness of falling shoulders into account. Therefore, the author postulates to remove the kurtosis coefficient from the set composition of diagnostic indicators or to develop significant changes in the diagnostic algorithm for the comparison of the coefficient value. Sample results were discussed in [62].
Prior to the analysis of the diagnostic parameter of interquartile range, the author attempted to determine its permissible values. It was necessary to determine, which method would be most suitable for this purpose. The methods possibly defining the permissible values for interquartile range are briefly described below.
First method for determining a limit value for diagnostic parameter is a method, which minimizes the probability of not detecting a failure, [65, 66]. Such a method, employed for estimating symptom limits is based on defined symptom reliability. The second method is based on a diagnostic parameter distribution, [66, 78]. In such a method, determination of the permissible value is based on the distribution of the specified diagnostic parameter. This particular method is usually used, when no medium pre-failure value of the diagnostic parameter in disposal occurs, i.e. a test was not carried out or could not be continued up to the damage of an object. The third method is based on the life curve of researched object, [68]. The life curve can be obtained as a result of an experiment carried out on many individual objects by measuring a value of diagnostic parameter at a known time of life (run) of the object until it is damaged (or under failure).
For this study the author chose the method based on the distribution of measured values of the diagnostic parameter, because the determination of the permissible value based on the distribution of the diagnostic parameter was used in cases, where no pre-failure mean value of a diagnostic parameter is in disposal, i.e. when a test could not be executed until the breakdown of the researched object (here: an electric multiple unit), which is to be dealt with under supervised exploitation considered hereby.
Table 3Selected floating permissible values for interquartile range on specific days of passing of a rail vehicle
EMU velocity ranges [km/h] | Floating permissible values for interquartile range [m/s2] | |||||||||||
Sensor (2) | Sensor (3) | Sensor (12) | Sensor (13) | Sensor (6) | Sensor (7) | Sensor (2) | Sensor (3) | Sensor (12) | Sensor (13) | Sensor (6) | Sensor (7) | |
– | Warsaw-Poznań (January 23rd-26th, 2012) | Kraków-Wrocław (June 11th, 2012) | ||||||||||
40-80 | 4.63 | 2.25 | 4.53 | 2 | 0.58 | 0.23 | 4.05 | 1.86 | 3.66 | 1.64 | 0.46 | 0.54 |
80-120 | 4.28 | 1.53 | 4.63 | 1.49 | 0.42 | 0.29 | 3.78 | 1.41 | 3.88 | 1.28 | 0.39 | 0.32 |
120-160 | 5.16 | 1.26 | 5.19 | 1.27 | 0.45 | 0.42 | 3.7 | 1.46 | 3.74 | 1.25 | 0.35 | 0.38 |
– | Warszawa-Kraków (January 19th, 2012) | Wrocław-Kraków (June 11th, 2012) | ||||||||||
40-80 | 4.31 | 2.2 | 3.95 | 2.05 | 0.66 | 0.31 | 4.12 | 1.86 | 3.99 | 1.68 | 0.51 | 0.47 |
80-120 | 4.13 | 1.64 | 4.77 | 1.83 | 0.5 | 0.33 | 3.76 | 1.28 | 3.4 | 1.18 | 0.34 | 0.31 |
120-160 | 5.06 | 1.93 | 5.14 | 1.81 | 0.78 | 0.82 | 3.88 | 1.3 | 3.56 | 1.23 | 0.32 | 0.35 |
– | Radom-Kielce (July 2nd, 2012) | Kraków-Wrocław (June 15th, 2012) | ||||||||||
40-80 | 4.7 | 2.03 | 4.75 | 1.83 | 0.53 | 0.48 | 4.05 | 1.98 | 3.99 | 1.71 | 0.5 | 0.52 |
80-120 | 5.66 | 2.04 | 5.99 | 2.02 | 0.62 | 0.53 | 3.46 | 1.36 | 3.65 | 1.07 | 0.34 | 0.28 |
120-160 | – | – | – | – | – | – | 4.05 | 1.36 | 4.15 | 1.23 | 0.38 | 0.37 |
– | Kraków-Włoszczowa (July 5 th, 2012) | Wrocław-Kraków (June 15th, 2012) | ||||||||||
40-80 | 5.61 | 2.07 | 5.12 | 2.23 | 1.31 | 0.83 | 4.36 | 2.11 | 4.17 | 1.97 | 0.61 | 0.5 |
80-120 | 3.4 | 1.43 | 3.23 | 1.29 | 0.32 | 0.32 | 3.74 | 1.12 | 3.56 | 1.11 | 0.37 | 0.28 |
120-160 | 7.15 | 2.74 | 6.39 | 2.64 | 0.84 | 1.09 | 4.18 | 1.39 | 4.22 | 1.35 | 0.37 | 0.37 |
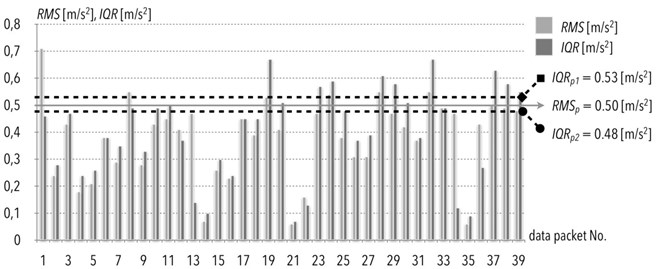
Fig. 5Comparison of accelerations signals in transverse direction in case of the A-body of the electric multiple unit measured in the form of an interquartile range values (IQR) on July 2nd, 2012, with indication of the points of exceedance and root mean square values (RMS)
In order to determine the permissible values for interquartile range, the values of elementary interquartile range were computed for each data packet. In this way, the data sample (consisting of interquartile range values, 1024 elements each) was determined. And then the mean value and the standard deviation for each of data samples were computed. Then, the permissible values were computed. Two kinds of these values were identified and introduced for subsequent research stages: a fixed permissible value and a floating permissible value. A fixed permissible value is understood herein as a limit value in the form of a real, single number, to which the values of the elementary interquartile range should be compared. Study on ascertaining the permissible elementary interquartile range is still in process. A floating permissible value, in turn, is such a limit value that has been occurred in the effect of computation data within one day of a rail vehicle run. Exemplary limit values are given in this paper, with an additional assumption, that these values are determined for three different velocity ranges of a rail vehicle: 40-80 [km/h], 80-120 [km/h] and 120-160 [km/h].
Selected floating permissible values for the diagnostic indicator for specific days of a rail vehicle runs are given in Table 3.
4. Analysis of signals obtained by the monitoring system on chosen routes under supervised exploitation conditions - comprehensive approach to diagnostic indicators
In Section 3., it has been stated that a kurtosis coefficient in its “pure” form was an unpredictable diagnostic indicator, since it is a classic measure of population concentration. The analysis attempted to associate root mean square values with values of kurtosis coefficient. Data were compared in cases, where permissible value for a root mean squared value was exceeded, with value of a kurtosis coefficient calculated for the same data package. As a result, lack of any dependency was observed. Amplitude indicator was also excluded from the analyses.
For another pairs of diagnostic indicators, it was noticed that while root mean square value exceeds the limit, the permissible value of interquartile range is exceeded as well. To observe this similarity, please refer to the example shown in Fig. 5. The exceedance of permissible values refer to the same data packets.
5. Conclusions
The analysis has proven that treating each of the diagnostic indicators separately is impossible. That is why diagnostic indicators should be approached collectively. In order to determine an algorithm in case of this study, additional analyses, which cover a broader spectrum of results than just the chosen routes of the electric multiple unit are required. However, before an algorithm that leads to a joint view of all diagnostic indicators is disposed, the significance of each diagnostic indicator must be assessed. Altogether, it is necessary to specify explicitly the acceptable levels of all other diagnostic indicators, i.e. a kurtosis coefficient (if it would be applicable) and an interquartile range. In operational use, this will allow for permanent and unambiguous determination of usefulness of diagnostic indicators.
As indicated in Section 4, the simultaneous analysis of a root mean square value and a kurtosis coefficient did not produce satisfactory results. Exceedances of permissible root mean square values occurred sporadically, and in most cases, such exceedances were related to the standard situation while a rail vehicle runs, such as crossing of a rail vehicle over rail crossings, turnouts or switches. Thus, this diagnostic indicator as such, cannot be given under assessments independently of other diagnostic indicators.
The exceedances of permissible values referred to the same data packets. The author stipulates that due to the similarity of these two parameters the research results confirmed the validity of the root mean square application in the research on condition of railway vehicles and passengers comfort of travel.
Some conclusions can be drawn:
– there were no significant similarities between the diagnostic indicators in case of a root mean square value and a kurtosis coefficient. For other pairs of diagnostic indicators, it was noted, that when a root mean square value exceeded its limit, a value of an interquartile range were exceeded as well;
– it is possible to establish the set of diagnostic parameters defining the actual health of a rail vehicle. To this set one can include the root mean square, interquartile range and kurtosis. These statistical measures values are sensitive to track quality and the vehicle speed; therefore they should be investigated in accordance to Track Quality Indicator given in [63];
– it is also possible to assess the life costs of researched objects by comparison of results gathered in a sufficiently long period of time, taking into account the history of events and wear trends (however, this requires long-term research, especially that „the railway train running along a track is one of the most complicated dynamical systems in engineering”, [69]);
– the presented monitoring system can be the economical and efficient alternative for on-board monitoring systems used for railway vehicle with active suspensions;
– presented research and the monitoring system are the instance of non-destructive tests - no additional equipment is needed, it is not onerous neither for drivers and train service team nor for passengers or traffic control centers (the presented system connected to detection of rail vehicle suspension faults is classified as condition monitoring - part of structural health monitoring).
References
-
Givoni M. Development and impact of the modern high-speed train: a review. Transport Reviews, Vol. 26, Issue 5, 2006, p. 593-611.
-
Sun X., Zhang Y., Wandelt S. Air transport versus high-speed rail: an overview and research agenda. Journal of Advanced Transportation, 2017, p. 8426926.
-
Gupta A. The world’s worst train disasters. 2014, https://www.railway-technology.com /features/featurethe-worlds-deadliest-train-accidents-4150911/.
-
Kisilowskiego J., Knothe K. Advanced Railway Vehicle System Dynamics. Wydawnictwa Naukowo-Techniczne, Warszawa, 1991, p. 1-442.
-
Knothe K., Bohm F. History of stability and road vehicles. Vehicle System Dynamics, Vol. 31, Issues 5-6, 1999, p. 283-323.
-
Chudzikiewicz A. Study on the relation between the traveling speed and forces within the wheel/rail contact zone depending on the state of track maintenance. Machine Dynamics Problems, Vol. 11, 1995, p. 7-19.
-
Goodall R. M., Roberts C. Concept and techniques for railway condition monitoring. The International Conference on Railway Condition Monitoring, 2006, p. 90-95.
-
Mei T. X., Ding X. J. Condition monitoring of rail vehicle suspensions based on changes in system dynamic interactions. Vehicle System Dynamics, Vol. 47, Issue 9, 2009, p. 1167-1181.
-
Mei T. X., Ding X. J. A model-less technique for the fault detection of rail vehicle suspensions. Vehicle System Dynamics, Vol. 46, Issue 1, 2008, p. 277-287.
-
Li P., Goodall R. M., Weston P., Ling C. S., Goodman C., Roberts C. Estimation of railway vehicle suspension parameters for condition monitoring. Control Engineering Practice, Vol. 15, 2007, p. 43-55.
-
Chudzikiewicz A. Elements of Rail Vehicles Diagnostics. Instytut Technologii i Eksploatacji, Radom, 2002.
-
Melnik R. Simulation study of damages of a rail vehicle suspension. Logistyka, Vol. 4, 2011, p. 618-624, (in Polish).
-
Bruni S., Goodall R. M., Mei T. X., Tsunashima H. Control and monitoring for railway vehicle dynamics. Vehicle System Dynamics, Vol. 45, Issues 7-8, 2007, p. 765-771.
-
Chudzikiewicz A., Sowiński B., Droździel J., Korzeb J., Opala M., Kostrzewski M., Michalski K., Melnik R. Sensors arrangement for the system of monitoring the state and diagnosis of rail vehicles and track. Biuletyn Urzędu Patentowego, Vol. 24, 2013, (in Polish).
-
Chudzikiewicz A., Sowiński B., Droździel J., Korzeb J., Opala M., Kostrzewski M., Michalski K., Melnik R. Sensors Arrangement for the System of Monitoring the State and Diagnosis of Rail Vehicles and Track. Patent Number: PL399174-A1, PL224065-B1, (in Polish).
-
Kostrzewski M., Konowrocki R. Evaluation of selected test track sections using track quality indicator. Pojazdy Szynowe, Vol. 2, 2014, p. 1-17, (in Polish).
-
Cerullo M., Fazio G., Fabbri M., Muzi F., Sacerdoti G. Acoustic signal processing to diagnose transiting electric trains. IEEE Transactions on Intelligent Transportation Systems, Vol. 6, Issue 2, 2005, p. 238-243.
-
Dižo J., Steišunas S., Blatnický M. Vibration analysis of a coach with the wheel-flat due to suspension parameters changes. Procedia Engineering, Vol. 192, 2017, p. 107-112.
-
Fassois S. D., Dimogianopoulos D. G. Fault detection and identification in stochastic mechanical systems: an overview with applications. The 5th National Conference of the Hellenic Society for Non-Destructive Testing, Athens, Greece, 2005, p. 1-19.
-
Sakellariou J. S., Petsounis K. A., Fassois S. D. On board fault detection and identification in railway vehicle suspensions via a functional model based method. Proceedings of International Conference on Noise and Vibration Engineering, Leuven, Belgium, 2002.
-
Sakellariou J. S., Petsounis K. A., Fassois S. D. A functional model based method for fault detection and identification in stochastic structural systems. 2nd European Workshop on Structural Health Monitoring, Munich, Germany, 2004, p. 679-686.
-
Domin R., Domin I., Cherniak G. Estimation of dynamic performances of the safe operation of high-speed electric train. Archives of Transport, Vol. 41, Issue 1, 2017, p. 7-16.
-
Masinovic A. Vehicle fatigue and rail track condition monitoring system. SAE-A Vehicle Technology Engineer – Journal, Vol. 3, Issue 1, 2017, p. 1-10.
-
Hába A., Zelenka J., Musil M., Vágner J., Kohout M., Havlíček P. Diagnostics of railway vehicle based on dynamical response measurement. Vibroengineering Procedia, Vol. 3, 2014, p. 272-277.
-
Linlin D., Weining L. Study on wheel-rail interaction based on rail roughness. Vibroengineering Procedia, Vol. 5, 2015, p. 475-480.
-
Goda K., Goodall R. M. Fault-detection-and-isolation system for a railway vehicle bogie. 18th IAVSD Symposium Dynamics of Vehicles on Roads and on Tracks, Asugi, Japan, 2013.
-
Goda K., Goodall R. M. Fault detection and isolation system to a railway vehicle bogie. Vehicle System Dynamics, Supplement, Vol. 41, 2004, p. 468-476.
-
Li P., Goodall R. Model-Based Condition Monitoring for Railway Vehicle System. University of Bath, UK, 2004, p. 1-5.
-
Li P., Goodal R. M. Model based approach to railway vehicle fault detection and isolation. Electronic Systems and Control Division Research, 2003, p. 7-10.
-
Li P., Goodal R., Kadirkamanathan V. Estimation of parameters in a linear state space model using a Rao-Blackwellised particle filter. IEE Proceedings: Control Theory and Applications, Vol. 151, 2004, p. 727-738.
-
Ramin D., Alfi S., Bruni S. Fault diagnosis of bogie components for high-speed trains. 8th Conference on Railway Bogies and Running Gears, Budapest, Hungary, 2010.
-
Alfi S., Bionda S., Bruni S., Gasparetto L. Condition monitoring of suspension components in railway bogies. 5th IET Conference on Railway Condition Monitoring and Non-Destructive Testing, 2011.
-
Hayashi Y., Tsunashima H., Marumo Y. Fault detection of railway vehicle suspension systems using multiple-model approach. Journal of Mechanical Systems for Transportation and Logistics, Vol. 1, Issue 1, 2008, p. 88-99.
-
Tsunashima H., Mori H. Condition monitoring of railway vehicle suspension using adaptive multiple model approach. International Conference on Control, Automation and Systems, Gyeonggi-do, Korea, 2010.
-
Tsunashima H., Hayashi Y. Hirotaka Mori H., Marumo Y. Condition monitoring and fault detection of railway vehicle suspension using multiple-model approach. Proceedings of the 17th World Congress the International Federation of Automatic Control Seoul, Korea, 2008.
-
Tsunashima H., Kojima T., Marumo Y., Matsumoto A., Mizuma T. Condition monitoring of railway track using in-service vehicle. International Symposium on Speed-up, Safety and Service Technology for Railway and Maglev Systems, Niigata, Japan, 2009, p. 1-7.
-
Tsunashima H., Naganuma Y., Matsumoto A., Mizuma T., Mori H. Condition monitoring of railway track using in-service vehicle. Reliability and Safety in Railway, 2012, p. 333-356.
-
Mei T. X., Ding X. J. New condition monitoring techniques for vehicle suspensions. Proceeding of the 3rd IET International Conference on Railway Condition Monitoring, Derby, UK, 2008.
-
Hayashi Y., Kojima T., Hitoshi Tsunashima H., Marumo Y. Real time fault detection of railway vehicles and tracks. Proceeding of the 4th IET International Conference on Railway Condition Monitoring, Derby, UK, 2006, p. 20-25.
-
Fan H., Wei X., Jia L., Qin Y. Fault detection of railway vehicle suspension systems. Proceedings of the 5th International Conference on Computer Science and Education (ICCSE), Hefei, Anhui, China, 2010, p. 1264-1269.
-
Wei X., Guo Y., Jia L. MBPLS-based rail vehicle suspension system fault detection. The 26th Chinese Control and Decision Conference, Changsha, China, 2011, p. 3602-3607.
-
Jabłońska J. Selected problems of dynamics and diagnosis of a rail vehicle with disturbed symmetry. Warsaw University of Technology, Warsaw, Poland, 2004 (in Polish).
-
Chudzikiewicz A. Aplication of SHM Concept in Monitoring of Rail Vehicle. Selected Dynamical Problems in Mechanical Systems: Theory and Applications in Transport. Oficyna Wydawnicza Politechniki Warszawskiej, Warszawa, 2014, p. 1-20.
-
Chudzikiewicz A. Monitoring System of Rail Vehicle and Track – Project MONIT, Dynamical Problems in Rail Vehicles. Oficyna Wydawnicza Politechniki Warszawskiej, Warszawa, 2013.
-
Chudzikiewicz A., Bogacz R., Kostrzewski M. Using acceleration signals recorded on a railway vehicle wheelsets for rail track condition monitoring. The e-Journal of Nondestructive Testing, Vol. 20, Issue 2, 2015, p. 167-174.
-
Chudzikiewicz A., Droździel J., Sowiński B. Practical solution of rail vehicle and track dynamics monitoring system. Key Engineering Materials, Vol. 518, 2012, p. 271-280.
-
Chudzikiewicz A., Melnik R. Statistical analysis of vibration for the rail vehicle suspension monitoring system. Proceedings of the 13th Mini Conference on Vehicle system Dynamics, Identification and Anomalies, Budapest, Hungary, 2012, p. 623-624.
-
Chudzikiewicz A., Sowiński B., Melnik R. Experimental research of the rail vehicle and track monitoring systems. Proceedings of the Slovak-Polish Workshop, University of Žilina, Žilina, Slovakia, 2013, p. 26-40.
-
Chudzikiewicz A., Stelmach A. Acceleration signals in the process of monitoring the rail vehicle and track. Proceedings of the International Institute of Acoustics and Vibration, 2013, p. 620-627.
-
Kostrzewski M., Chudzikiewicz A. Rail vehicle and rail track monitoring system – a key part in transport sustainable development. Zeszyty Naukowe Wyższej Szkoły Bankowej we Wrocławiu, Vol. 1, 2015, p. 59-74.
-
Kostrzewski M., Chudzikiewicz A. Rail-track quality indicator towards rail vehicle driving dynamics. Proceedings of the Mini Conference on Vehicle System Dynamics, Identification and Anomalies, Budapest, Hungary, 2014, p. 211-218.
-
Melnik R., Sowiński B. The selection procedure of diagnostic indicator of suspension fault modes for the rail vehicles monitoring system. 7th European Workshop on Structural Health Monitoring, 2014, p. 159-166.
-
Melnik R., Sowiński B. The analysis of rail vehicle model eigenvalues for suspension fault detection method. Proceedings of the Mini Conference on Vehicle System Dynamics, Identification and Anomalies, 2014, p. 39-46.
-
Melnik R., Chudzikiewicz A. Assessment of the EMU and track condition monitoring results from chosen track sections during normal operation. Logistics and Transport, Vol. 20, Issue 4, 2013, p. 99-106.
-
Melnik R., Sowiński B. Aplication of the rail vehicle’s monitoring system in the process of suspension condition assessment. Komunikacie, Vol. 15, Issue 4, 2013, p. 3-8.
-
Testing and Aproval of Railway Vehicles from the Point of View of Their Dynamic Behaviour – Safety — Track Fatigue, Ride Quality. UIC 518: 2009, 4th edition, 2009.
-
Railway Applications – Testing for the Acceptance of Running Characteristics of Railway Vehicles – Testing of Running Behaviour and Stationary Tests. EN 14363: 2005.
-
Hebda M. Car Exploitation. Wydawnictwo Instytutu Technologii i Eksploatacji – PIB, Radom, Poland, 2005, (in Polish).
-
Melnik R. Selection of Statistical Parameters of Measurement Signals in the Process of Diagnosing the Suspension Status of a Rail Vehicle. Wydział Transportu Politechniki Warszawskiej, Warsaw, Poland, 2014, (in Polish).
-
Melnik R., Kostrzewski M. Rail vehicle’s suspension monitoring system - analysis of results obtained from tests of the prototype. Key Engineering Materials, Vol. 518, 2012, p. 281-288.
-
Ferreira A. J., Figueiredo M. A. T. Efficient feature selection filters for high-dimensional data. Pattern Recognition Letters, Vol. 33, Issue 13, 2012, p. 1794-1804.
-
Chudzikiewicz A., Kostrzewski M. Analysis of vibroacoustic signals in a process of the condition monitoring of rail vehicle’s suspension and rail track. Pojazdy Szynowe, Vol. 1, 2013, p. 10-17, (in Polish).
-
Chudzikiewicz A., Bogacz R., Kostrzewski M., Konowrocki R. Condition monitoring of railway track systems by using acceleration signals on wheelset axle-boxes. Transport, https://doi.org/10.3846/16484142.2017.1342101.
-
Moszczyński L. The interpretation of the kurtosis statistics. Przegląd Elektrotechniczny, Vol. 79, Issue 9, 2003, p. 558-560, (in Polish).
-
Cempel C. Vibroacoustic Diagnostics of Machines. PWN, Warszawa, 1989, (in Polish).
-
Tomaszewski F. Possibilities of the limit value valuation of the diagnostic symtom according to the current level of the object reliability. Diagnostyka, Vol. 30, Issue 2, 2004, p. 137-140, (in Polish).
-
Migdalski J. Reliability Engineering. Guide. ATR Bydgoszcz, ZETOM, Warszawa, 1992, (in Polish).
-
Tabaszewski M. Methods of selection of forecasting models in automatic condition monitoring systems. Diagnostyka, Vol. 30, Issue 2, 2004, p. 125-128, (in Polish).
-
Wickens A. H. A History of Railway Vehicle Dynamics. Handbook of Railway Vehicle Dynamics. CRC Press, Boca Raton, 2006, p. 5-38.
Cited by
About this article

The author expresses his thankfulness for the financial support by the Polish Ministry of Science and Higher Education for the support of studies within the framework of the project known as MONIT (Monitoring of Technical State of Construction and Evaluation of its Lifespan. Action Operational Programme Innovative Economy). And at the same, the release of this paper is financed by statutory work of Section of Dynamic Modeling of Rail Vehicles operating at Warsaw University of Technology, Transport Faculty, Division of Transport Means Fundamentals.
