Abstract
The last stage of the turbine low pressure cylinder has a complex flows, especially under the high mass flow and low mass flow conditions, where there is an obvious unsteady flow phenomena and obvious rotor-stator interaction. In order to further research on the flow of the last stage for the low pressure cylinder, the last stage blade of low pressure cylinder of 150 MW steam turbine is taken as the research object. Unsteady numerical simulation on the aerodynamic characteristics of the last stage blade for the steam turbine is conducted under a series of mass flow conditions (high mass flow condition, design condition and low mass flow condition) using the commercial CFD software ANSYS-CFX. As a result, rotor-stator interaction is most obvious in the root of the blade, followed by the midspan region, it is weaker in tip of the blade. Comparing internal flow details of the last stage blade in the three conditions, stator flow export and rotor blade passage have a larger energy loss under the low mass flow condition, and the flow is relatively smooth under the high mass flow and design conditions. Finally, energy conversion efficiency of the last stage blade is the highest under the design condition, followed by the high mass flow, and energy conversion efficiency of the last stage blade is the lowest under the low mass flow condition.
1. Introduction
Turbine machinery is one of the main cores of the whole energy system. In modern power plant, steam turbine is the most widely used energy power plant application, which is mainly driven by steam power, transforming heat energy of the steam into mechanical energy [1-4]. There is very high request for the strength of steam turbine blades and the stability of the internal flow field, mainly because of the steam turbine running environment and the special structure complexity. Once the steam turbine unit operation equipment fails, it will create a great economic loss, and threat personal security. With the development of modern society, the steam turbine unit is moving in the direction of high performance, high parameter and high security. As a result, research on turbine machinery fault mechanism and diagnosis technology is most urgent. Generally speaking, the level at the end of the power turbine low pressure cylinder work under wet steam condition, and a fluid backflow phenomenon will appear. At the same time, with water droplets hit the cascade, due to erosion in the dynamic cascade at the outlet, the last stage blades of the turbine low pressure cylinder will be damaged, which will endanger life, or even directly impact on the safety performance of the steam turbine plant [5-7]. Currently, in most high-power turbine, 30 % power of the entire unit is all provided by the low pressure cylinder. Therefore, the safe and efficient operation is important for improving the aerodynamic performance of the turbine, reducing the eddy current loss and improving efficiency of the steam turbine unit [8-11].
Due to characteristics such as the low pressure cylinder gas expands rapidly, the gas flow has significant characteristic, gas gets into the wet steam region, and cylinder coupled with the exhaust outlet boundary, the flow of low pressure cylinder becomes complicated [12-14].
In order to reveal the last stage of the turbine low pressure cylinder flow characteristics and influencing factors, the paper analyzes aerodynamic characteristics and variation of the low pressure cylinder for steam turbine under different mass flow conditions by using the commercial CFD software ANSYS-CFX [15-20]. At present, the research of this problem at home and abroad is less, so this paper uses CFD method to study the change of blade height of steam turbine last stage, and guide the operation regulation and production and manufacturing of steam turbine.
2. Physical model
A single turbine stage is analyzed in the present work. This paper takes the last stage blade of low pressure cylinder of 150 MW steam turbine as the research object as shown in Fig. 1. The present turbine stage has 66 stator blades and 114 rotor blades. The center heights of stator and rotor blades are 0.84 m and 0.9 m respectively. The rotation blades frequency is 50 Hz. Using a single passage to make numerical calculation on the last stage blades, and separately take one stator blade and one rotor blade one to calculate. Solidity is not changed. The calculations are performed between a single passage for the stator and two passages for the rotor by applying the periodical boundary condition in circumferential direction.
Fig. 1The steam turbine low pressure cylinder
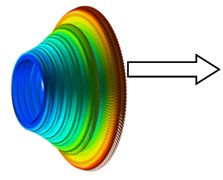
a) Steam turbine low pressure cylinder
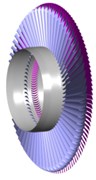
b) Last stage of low pressure cylinder
3. Numerical calculation
3.1. Calculating range and grid settings
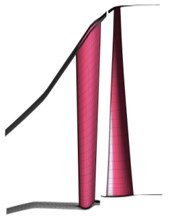
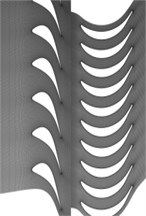
The multi-block structured grid is generated for the last stage blades using NUMECA Autogrid5 software. The blades near wall area and far wall area is respectively adopted grid and grid. The stator blades grid distribution is 57×177 (circumferential × spanwise), and the rotor blades grid distribution is 57×161 (circumferential × spanwise). The computational domain of single stator and rotor passage is 630.000, including 320.000 stator blades grid nodes, and 310.000 rotor blades grid nodes. The generated grid orthogonality is more than 35, and extension ration is less than 2.9, the grid quality could meet the requirements. Calculation area and grid map are shown in Fig. 2.
Fig. 2Calculation area and grid map
a)
b)
3.2. Calculation method
The numerical simulations in the present work are conducted by using the commercial CFD software ANSYS-CFX [14]. The solutions are obtained by solving the steady compressible Navier-Stokes equations in which a finite control volume method is used to discretize these equations. In cartesian coordinate system, continuity equation, momentum equation and energy equation are expressed respectively as follows:
where, is time, is density, is pressure, is the molecular viscosity, is the position vector, is the velocity vector, is the turbulent kinetic energy, represents sum of molecular Reynolds stress tensor, represents vector sum of molecular turbulence heat.
The stagnation enthalpy and stagnation internal energy are defined respectively as follows:
With and denote the enthalpy and internal energy.
The standard - SST turbulent model with the wall function method is used to describe the turbulent effect [18]. Steady-state computation is set as initial condition of the calculation, and then unsteady calculation is conducted. Rotor and stator blades of interface adopt mixing plane method, and calculation process accelerates the convergence by using sliding grid technology. Unsteady time step is 0.000044 s, and the corresponding rotation angle is 0.789°. Record the calculation for the first two weeks, and after the condition becomes stable, calculate all statistics in the next four weeks.
3.3. Formulation of boundary condition
The inlet boundary condition is imposed at the entrance of the last turbine stage. The outlet boundary condition is placed at downstream from the exit of the exhaust hood. The computational domain of the exhaust hood exit is extended to avoid backflow. The total temperature, dryness, mass flow rate and flow direction are specified at the inlet boundary condition, and the average static pressure is given as the outlet boundary condition. According to the principle of radial average, inlet absolute pressure is 27257 Pa, outlet backpressure is 5300 Pa, and the total temperature is 340.5 K. The adiabatic wall condition is used for the solid surface of the computational domain.
4. Calculation results and discussion
The efficiency distribution about the last stage blade of the low pressure cylinder under the mass flow conditions is shown in Table 1. It shows that the last stage of low pressure cylinder of the isentropic compression and polytropic compression efficiency are both 100 %. And efficiency of isentropic expansion and polytropic expansion are the highest under design conditions, indicating the design is reasonable under the rated conditions.
Table 1Final stage isentropic efficiency of low pressure cylinder under variable conditions (%)
Relative Flow | Low mass flow | Design condition | High mass flow |
Isentropic compression | 100 | 100 | 100 |
Isentropic expansion | 88.27 | 90.35 | 88.81 |
Polytropic compression | 100 | 100 | 100 |
Polytropic expansion | 87.82 | 89.98 | 88.36 |
4.1. Torque changes for steam turbine blade
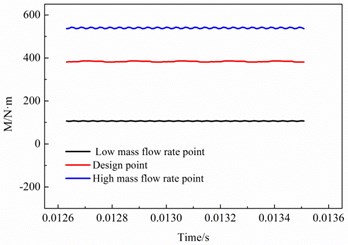
Fig. 3 shows the torque convergence of the last stage blade. With time, the blade torque fluctuates regularly around a fixed value. It can also be seen that the calculation has been stable from the torque changes with time. In the torque value case, the torque on the last stage of steam turbine is the largest under high mass flow condition, followed by the design condition, and the torque value is the minimum under low mass flow condition. From the energy conversion effect, it conforms to the actual physical situation, that is to say, the greater the flow, the greater the turbine output. But torque value under design condition is three times of that under the low mass flow condition, and torque value under high mass flow condition is about 1.4 times of that under design condition. It illustrates the torque value has a nonlinear relation with mass flow. It has great relation with internal flow of low pressure cylinder. Below, details of the low pressure cylinder internal flow is analyzed.
Fig. 3Torque changes
4.2. Mach number distribution for steam turbine blade
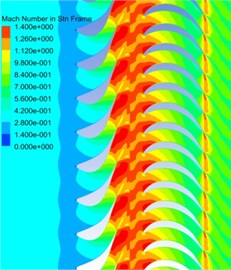
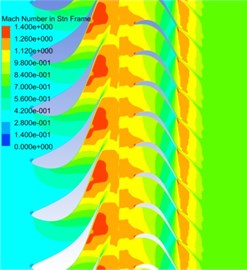
Figs. 4-6 show the Mach number distribution of the last stage of low pressure cylinder under different mass flow conditions and blade heights (10 %, 50 % and 90 % relative blade height). Figs. 4, 5 and 6(a) and (b) show the subsonic flow at the inlet section of the stator blade. The Mach number is greater than 1 at the exit section from the hub to top of the stator blade. In a word, the outlet section of stator blade produces shock wave. Compared with different blade height positions, Mach number is the strongest in the root of the inlet section of the stator blade. From bottom of blade to tip, it shows a decreasing trend. There is no shock wave in the tip of the blade.
Figs. 4-6 have shown the results. The stator blade trailing edge shock wave has a greater influence on the suction surface. Mainly, there is a far distance between stator blade and rotor blade, and the shock wave intensity is weaker on the outlet section of stator blade trailing edge, which is unable to make the steam flow directly hit the rotor blade pressure surface. Therefore, stator blade trailing edge shock has a smaller influence on the rotor blade pressure surface. Figs. 4 to 6(a) show rotor-stator interaction is obvious in the blade root. There is larger energy loss area in the inlet of rotor blade, especially in the outlet of stator blade, where there is a high-speed local area. Compared with the three conditions, it can be found that such phenomenon exist in all high mass flow, low mass flow and design condition. In spanwise position of the middle of blade, rotor-stator interaction is weak. At the tip of the blade, there are little obvious interference of stator and rotor with more smooth flow and less energy loss.
Fig. 4Mach number distribution under the low mass flow
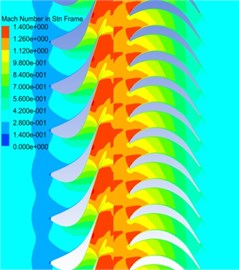
a) 10 % relative blade height
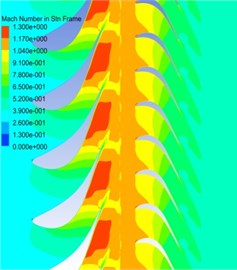
b) 50 % relative blade height
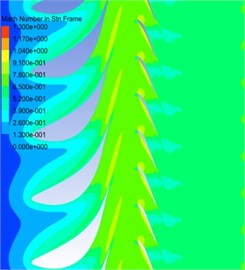
c) 90 % relative blade height
Fig. 5Mach number distribution under design condition
a) 10 % relative blade height
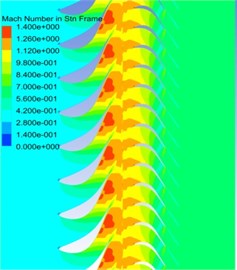
b) 50 % relative blade height
c) 90 % relative blade height
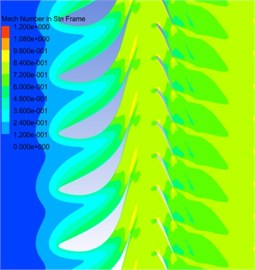
Fig. 6Mach number distribution under the high mass flow
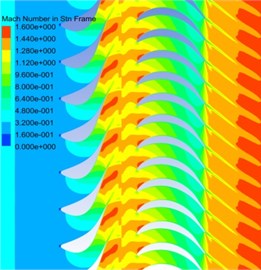
a) 10 % relative blade height
b) 50 % relative blade height
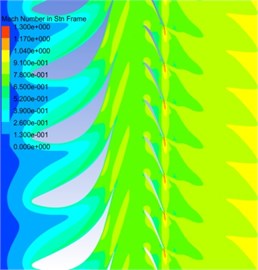
c) 90 % relative blade height
4.3. Static pressure contours for steam turbine blade
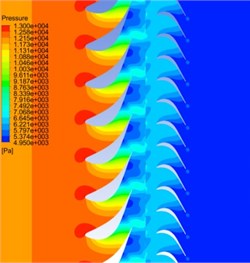
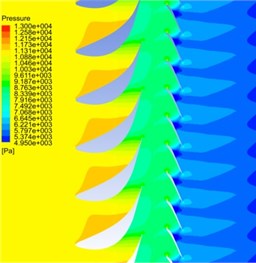
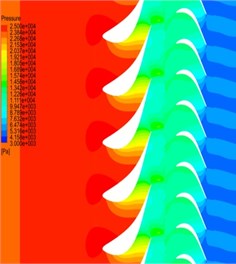
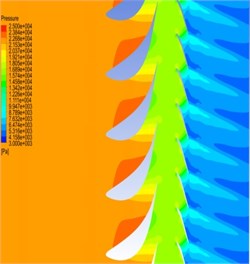
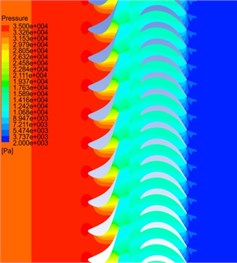
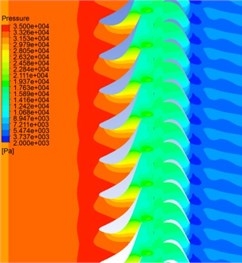
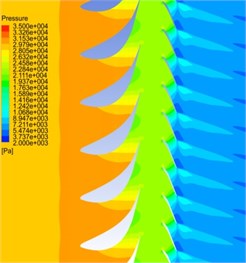
Figs. 7-9 show the static pressure contours of the last stage of low pressure cylinder under off-design condition and different blade height (10 %, 50 % and 90 % relative blade height). Fig. 7 gives action between pressure potential of stator blade and the steam flow of rotor blade. When rotor blade went through each stator blade passage, it would appear the reciprocating cycle of “direct pressure – reverse pressure – direct pressure”. Static pressure is bigger in the root of the blade, followed by the midspan region, and static pressure is smaller in tip of the blade. That is to say, from bottom of blade to tip, it shows a decreasing trend. Fig. 8 shows static pressure distribution under design condition, it proved the correctness of the conclusion. Compared with Figs. 7, 8 and 9(a), static pressure drops rapidly in the root of stator outlet and rotor inlet, and it illustrates that pressure energy can be transformed into kinetic energy in the rotor blade.
In the low mass flow case, there appears high-pressure zone in the stator exports to its junction, which indicates the fluid flow isn’t relatively smooth, and appears the local energy loss. But it doesn’t appear this situation under the high mass flow and design condition. To sum up, internal flow effect of low pressure cylinder under low mass flow condition is poorer. Compared with Figs. 7, 8 and 9(b) in the low mass flow case, stator export appears local low-pressure in midspan region of blade, that is to say, there might be a flow separation in the location, and energy loss is bigger. Moreover, it doesn’t appear the situation under high mass flow and design condition. In three conditions, the pressure gradient has a uniform change at the tip of blade, and energy loss is small.
Fig. 7Static pressure contours under the low mass flow
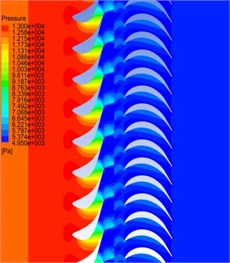
a) 10 % relative blade height
b) 50 % relative blade height
c) 90 % relative blade height
Fig. 8Static pressure contours under design condition
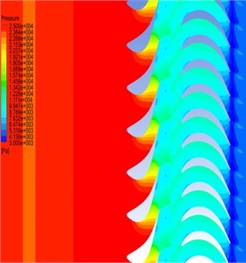
a) 10 % relative blade height
b) 50 % relative blade height
c) 90 % relative blade height
Fig. 9Static pressure contours under the high mass flow
a) 10 % relative blade height
b) 50 % relative blade height
c) 90 % relative blade height
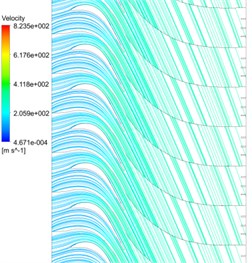
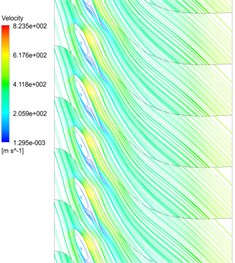
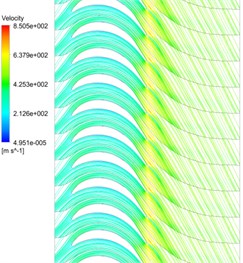
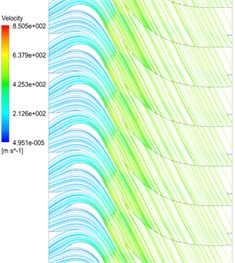
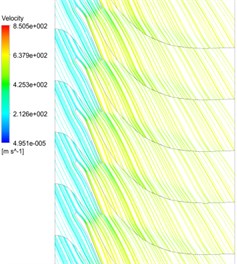
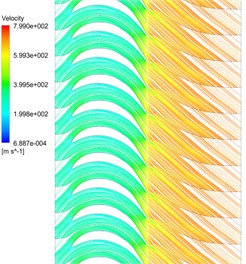
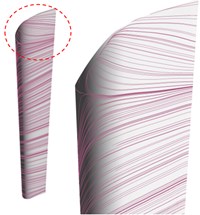
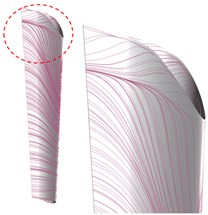
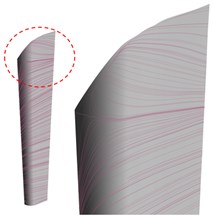
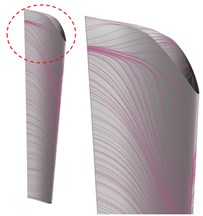
4.4. Stream surface streamlines for steam turbine blade
Figs. 10-12 show the steam surface streamline of the last stage of low pressure cylinder under different mass flow conditions and blade heights (10 %, 50 % and 90 % relative blade height). In 10 % and 90 % of blade, due to the negative angle, there is eddy current in the last stage pressure side as shown in Fig. 10. In 50 % of blade, leading edge points of blade appear the flow separation. Fig. 12 shows flow separation at the blade trailing edge. It is mainly because of cascade exit edge, where there is a certain thickness, and it is affected by the boundary layer along the pressure surface and suction surface steam flow. Hence, there is the wake loss. Compared with Figs. 10, 11 and 12(a), in the low mass flow case, leading edge and trailing edge of rotor blade suction surface appears flow separation.
Fig. 10Stream surface streamlines under the low mass flow
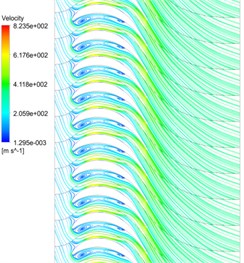
a) 10 % relative blade height
b) 50 % relative blade height
c) 90 % relative blade height
Fig. 11Stream surface streamlines under design condition
a) 10 % relative blade height
b) 50 % relative blade height
c) 90 % relative blade height
Fig. 12Stream surface streamlines under the high mass flow
a) 10 % relative blade height
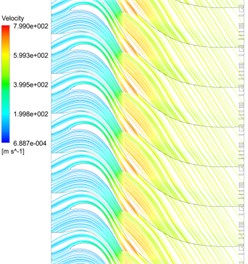
b) 50 % relative blade height
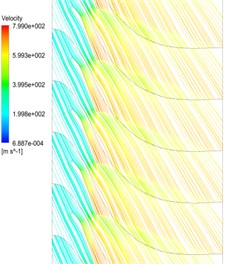
c) 90 % relative blade height
However, there isn’t flow separation in high mass flow and design conditions. In three conditions, there is flow separation in midspan region of rotor blade. In the tip of blade, pressure surface of blade appears flow separation under low mass flow condition, and there isn’t the situation in high mass flow and design conditions. Therefore, rotor flow passage easily appears flow separation in low mass flow condition, and the efficiency is lower.
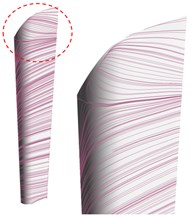
4.5. Limiting streamlines for steam turbine blade
Figs. 13-15 show the limiting streamline of the last stage of low pressure cylinder under different mass flow conditions respectively. In 10 % of the blade, the pressure surface is bigger than the pressure of the suction surface in the stator blade passage, and airflow velocity is smaller in the end boundary layer. So centrifugal force can’t balance the pressure differential between the pressure surface and suction surface, so it appears to transverse flow within the boundary layer. Near the end position, the transverse flow interacts with mainstream, and makes intense thickening of the boundary layer. Hence, it appears the end-losses. By comparing three conditions, the flow is similar, that is to say, there is flow separation in the tip of blade and an obvious separation streamline.
Fig. 13Limiting streamlines of static blade under the low mass flow
a) Suction surface
b) Pressure surface
Fig. 14Limiting streamlines of static blade under design condition
a) Suction surface
b) Pressure surface
Fig. 15Limiting streamlines of stator blade under the high mass flow
a) Suction surface
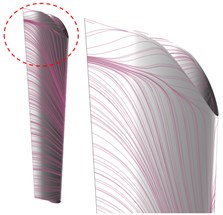
b) Pressure surface
5. Pressure coefficient distribution for steam turbine blade
The blade surface pressure coefficient distribution is one of the most important basis to analyze the three-dimensional cascade flow. It can determine the blade loading distribution. The pressure coefficient distribution is defined as follows:
where, is the local pressure, and are the total mean pressure of the cascade inlet and outlet respectively.
Fig. 16 shows the distribution graph of static pressure coefficient about stator blade and rotor blade under different mass flow conditions. is static pressure coefficient. Fig. 16(a) shows obvious change at the top of the stator blade. From the stator blade leading edge points to 80 % of axial chord length, the pressure difference of suction surface and pressure surface is always within a smaller range, transverse flow is weak, and the secondary vortex develops slowly. From 80 % of axial chord length to the stator blade trailing edge points, the pressure difference of suction surface and pressure surface is bigger, transverse flow speed is faster, the secondary vortex develops strong, and load characteristics after load forms are obvious. When airstream flowed through at the back of stator blade passage, it would make rapid expansion. Eventually, the speed is larger, and the process is shorter. So, the secondary vortex just gets out of the airstream passage before further development, which effectively reduces the secondary vortex loss. As shown in Fig. 16(b). The blade load in the front of the rotor is relatively small, and the front of the rotor blade steam circulation way axial pressure gradient is smaller. Therefore, potential affection of rotor blade to stator blade is smaller.
Fig. 16Blade surface pressure coefficient under variable condition in 10 % relative blade height
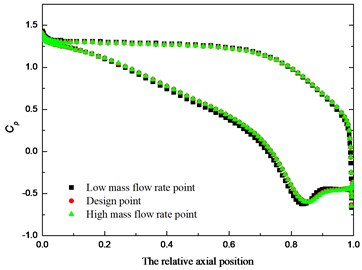
a) Root of stator blade
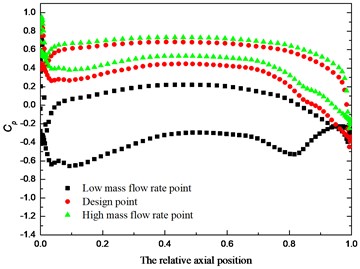
b) Root of rotor blade
6. Conclusions
The unsteady aerodynamic performance in the steam turbine low pressure was numerically investigated under off-design working condition based on the commercial CFD software ANSYS-CFX. The results were summarized as follows:
1) The last stage of the steam turbine, under the dynamic and static interference, the loss of the channel is mainly derived from the stationary blade channel. When the last stage blade of steam turbine is working in a low mass flow condition, the static blades loss mainly occurs near the middle of the exhibition, followed by the root of the blade, and the loss near the tip position is relatively small; when the last stage blade of steam turbine is working in the design flow condition, the flow in the static blades is smooth, and the flow loss is small in the range of the whole exhibition; when the last stage blade of steam turbine is working in a high mass flow condition, the static blades in the total flow loss is also small. Therefore, when the last stage blade of steam turbine is working in a low mass flow condition, the exhibition flow monitoring in the blade should be strengthened. Or in the manufacture of last stage blade of steam turbine, in order to ensure the safety stability of the blade under full operation conditions, the exhibition strength in the blade should be strengthened.
2) Comparing the three conditions, stator flow export has a larger energy loss under the low mass flow condition, and the flow is relatively smooth under the high mass flow and design condition.
3) Torque of the last stage blades for steam turbine increases with the increasing flow, but it is in a nonlinear relation. In the energy conversion efficiency case, it is the highest under the design condition, followed by the high mass flow, and energy conversion efficiency of the last stage blade is the lowest under the low mass flow condition. This is corresponding with internal flow of the last stage blade.
References
-
Dénos R., Paniagua G. Effect of vane-rotor interaction on the unsteady flow field downstream of a transonic high-pressure turbine. Proceedings of the Institution of Mechanical Engineers, Part A: Journal of Power and Energy, Vol. 219, Issue 6, 2005, p. 431-442.
-
World Energy Outlook. International Energy Agency, 2012, p. 49-74.
-
Yang Y., Wang L., Dong C., Xu G., Morosuk T., Tsatasaronis G. Comprehensive exergy-based evaluation and parametric study of a coal-fired ultra-supercritical power plant. Applied Energy, Vol. 112, 2013, p. 1087-1099.
-
Miller B. G. Clean Cowal Engineering Technology. Elsevier Ltd, Oxford United Kingdom, Butterworth Heinemann, 2010.
-
Fang X., Dai Q., Yin Y., et al. A compact and accurate empirical model for turbine mass flow characteristics. Energy, Vol. 35, Issue 12, 2010, p. 4819-4823.
-
Jang Hyuck Jun, Kang Soo Young, Lee Jeong Jin, Kim Tong Seop, Park Seong Jin Performance analysis of a multi-stage ultra-supercritical steam turbine using computational fluid dynamics. Applied Thermal Engineering, Vol. 87, Issue 5, 2015, p. 352-361.
-
Wang Hongtao, Zhu Xiaocheng, Du Zhaohui Aerodynamic optimization for low pressure turbine exhaust hood using Kriging surrogate model. International Communications in Heat and Mass Transfer, Vol. 37, Issue 8, 2010, p. 998-1003.
-
Da Lio Luca, Manente Giovanni, Lazzaretto Andrea New efficiency charts for the optimum design of axial flow turbines for organic Rankine cycles. Energy, Vol. 77, Issue 1, 2014, p. 447-459.
-
Yang R., Yang J. D., Qi M. X. Numerical investigation of leakage and power loss for different seal types in turbine stage environment. Proceedings of ASME Turbo Expo: Power for Land, Sea and Air, 2010.
-
Wechsung M., Feldmüller A., Lemmen H. Steam turbines for flexible load operation in the future market of power generation. Proceedings of ASME Turbo Expo: Turbine Technical Conference and Exposition, 2012.
-
Abdelfattah S. A., Schobeir M. T. Experimental and numerical investigations of aerodynamic behavior of a three-stage HP-turbine at different operating conditions. Proceedings of the ASME Turbo Expo: Power for Land, Sea and Air, 2010.
-
Qi Lei, Zou Zhen Ping, Lu Hong Zhi Numerical simulation of 3-Dimensional flow in last two stages of air-cooled steam turbines. Journal of Chinese Society of Power Engineering, Vol. 25, Issue 5, 2005, p. 647-651.
-
Dai Li Ping, Cai Hu, Kang Shun Numerical simulation of last two stage 3d flow field of 150 MW steam turbine. Turbine Technology, Vol. 2, 2010, p. 87-90.
-
Yamada K., Funazaki K., Hiroma K., Tsutsumi M., Hirano Y., Matsuo A. Effect of wake passing on unsteady aerodynamic performance in a turbine stage. Proceedings of the ASME Turbo Expo: Power for Land, Sea and Air, 2006.
-
Feng Zi Ming, Zhang Jin Dong, Gu Hui Bin Steam turbine rotor balde cascades aerodynamic performance research at off-desing incidence. Proceedings of the ASME Gas Turbine India Conference, 2012.
-
Lei Gao, Qun Zheng, Hang Chen Comparative experimental investigation on aerodynamic performance of steam turbine cascades. Part 1: Rotor blades. Proceedings of ASME Turbo Expo Turbine Technical Conference and Exposition, 2013.
-
Shao Shuai, Deng Qinghua, Shi Heshuang, Feng Zhenping, Cheng Kai, Peng Zeying Numerical investion on flow characteristics of low pressure exhaust hood under off-design condition for steam turbines. Proceedings of ASME Turbo Expo Turbine Technical Conference and Exposition, 2013.
-
Jiandao Yang, Rui Yang, Liqun Shi, Hong Yang, Jun Li Experimental and numerical investigation on performance and flow in the last stage group of a wet steam turbine. Proceedings of ASME Turbo Expo: Turbine Technical Conference and Exposition, 2014.
-
ANSYS CFX 14.0. ANSYS Inc, 2011.
-
Murari S., Sathish S., Shraman G., Liu J. S. CFD aerodynamic performance validation of a two-stage high pressure turbine. Proceedings of ASME Turbo Expo: Turbine Technical Conference and Exposition, 2011.
Cited by
About this article

The authors are grateful to Youth Scientific Research Fund Project of Beijing Wuzi University (2018XJQN04) and National Natural Science Foundation of China (Grant No. 51276059). Also, many thanks to Fundamental Research Funds for the Central Universities (No. 2014XS25).
