Abstract
The seismic response analysis of underground cavern groups of Xiluodu hydraulic power plant have been investigated by commercial codes in geotechnical engineering FLAC, which is used as the analysis tool to study the diffraction of P wave by the circular hole and the feasibility of the explicit finite difference method to analyze the diffraction in the solid medium is verified. Numerical model in two dimensions of underground cavern groups of Xiluodu hydraulic power plant is generated and the seismic response of underground cavern groups is investigated. Maximum and minimum principal stress amplitude and displacement vectors amplitude of surrounding rock mass gained by the numerical analysis is obtained, which show there is no tensile damage when the underground cavern groups are subjected to the Tangshan aftershock, the displacement of underground openings is not very large, and the surrounding rock still behaves elastically. The results from the analysis can be for reference to similar hydraulic power plant design and construction.
1. Introduction
Xiluodu hydraulic power plant is constructed in Xiluodu Valley in China. Mian power house, transformer substation and tailwater surge chamber are laid out abreast and constitute large scale underground cavern groups [1]. In the aspect of earthquake-resistant behavior, underground openings are remarkably superior to the surface structures, which have reached a consensus [2-4]. However, the seismic damage investigation objectively shows the existence of cracks and damage, or even the collapse of the underground openings [5-8]. Therefore, in the period of design, construction and operation of Xiluodu underground openings, the seismic loading should be seriously taking into consideration in which the seismic response analysis should be carried out and reasonable safety assessment method should be developed.
In the presented paper, FLAC [9] (Fast Lagrangian Analysis of Continua) is used as the analysis tool to study the diffraction of P wave by the circular hole and the feasibility of the explicit finite difference method to analyze the diffraction in the solid medium is verified, which provides the theoretical basis for the explicit finite difference method to analyze the seismic response of underground openings. Subsequently, numerical model in two dimensions of underground cavern groups of Xiluodu hydraulic power plant is generated and the seismic response of underground cavern groups is investigated. Some conclusions are proposed, which are aimed at providing theoretical basis and some advices for the prediction of the seismic response and the safety assessment procedures for the underground engineering.
2. Verification of the explicit finite difference method
The diffraction of P wave in the infinite elastic solid medium by a circular hold is the simplest diffraction. Pao and Mao gave the analytical solution to this problem [10]. FLAC is used to analyze the diffraction of P wave by a circular hole and the numerical solution is compared to the analytical one.
Assume a planar harmonic P wave propagates along the x axis in the positive direction when a circular hole with the radius a is met. The circular hole affects the incident wave and the diffraction occurs around the circular hole. Pao and Mao [10] defines the dynamic stress concentration factor around the hole as the ratio of the hoop stress amplitude to the stress intensity of P wave in its propagation direction and is used to quantitatively describe the diffraction of incident wave by the circular hole. Eq. (1) gives the analytical solution to :
where is Poisson’s ratio of elastic medium, is an arithmetic operator which equals to 1 when 0 and 2 when n is nonnegative integer, is the imaginary unit, , is the angle coordinate in polar system and is given by Eq. (2):
where is the wave number of the incident P wave and can be described as , is the wave number of the scattered SV wave and can be described as , is the angular frequency of the incident P wave, is P wave speed in elastic medium and can be gained by , is S wave speed in elastic medium and can be gained by , , and denotes elastic modulus, shear modulus and density of elastic medium respectively and is the radius of the circular hole, is Hankel function of the first type with the order . Since is not independent of , is dependent on , and according to Eqs. (1) and (2).
Fig. 1Schematic diagram and numerical model of the diffraction of the wave by a circular hole
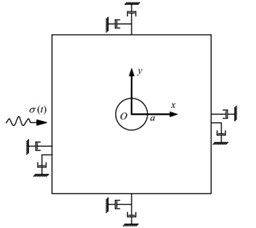
a) Schematic diagram
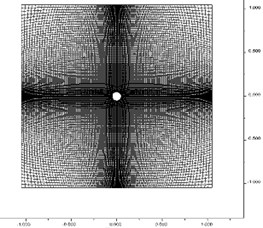
b) Numerical model
In the numerical analysis, assume the radius of the circular hole 3 m and the center of a circle is placed at the origin of coordinates. The truncated boundaries are located in the distance five times the radius of the hole. The stress history is applied along the left boundary of FLAC model which could simulated the incident planar harmonic P wave and at the same time viscous boundary condition are applied along all the four boundaries in both - and - directions which ensures the numerical computational accuracy. The schematic diagram and numerical model of the diffraction of the wave by the circular hole is shown in Fig. 1.
Assume the density of the elastic medium is 2850 kg/m3, the elastic modulus is 20 GPa and Poisson’s ratio equals to 0.2. When solving the problem, the stress tensor of the element at the crown of the circular hole is recorded. Through the stress history, the hoop stress amplitude can be gained. After dividing hoop stress amplitude by the stress intensity of the incident wave, we can get . Comparison of analytical solution with FLAC numerical solution about the relation between and dimensionless frequency can be shown in Table 1. It is revealed that FLAC numerical solution is very similar to analytical one, which demonstrates the feasibility of the explicit finite difference method to analyze the diffraction of the wave by the hole.
Table 1Comparison of analytical solution with FLAC numerical solution
(analytical solution) | (FLAC solution) | |
0.007 | 2.890 | 3.011 |
0.125 | 3.031 | 2.910 |
0.250 | 3.170 | 2.692 |
0.375 | 2.990 | 2.476 |
0.500 | 2.582 | 2.243 |
0.750 | 1.961 | 1.854 |
1.000 | 1.701 | 1.866 |
1.250 | 1.743 | 1.631 |
3. Numerical models of Xiluodu underground cavern groups
FLAC models of Xiluodu underground cavern groups is shown in Fig. 2. Main power house, transformer substation and tailwater surge chamber are laid out in parallel [11]. The truncated boundaries of the models are placed in the distance 300 m from the axis of the transformer substation in the direction of the span. The upper and lower boundaries are at the altitude of 630 m and 150 m respectively. The altitude of the crown of the main power house is 406.7 m. In FLAC model, the dimensions of 2D model are 600 m×480 m (× dimensions).
Fig. 2FLAC model of Xiluodu underground cavern groups
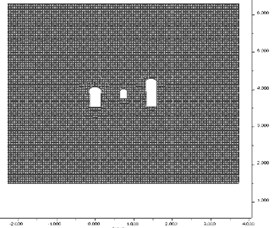
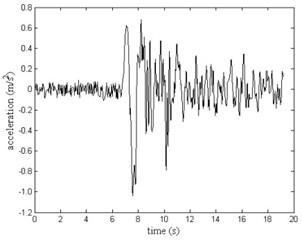
The article [11] reports that rock mass surrounding the underground cavern groups are intact and has high strength. Therefore, linear elastic constitutive relationship can be adopted to describe the rock mechanical behavior; dynamic property parameters can be conservatively adopted to be equal to those of static counterparts. Thus, the elastic modulus of rock mass is set to be 10 GPa, Poisson’s ratio is 0.25 and density is 2600 kg/m3. With the increase of the overburden depth and lateral pressure ratio tends to be 1, so vertical stress with linear increase along the altitude is assumed and is presumed to be 1. The shear seismic wave vibrating is horizontally applied along the bottom boundary. Seismic wave comes from acceleration history (Fig. 3) of Tangshan aftershock at the position of Tianjin hospital. The amplitude of seismic wave is 1.042 m/s2, which corresponds to the earthquake with the intensity of VII degree [12]. In the meantime, the viscous boundary condition is applied along the rest boundaries, which could avoid the outwards traveling waves coming back to the model.
Fig. 3Acceleration history of Tianjin hospital seismic wave arising from Tangshan aftershock
4. Numerical results
Maximum and minimum principal stress amplitude of surrounding rock mass can be gained by the numerical analysis and they are shown in Fig. 4. In the figures, stress with positive sign denotes tensile stress and that with negative sign denotes compressive stress. Fig. 4 reveals that the maximum tensile stress is 0.67 MPa and occurs at the foot of the left side wall where the element index is set to be No. 21r. According to the article [11], the tensile strength is 3.08 MPa which indicates there is no tensile damage when the underground cavern groups are subjected to the Tangshan aftershock.
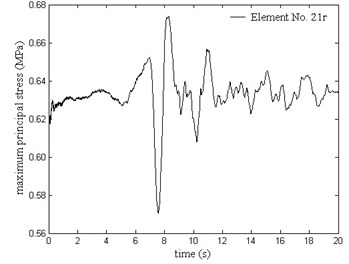
Maximum principal stress history of element No. 21r is shown is Fig. 5. We can see that the maximum principal stress fluctuates around 0.62 MPa within a small range of 0.57 MPa to 0.67 MPa which indicates that Tangshan aftershock has a little impact on the stress field.
Fig. 4Maximum and minimum principal stress amplitude under seismic loading
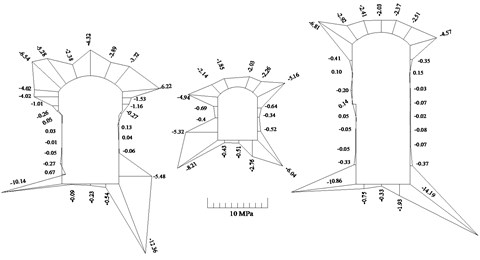
a) Maximum principal stress amplitude
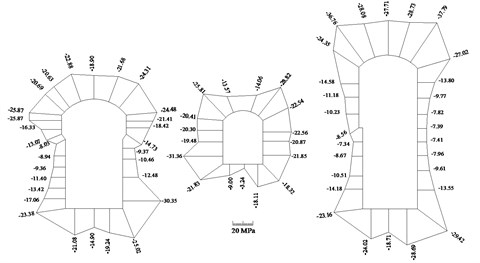
b) Minimum principal stress amplitude
- and -displacement components of gridpoints of the surrounding rock mass can be obtained through numerical analysis and displacement vectors amplitude can be gained subsequently (Fig. 6). We can see the displacement amplitude of the surrounding rock mass is within the range of 2.53 cm to 3.60 cm. The order of magnitude of the displacement demonstrates that the displacement of underground openings is not very large, and the surrounding rock still behaves elastically.
Fig. 5Maximum principal stress history of Element No. 21r
From Fig. 6, we know the maximum displacement of the underground openings under seismic loading is 3.60 cm and occurs at the floor of the main power house, where the gridpoint is numbered as No. 39ma. -displacement history of this gridpoint is shown in Fig. 7. It is revealed that gridpoint No. 39ma moves back and forth within a small range around the original position in the -direction.
Fig. 6Displacement vectors amplitude of surrounding rock mass under seismic loading
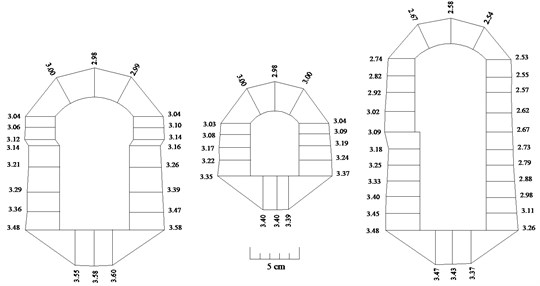
Fig. 7x-displacement history of gridpoint No. 39ma under seismic loading

5. Conclusions
The main conclusions of the study are drawn as follows:
1) FLAC is used as the analysis tool to study the diffraction of P wave by the circular hole and the feasibility of the explicit finite difference method to analyze the diffraction in the solid medium is verified by comparison of analytical solution with FLAC numerical solution, which provides the theoretical basis for the explicit finite difference method to analyze the seismic response of underground openings.
2) Numerical model in two dimensions of underground cavern groups of Xiluodu hydraulic power plant is generated and the seismic response of underground cavern groups is investigated. Maximum and minimum principal stress amplitude of surrounding rock mass gained by the numerical analysis indicates there is no tensile damage when the underground cavern groups are subjected to the Tangshan aftershock. Through numerical analysis, displacement vectors amplitude can be gained where the displacement amplitude of the surrounding rock mass is within the range of 2.53 cm to 3.60 cm, the order of magnitude of the displacement demonstrates that the displacement of underground openings is not very large, and the surrounding rock still behaves elastically. The results from the analysis can be for reference to similar hydraulic power plant design and construction.
References
-
Li J. K., Dai R., Jiang Y. M. Improvement of the generation of the initial stress field by using FLAC3D and application in a huge underground cavern group. Chinese Journal of Rock Mechanics and Engineering, Vol. 21, Issue 2, 2002, p. 2387-2392.
-
Dowding C. H., Rozen A. Damage to rock tunnels from earthquake shaking. Journal of Geotechnical and Geoenvironmental Engineering, Vol. 104, Issue 2, 1978, p. 175-191.
-
Sharma S., Judd R. J. Underground opening damage from earthquakes. Engineering Geology, Vol. 30, Issue 3, 1991, p. 263-276.
-
Wang R. M., Luo Q. F. Analysis on the damage to underground structure and tunnel in Kobe are caused by Hanshin earthquake. Journal of Catastrophology, Vol. 13, Issue 2, 1998, p. 63-66.
-
Du X. L., Li Y., Xu C. S., et al. Review on damage causes and disaster mechanism of Daikai subway station during 1995 Osaka-Kobe Earthquake. Chinese Journal of Geotechnical Engineering, Vol. 40, Issue 2, 2018, p. 223-236.
-
Chen G. X., Chen Du S. X. L., et al. Review of seismic damage, model test, available design and analysis methods of urban underground structures: retrospect and prospect. Journal of Disaster Prevention and Mitigation Engineering, Vol. 36, Issue 1, 2016, p. 1-23.
-
Ji Q. Q., Yang L. D. Seismic damage and restoration measures of subway. Journal of Catastrophology, Vol. 16, Issue 2, 2001, p. 31-36.
-
Hashash Y. M. A., Hook J. J., Schmidt B., et al. Seismic design and analysis of underground structures. Tunnelling and Underground Space Technology, Vol. 16, Issue 4, 2001, p. 247-293.
-
FLAC (Fast Lagrangian Analysis of Continua) User’s Guide. Version 5.0., Itasca Consulting Group, Inc., 2005.
-
Pao Y. H., Mao C. C. Diffraction of Elastic waves and Dynamic Stress Concentration. Crane, Russak and Company Inc, New York, U.S.A, 1972.
-
Engineering Geological Report of Xi Ludu Hydropower Plant. Chengdu Hydroelectric Investigation and Design Institute of SPC, Chengdu, 2001.
-
Hu Y. X. Earthquake Engineering. Earthquake Press, Beijing, 1988.
About this article

The study is supported by the Key Program of National Natural Science Foundation of China under Grant No. 51439008, National Natural Science Foundation of China under Grant No. 41572307, No. 51779248 and National Natural Science Funds for Distinguished Young Scholar of China under Grant No. 41525009.
