Abstract
As we all know, it is difficult to extract weak feature for early wear of connecting rod bearings under transient conditions. In order to solve the problem, a method of extracting wear features for connecting rod bearings based on variational modal decomposition (VMD) adaptive noise reduction and computational order tracking (COT) was proposed. Firstly, the vibration signals of internal combustion engine block under transient operating conditions were collected, and the signals were reordered to satisfy the order tracking condition. Then, interpolation and fitting techniques were used to map the signal from the time domain space to the angular domain space. Next, the VMD was used to decompose the angular domain signal into multiple modal components, and the autocorrelation function (ACF) was used to denoise the modal components adaptively. Finally, the signal was reconstructed to conduct COT analysis, and the wear features of connecting rod bearing were extracted by average COT spectrum. The simulation analysis and the simulation experiment of the connecting rod bearing fault show that the proposed method is effective, and the weak features for early wear of connecting rod bearing of internal combustion engine are extracted.
Highlights
- By pre-processing and reordering, the vibration signals can meet the requirements of order tracking in transient operating conditions of internal combustion engines.
- The complex multi-component signals of internal combustion engines can be effectively decomposed and reconstructed by the proposed method.
- By monitoring the energy change, the wear condition monitoring and fault diagnosis of connecting rod bearings in internal combustion engines can be realized.
1. Introduction
Connecting rod bearing is a key component of internal combustion engine, and it bears complex alternating load in operation. It has both the reciprocating motion of the piston and the excitation of crankshaft rotation. Poor working conditions lead to its rapid transformation from early slight wear to severe wear. Eventually, the performance of the internal combustion engine will decrease and the vibration will be very violent. Therefore, it is very important to monitor the wear condition of the connecting rod bearing and track the wear state of the bearing, which helps to ensure the safe operation of internal combustion engines and avoid major accidents and economic losses.
The research shows that the change of wear state of connecting rod bearing can be reflected by vibration of internal combustion engine block [1, 2]. The connecting rod bearing is located inside the engine and has good lubrication conditions. In addition, the early wear features are very weak, and the vibration signals collected are complex. Therefore, it is very difficult to monitor the wear state of connecting rod bearing under the condition of steady working condition.
In actual work, internal combustion engines often operate under transient conditions. Transient operating conditions provide a wide frequency range of vibration excitation, which can better establish the relationship between the wear state of connecting rod bearings and vibration signals. Therefore, the early wear phenomena which are not easy to show in the stable condition can be fully reflected in the transient condition [3].
However, the vibration signal is not only affected by bearing wear, but also by the speed change and transmission path. These modulation sources are often coupled with each other, which further increases the difficulty of signal analysis [4]. If the traditional Fast Fourier Transform (FFT) is adopted, it will inevitably lead to frequency aliasing.
Order Tracking (OT) is the most direct and effective method to deal with the fault diagnosis of variable speed operation condition [5]. The non stationary signals are converted to stationary signals by equal angle resampling. The reconstructed signal can satisfy the stability requirement of Fourier transform, which is advantageous to extract the feature components related to rotational speed.
In general, order tracking includes Hardware Order Tracking (HOT) and Computed Order Tracking. The hardware order tracking realizes the equal angle sampling for the vibration signal through the analog device [6]. The hardwares, such as angular encoder, tracking filter and tachometer, are very expensive and complex, which limits the range of application for HOT [7].
The Computed Order Tracking (COT) is a computational synthesis method. Firstly, the vibration signal and the key phase signal of the machine are collected synchronously by the equal time interval sampling mode. Then the equal angle sampling sequence in the angle domain is obtained by the polynomial or spline interpolation algorithm. Compared with traditional methods, COT is more flexible and has the same or better accuracy [8]. COT has been applied to the feature extraction and fault diagnosis of internal combustion engines [9-11]. COT can highlight the wear characteristics of connecting rod bearings under transient operating conditions of internal combustion engines, but it is very difficult to extract the weak features of early wear under strong noise. It is a good idea to use COT to process the denoised signal.
At present, wavelet transform (WT) can be used to denoise non-stationary signals, but it is difficult to choose the best threshold [13] and the best wavelet basis function [14] in WT denoising. Empirical mode decomposition (EMD) can also be used to denoise non-stationary signals [15]. However, EMD has some problems such as endpoint effect, modal aliasing and so on [16, 17].
Variational mode decomposition (VMD) is a new non-stationary signal processing method [18]. Through adaptive quasi-orthogonal signal decomposition, VMD decomposes the multi-component AM-FM signal into several single-component AM-FM signals, which solves the problem of mode aliasing caused by envelope error in EMD. At the same time, VMD is essentially Wiener filtering and has good noise robustness [19]. Therefore, in view of the difficulty in extracting the weak features of the early wear of the connecting rod bearings in internal combustion engines under transient operating conditions, a method of extracting the weak features of the early wear of the connecting rod bearings based on VMD and COT is proposed in this paper.
Firstly, a vibration sensor is installed on the engine block to collect the vibration signals of the engine block under transient operating conditions by means of constant frequency and equal time. Then, the vibration signals are reordered to satisfy the order tracking condition. The vibration signals are mapped from time domain space to angle domain space by polynomial interpolation and fitting technique. Next, the signal is decomposed into several modal components by VMD, and each modal component is computed by Auto-Correlation Function (ACF). The signal is reconstructed after removing random noise interference adaptively. Finally, the order tracking analysis is applied to the reconstructed signal, and the average order tracking spectrum is calculated to extract the signal features. In order to verify the scientificity of the proposed method, multi-component, time-varying, AM-FM simulation signals are established for analysis and verification. Furthermore, the proposed method is applied to extract the weak features of the early wear of EQ6100 internal combustion engine connecting rod bearings. The results show that the proposed method has obvious de-noising effect and can effectively extract the time-varying weak features of connecting rod bearing wear and realize state monitoring.
2. Signal reconstruction in corner region
When the internal combustion engine accelerates uniformly, the rotation angle and time satisfy the following relations:
where the phase , , and are undetermined coefficients; is the time point. For vibration signals, the sampling point of each vibration signal segment in a rotation period is related to the rotation angle. As long as each rotation period is sampled at a constant angle, the polynomial coefficients in the Eq. (1) can be solved by fitting the arrival time (, , ) of the three continuous equal angle sampling points:
where , and is the angle interval of the speed signal. Eq. (2) is calculated using MATLAB, and the corresponding time at each angle is obtained:
where is the corner position; is the corresponding time of the corner position. The mapping of isochronous signals to equal angle signals can be realized by interpolation.
3. Adaptive noise reduction method based on variational mode decomposition
3.1. Variational mode decomposition
VMD determines the center frequency and bandwidth of each intrinsic mode component (IMF) by iteratively searching the optimal solution of the variational model. The signal is adaptively decomposed into several IMFs [18]. In essence, VMD transforms the signal decomposition into the optimization problem with restricted conditions, and the optimal solution is the single component AM-FM signal decomposed by VMD. Assuming that each mode has a finite bandwidth with a central frequency, the constrained variational model with restricted conditions is as follows:
where is the modal component, is the central frequency for the modal component, is the unit pulse function, and * is the convolution symbol.
In the VMD algorithm, the secondary penalty factor and the Lagrangian multiplication operator are used. Then, the alternating direction method is introduced. , , and are constantly updated, so that the optimal solution of the variational constraint problem can be solved. The expression for the modal component is:
where is the penalty factor, and is the Lagrange multiplier.
The expression for the modal component in frequency domain is:
where is the center of the modal component power spectrum. The Wiener filter is introduced, which makes the VMD algorithm have better noise robustness.
Similarly, the expression for the central frequency is:
The stopping condition of the iteration is:
The VMD algorithm is a linear transformation, so the signal can be reconstructed. The reconstructed signal can be represented as:
where is the final modal component, after the iteration is stopped.
3.2. Autocorrelation function
Autocorrelation function is a statistical method in time domain, which describes the degree of correlation of random signals at two different times. The autocorrelation function of signal can be defined as follows:
where is the conjugate of ; is the observation time of signal ; is the time lag of signal.
Autocorrelation functions have special properties. Firstly, White noise is composed of a sequence of random variables in the time domain, and its autocorrelation function will decay rapidly with the increase of . When approaches infinity, the autocorrelation function tends to zero. Secondly, the autocorrelation function of periodic signal is still a periodic signal of the same frequency, whose amplitude is related to the amplitude of the original periodic signal, but the phase information of the original periodic signal is lost. Thirdly, the autocorrelation function of the modulated signal is still a modulated signal, and the modulation frequency and carrier frequency do not change.
The discrete expressions of autocorrelation functions is as follows:
where is the length of the sampling sequence, and is the sampling interval.
4. Proposed method
Before signal analysis, signals need to be preprocessed. Firstly, the vibration signal of internal combustion engine block is segmented according to the top-stop pulse, and each working cycle has a certain speed. Then the vibration signals are arranged according to rotation speed from small to large. If the vibration signal corresponding to the same rotational speed occurs, the first one is retained and the other redundant data are eliminated. Finally, the processed signal is rearranged according to the speed, which basically meets the requirement of resampling in the angle domain.
In VMD, the modal number must be determined first to avoid modal aliasing and noise separation from decomposed signals. If the value is too large, there will be over-decomposition, that is, signals of the same frequency or scale are decomposed into different modal components. On the contrary, insufficient decomposition will occur, and signals of different frequencies or scales will appear in the same modal component. In this paper, the method of observing center frequency is used to determine the value is 3.
Based on the VMD, the resampled signal in the diagonal domain is decomposed and the signal noise is attenuated. Then the autocorrelation function of each modal component is calculated to further attenuate noise, and the signal is reconstructed to get the signal after adaptive noise reduction. The combination of the two methods can give full play to their advantages and achieve good adaptive noise reduction.
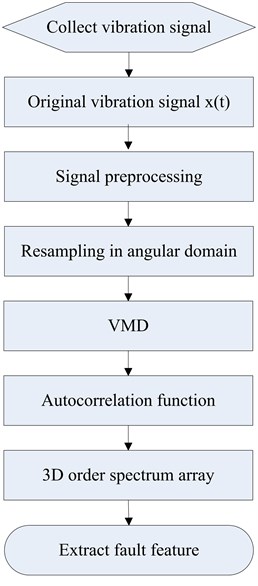
The denoising signal is processed by FFT, and the order amplitude spectrum is obtained. Because the vibration signals are collected under transient conditions, many segmented signals can form a three-dimensional order spectrum array composed of order, rotational speed and amplitude. The three-dimensional waterfall diagram of the order tracking spectrum can clearly reflect the relationship between the speed, order and amplitude. Therefore, it is easier to extract the weak fault characteristics related to internal combustion engine speed. The detailed experimental scheme is shown in Fig. 1.
Fig. 1Detailed experimental scheme
5. Experimental results
5.1. Simulation
According to the characteristics of internal combustion engine signal, a multi-component, non-stationary, and AM-FM simulation signal is established. The signal simulates the acceleration process of internal combustion engine from 600 r/min to 2400 r/min. At the same time, the signal contains the components of order 2, order 4 and order 6 related to the rotation frequency. The sampling frequency of the signal is 800 Hz, and the number of sampling points is 512. The expression of instantaneous frequency is as follows:
where is rotation speed. The simulation signal is composed of the following:
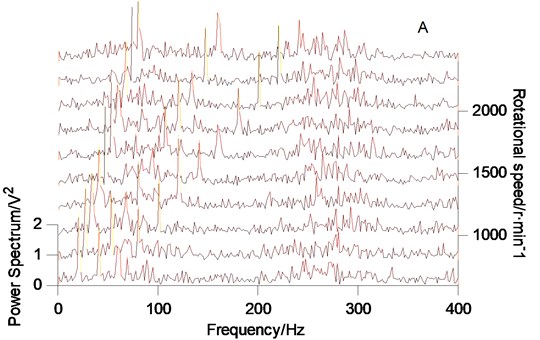
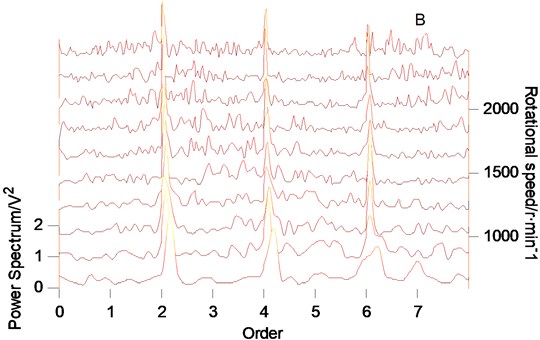
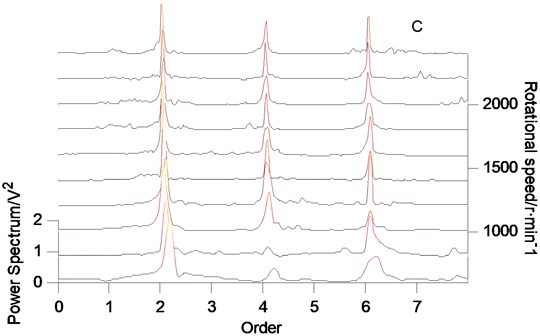
Fig. 2Simulation signal spectrum array
a)
b)
c)
According to the proposed method, the rotational speed spectrum of the original simulation signal, the order tracking spectrum after resampling and the order tracking spectrum after adaptive denoising are obtained respectively, as shown in Fig. 2. In Fig. 2(a), the signal components are very complex. It is difficult to distinguish the spectrum formation and change rules of signals. In Fig. 2(b), it is found that there are three main components in the signal: order 2, order 4 and order 6. But the background noise is very obvious. In Fig. 2(c), it is obvious that the three main order components of the signal are clearly displayed after VMD adaptive denoising. Therefore, the proposed method has strong ability of feature extraction and is very effective for extracting weak features.
5.2. The experimental setup
The structure of diesel engine is complex and the working environment is abominable. As a result, it is prone to malfunction. In this paper, vibration signals are collected from the vibration sensors on the experimental stand, as shown in Fig. 3. The basic parameters of the vibration sensor are shown in Table 1. The engine on the experimental stand is EQ6100 gasoline engine, and its parameters are shown in Table 2.
The fifth connecting rod bearings of EQ6100 gasoline engine are set with different clearance (0.05 mm, 0.20 mm, 0.30 mm) to simulate the normal, slight, moderate wear of the connecting rod bearing. Vibration signals are collected on the left side of the fifth main bearings on the surface of the engine block. The sampling frequency is 10000 Hz and the sampling points are 40960 points.
Fig. 3Measuring position of vibration sensor
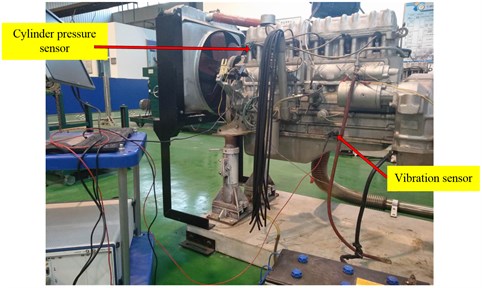
Table 1Vibration sensor parameters
Model | Sensitivity | Frequency range (±3 dB) | Range | Resolution | Temperature range | Weight | Output connect |
603C01 | 100 mV/g | 0.5-10 KHz | ±50 g | 350 μg | –54-121 °C | 51 g | Top |
Table 2Basic parameters of the engine
Engine type | EQ6100-1 | Fuel type | gasoline | Type | Inline 6 cylinders |
Rated power (KW) | 94 | Compression ratio | 7.0:1 | Ignition sequence | 153624 |
Rated speed (RPM) | 3000 | Continuous power (KW) | 72 | Maximum torque (N·m) | 353 |
Radius (mm) ×Distance (mm) | 102×115 | Maximum torque speed (r/min) | 1200-1600 | ||
Testing temperature is important when acquiring vibration signals. In the experiment, the temperature of cooling water is measured to reflect the internal temperature of gasoline engine. The temperature is controlled at 70-80 degrees C.
5.3. Data acquired
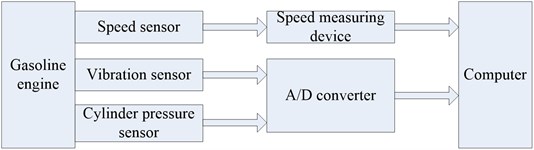
The acquisition system is composed of collector, computer, sensor and connecting circuit, as shown in Fig. 4.
Fig. 4Vibration signal acquisition system
In order to increase the impact excitation strength of connecting rod bearings, the throttle is randomly increased or decreased during the test, so that the internal combustion engine is in a transient state, as shown in Fig. 5.
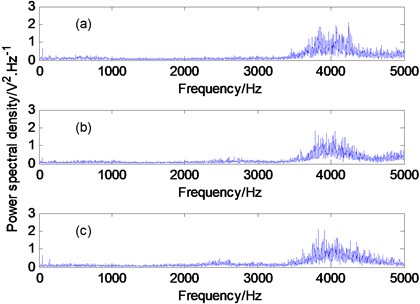
The time domain waveform of the acquisition signal is shown in Fig. 6, and the power spectral density is shown in Fig. 7.
Fig. 5Rotation speed of test condition: a) test rotation speed for normal wear; b) test rotation speed for clear wear; c) test rotation speed for moderate wear
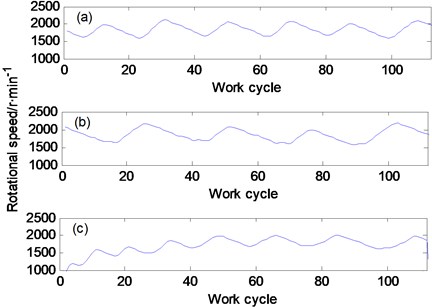
Fig. 6Vibration signal waveform: a) normal wear; b) clear wear; c) moderate wear
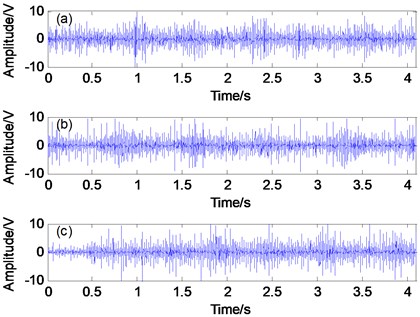
From Fig. 6 and Fig. 7, it can be seen that in the time domain waveform and power spectral density of the measured signal, it is impossible to distinguish the significant differences among the three wear states of connecting rod bearings in internal combustion engines. That is to say, it is difficult to extract the wear features of connecting rod bearings of internal combustion engines, especially the weak wear features in early stage, by means of traditional signal analysis method, although random transient excitation is applied to internal combustion engines.
Fig. 7Vibration signal spectrum: a) normal wear; b) clear wear; c) moderate wear
5.4. Experimental data processing
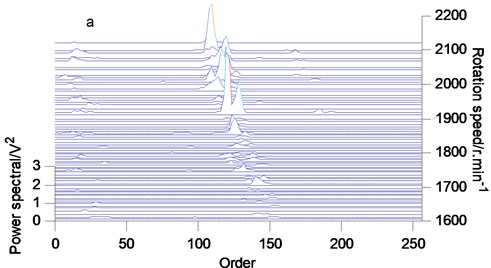
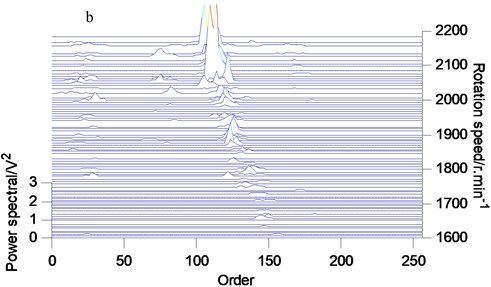
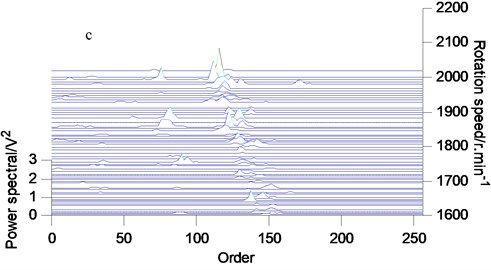
The vibration signals of three different clearances of connecting rod bearings are analyzed by the proposed method, and the order tracking spectrum after denoising is obtained, as shown in Fig. 8. When the connecting rod bearings wear slightly, the energy of the order 76-90 increases. At the same time, with the increase of the wear degree of the connecting rod bearing, the energy of this order range increases obviously, especially at high speed.
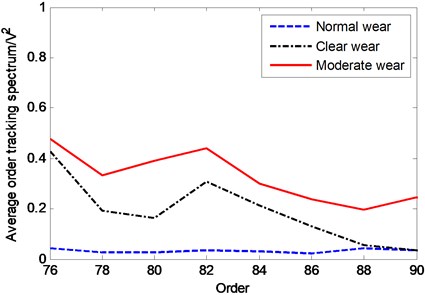
In order to find out in more detail the change of signal energy with the clearance of connecting rod bearing in the range of order 76-90, the mean value of order tracking spectrum is obtained along the direction of rotating speed axis, and the mean value of order 76-90 is extracted for local amplification analysis, as shown in Fig. 9. From Fig. 9, it can be clearly seen that the average energy of order tracking spectrum change in the range of order 76-90 is consistent with the change trend of wear clearance of connecting rod bearings. Therefore, for the internal combustion engine, the average energy in the range of order 76-90 can be used as the wear feature connecting rod bearing. By monitoring the energy change in the order range, the wear state of connecting rod bearings can be monitored and the fault diagnosis can be realized.
Fig. 8Order tracking spectrum of vibration signals: a) normal wear; b) clear wear; c) moderate wear
a)
b)
c)
Fig. 9Average order tracking spectrum of vibration signals
6. Conclusions
Aiming at the difficulty of extracting wear features of connecting rod bearings of internal combustion engines under transient conditions, a feature extraction method based on VMD adaptive noise reduction and COT was proposed. The simulation signal and fault feature extraction are studied. The conclusions are as follows:
1) By pre-processing and reordering, the vibration signals can meet the requirements of order tracking in transient operating conditions of internal combustion engines, and the feature components related to speed can be extracted.
2) The complex multi-component signals of internal combustion engines can be effectively decomposed and reconstructed by the proposed method. Combining with autocorrelation function, it has a good ability of adaptive noise elimination, which is conducive to extracting the early weak wear feature of internal combustion engine connecting rod bearings.
3) In order to monitor and diagnose the wear fault of connecting rod bearing by vibration signal of internal combustion engine block, the energy in the range of order 76~90 can be used as wear feature of connecting rod bearing of internal combustion engine. By monitoring the energy change, the wear condition monitoring and fault diagnosis of connecting rod bearings in internal combustion engines can be realized.
References
-
He Y. X., Shen S., Ying H. Q., et al. Application of wavelet packet decomposition and its energy spectrum on the fault diagnosis of reciprocation machinery. Journal of Vibration Engineering, Vol. 14, Issue 1, 2001, p. 72-75.
-
Ren J. C., Xiao Y. K., Zhang L. L., et al. Automatic extraction of image texture feature of diesel engine fault based on CWT time-frequency image and variable precision rough set theory. Chinese internal Combustion Engine Engineering, Vol. 36, Issue 3, 2015, p. 106-112.
-
Jia J. D., Fu L. F., Liu Z. G., et al. Engine condition monitoring based on order tracking estimate of the instantaneously changing work condition. Journal of Vibration Engineering, Vol. 18, Issue 3, 2005, p. 381-383.
-
Lin J., Zhao M. Dynamic signal analysis for speed-varying machinery: A review. Scientia Sinica, Vol. 45, Issue 7, 2015, p. 669.
-
Randall R. B., Antoni J. Rolling element bearing diagnostics – a tutorial. Mechanical Systems and Signal Processing, Vol. 25, Issue 2, 2011, p. 485-520.
-
Zhao M., Lin J., Wang X., et al. A tacho-less order tracking technique for large speed variations. Mechanical Systems and Signal Processing, Vol. 1, 2013, p. 76-90.
-
Fyfe K. R., Munck E. D. S. Analysis of computed order tracking. Mechanical Systems and Signal Processing, Vol. 11, Issue 2, 1997, p. 187-205.
-
Potter R. New order tracking method for rotating machine. Journal of Sound and Vibration, Vol. 24, 1990, p. 30-34.
-
Zhang L. L., Zeng R. L., Jia J. D., et al. Engine fault diagnosis based on work-cycle order tracking spectrum and fuzzy c-mean clustering. Automotive Engineering, Vol. 36, Issue 8, 2014, p. 1024-1028.
-
Jia J. D., Kong F. R., Wang J. P., et al. Order Analysis of internal combustion engine signal based on instantaneous frequency estimation. Chinese internal Combustion Engine Engineering, Vol. 26, Issue 3, 2005, p. 15-18.
-
Kong Q. P., Song K. C., Chen Y. Study of time-frequency order tracking of vibration signals in engine speed changing stage. Journal of Vibration Engineering, Vol. 18, Issue 4, 2005, p. 448-452.
-
Lin J., Qu L. S. Feature extraction based on Morlet wavelet and its application for mechanical fault diagnosis. Journal of Sound and Vibration, Vol. 234, Issue 1, 2000, p. 135-148.
-
Wu G. W., Wang C. M., Bao J. D., et al. A wavelet threshold de-noising algorithm based on adaptive threshold function. Journal of Electronics and Information Technology, Vol. 36, Issue 6, 2014, p. 1340-1347.
-
Zhang H., Chen X. H., Yang H. Y., et al. Optimistic wavelet basis selection in seismic signal noise elimination. OGP, Vol. 46, Issue 1, 2011, p. 70-75.
-
Li R., He D. Rotational machine health monitoring and fault detection using EMD-based acoustic emission feature quantification. IEEE Transactions on Instrumentation and Measurement, Vol. 61, Issue 4, 2012, p. 990-1001.
-
Rilling G., Flandrin P. One or two frequencies? The empirical mode decomposition answers. IEEE Press, Vol. 56, Issue 1, 2008, p. 85-95.
-
Deng Y., Wang W. C., Qian C. C., et al. Boundary-processing- technique in EMD method and Hilbert transform. Chinese Science Bulletin, Vol. 46, 2001, p. 954-960.
-
Dragomiretskiy K., Zosso D. Variational mode decomposition. IEEE Transactions on Signal Processing, Vol. 62, Issue 3, 2013, p. 531-544.
-
Liu Y., Yang G., Li M., et al. Variational mode decomposition denoising combined the detrended fluctuation analysis. Signal Processing, Vol. 125, 2016, p. 349-364.
About this article

This work was funded by Key Project of the Army Equipment Department (Grant No. WG2015JJ010008).
We would like to thank Editage (www.editage.com) for English language editing.
