Abstract
The prestressed concrete cable-stayed truss T- frame bridge is a novel type and complex structure. Truss damage is a common form of distress in this type of bridge. For studying the mechanical properties of truss members under the condition of the truss rod, a finite element model is established for analyzing the damage or failure of the truss rod. The effects on the deflection and frequency are compared and analyzed under the condition of damage or failure of the truss rod. The results show that the damage of the truss members has a significant effect on the deflection and frequency of the main beam. The damage of the upper chord affects the deflection of the entire T-beam, and the damage scope of the web member is limited to the abdominal area. The relationship between the damage of the truss members and the deflection of the main beam is nonlinear. Damage to truss members results in a reduction in fundamental frequency. Whole bridge truss damage has a more significant effect on frequency. Upper chord damage has a more significant effect on frequency than web members.
Highlights
- A finite element model was established for analyzing the failure of the truss rod.
- The effects on the deflection and frequency of the truss rod were analyzed.
- The effects of curvature mode were provided under different truss rod failure.
1. Introduction
Prestressed concrete cable-stayed truss T-frame bridge is a novel structure with the characteristics of cable-stayed bridges, continuous beam bridges (continuous rigid frame bridges), and truss bridges. It also overcomes the disadvantages of the three types of bridges [1-3]. For example, the cable corrosion problem encountered by cable-stayed bridges is avoided, and the structural stiffness of bridges is improved with low cost and beautiful appearance [2]. The tweed truss T structure is composed of the triangular truss T structure system, including truss, beam, prestress system, bridge pier, and the vertical bending stiffness of this structure is higher than the lateral bending stiffness. When the prestressed concrete cable-stayed truss T-frame bridge deck is under vertical load, the truss mainly bears the axial force, and the upper chord is similar to cable-stayed. The web member is similar to other truss structures in different pressure positions, and the lower chord is the main beam which bears pressure and a specific bending moment. The beams between truss pieces mainly enhance the lateral connection between truss sheets and are subject to the static and dynamic loads of the bridge panel. The use of reinforced concrete truss members in Switzerland and Japan instead of stay cables to overcome the disadvantages of cables, such as fatigue, corrosion, and low stiffness has led to the emergence of concrete truss bridges. Typical concrete truss bridges that have been completed and operated include the Gantt Bridge in Switzerland, the Natori River Bridge in Japan, the Ogawa Bridge in Japan, the Port Bridge in China, and the Shuofang Bridge in China. Prestressed concrete cable-stayed truss T-frame bridges account for a small proportion of the total number of bridges, and the research is not mature [4].
For the research of prestressed concrete cable-stayed truss T-frame bridges, some research work has been carried out. Xia Yongming introduced the force characteristics and economics of three systems of cable-stayed trusses [5]. Wang Da took the Kaziwan Bridge in Zigui County, Yichang City as the research object, and used the finite element program to analyze the shrinkage and creep, temperature stress, dynamic characteristics, and stability of prestressed cable-stayed truss bridges [6]. Jin Wencheng took Xiaoxi Tower Bridge as an example through monitoring its deformation, stress, and other mechanical parameters, and proposed effective construction control measures, which provided a reference for the construction of prestressed concrete cable-stayed truss bridges [7]. Tang Xiang, based his studies on the finite element method, bridge measurement technology, and structural modal analysis as the theoretical basis, and studied the structural modeling, static and dynamic characteristics of prestressed cable-stayed down-through truss bridges [8]. The reliability of the three-dimensional finite element model was verified, and the effects of the articulation effect between the hollow slabs on the bridge deck, the transverse connection beams, and the stiffness of the pier on the dynamic characteristics of the structure were obtained. Du Fei regarded the Xiaoxi Tower Bridge as a background to simulate the construction process of the bridge, and analyzed the effects of prestressing, truss weight, concrete shrinkage and creep, and temperature on the deflection, stress, and stiffness of the cable-stayed truss bridge [9]. The layout of elevation observation points, analysis of observation error, stress, and temperature control were introduced. Chen Ke analyzed the stress characteristics of prestressed concrete cable-stayed truss bridges and took Hongtang Bridge as an example to conduct a mechanical analysis of the main force-bearing members of cable-stayed truss T-frames. The sensitivity analysis was carried out, the sensitivity ranking was obtained, and the reinforcement scheme was compiled [4]. Xie Wei focused on the T-frame of prestressed concrete truss articulated in the mid-span, studied the influence of the articulated structure on the bridge and the force characteristics, and proposed an improvement scheme for the shear hinge structure [10]. Liu Ai-Rong [11] investigated the spatial variability effects of ground motion on the seismic response of the long-span continuous rigid-frame arch bridge. Linzell D. G. [12] created simply-supported bridge finite element models, and examined the influence of curved, steel, I-girder bridge configuration on girder end reactions and cross-frame member forces during seismic events. The seismic response of more than 2600 bridges was studied in [13] to determine the effects of different design and modeling parameters, including the effects of different column heights, column diameters, and superstructure mass as well as different abutment stiffness. He Xuhui [14] reported that the inside oblique angle influences the dynamic characteristics and the seismic response of the arch bridge under the combined longitudinal and vertical seismic excitation and under the combined lateral and vertical seismic excitation.
In summary, prestressed concrete cable-stayed truss T-type bridges are an intricate structure and a new type of bridge. The damage to truss members is a common form of distress in this type of bridge. The research on prestressed concrete cable-stayed truss bridges is mainly focused on detection and condition assessment, mechanical characteristics and construction control, influences of shear hinges and mechanical analysis, distress mechanisms, and maintenance reinforcement [15]. However, the research on the static and dynamic responses of truss members that are damaged or fail to be replaced in time is relatively scarce. The damage is a common form of distress in bridge structures. Furthermore, this type of bridge is more complicated than ordinary trusses. When subjected to the static and dynamic effects of the environment, the truss members are often prone to failure of a single member or multiple members, which seriously affects the safety and service life of such bridges [16-19]. For studying the mechanical properties of truss members under the condition of damage, one prestressed concrete cable-stayed truss T-frame bridge was used as the background. The finite element model was established in different conditions of truss member damage. The influence of the bridge on the deflection and frequency of the structure in the damaged state provided a reference for the health diagnosis of such bridges.
2. Prestressed concrete cable-stayed truss T-frame bridge model
2.1. Introduction to bridge
A prestressed concrete cable-stayed truss T-frame bridge has a span of 60 m + 120 m + 60 m, and the side spans and side piers are compacted bearings. The lower part of the bridge pier is a prestressed concrete V-limb hollow pier, the upper part of the V-limb is consolidated with a triangular truss, and the lower part is consolidated with a reinforced concrete hollow pier. The T-frame of the cable-stayed truss consists of a cable-stayed truss and a -shaped pier. The upper structure of the bridge is C55 concrete, the piers are C50 concrete, the shaft of the piers are C40 concrete, and the pavement of the bridge is C30 concrete. The standard strength of the prestressed steel bundle is 1860 MPa.
2.2. Prestressed concrete cable-stayed truss T-frame bridge FEM model
The finite element software Midas Civil is used to build the whole bridge model. The position of the side pier is a general support constraint, and the bottom of the pier is consolidated, considering its own weight and prestressed load. The whole bridge finite element model is shown in Fig. 1.
Fig. 1Finite element model diagram
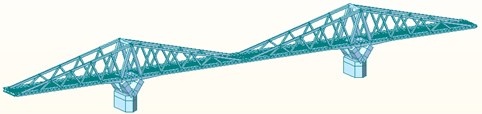
Fig. 2Truss node numbering diagram
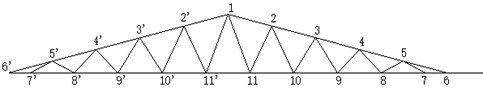
For facilitating the description of the position of the members, the nodes are numbered, and the number of the members is represented by nodes. For example, members 1-2 represent the members composed of nodes 1 and 2.
3. Influence of damage on the static structural force
3.1. Influence of truss member damage on the structural deflection
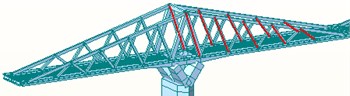
The influence of truss member damage on static structural force is mainly reflected in displacement. The damage condition of the truss shown in Fig. 2 was selected as the research object. For the convenience of description, the cable stay members are grouped. Structure group 1 is rod 1-11 + rod 2-10 + rod 3-9 + rod 4-8 + rod 5-7, and structure group 2 is rod 1-11 '+ Pole 2'-10 '+ Pole 3'-9' + Pole 4'-8 '+ Pole 5'-7', Structure group 3 is Pole 1-2 + Pole 2-3 + Pole 3-4 + Pole 4- 5 + poles 5-6, structural group 4 is rods 1-2 '+ rods 2'-3' + rods 3'-4 '+ rods 4'-5' + rods 5'-6 '. The axis is symmetrical, and the structural group also includes a truss in a symmetrical position. For example, the spatial distribution of the members of the structural group 1 is shown in Fig. 3. The damage of the structure is simulated by changing the elastic modulus of the structural material. The static performance of the structural members under the damage of 0 % (undamaged), 30 %, 50 %, and 80 % was simulated. The vertical displacement of the main beam under damage was taken as the result to analyze.
Fig. 3Diagram of the spatial distribution of rod in structural Group 1
It can be seen from Fig. 4 that the deflection of the mid-span web structure group 1 is different under different degrees of damage. The damage of the member has a more significant impact on the mid-span beam near the member. It has less influence on the side span. At 80 % damage, the deflection of the main beam is significantly different from other damage values. At junction 7, where the truss and beam meet, the difference in deflection can reach 13.48 mm, which is an increase of 35 % compared to that without damage.
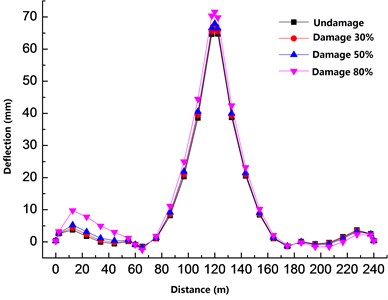
It can be seen from Fig. 5 that the deflection of the side span web structure group 2 is different under different degrees of damage. The damage of the member also has a more significant impact on the side span beam near the member and less influence on the side span. The difference between the deflection at 80 % of the member damage and the deflection under the other three conditions are apparent. At the junction 8 'of the truss and beam, the deflection difference can reach 6.02 mm, and at the junction 8' of the truss and beam, the deflection is similar. It is an increase of 87 % compared with the non-damaged, but the maximum deflection change of the remaining nodes is only 10 %.
Fig. 4Vertical displacement of main beam under damage of structural Group 1
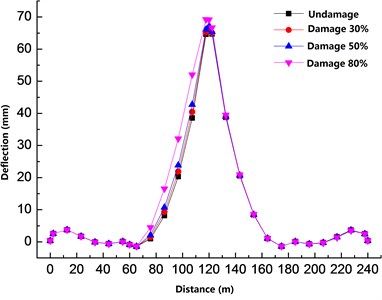
Fig. 5Vertical displacement of main beam under damage of structural Group 2
It can be seen from Fig. 6 that the deflection of the mid-span upper chord plate structure group 3 under different degrees of damage is visible. The damage of the member has a more significant impact on the mid-span beam, and the impact on the right-span beam is more significant than the left-span. The deflection under 80 % of the damage of the member is at the joint 6 where the truss and the beam meet. Compared with the undamaged deflection, the deflection difference reaches 45.49 mm, which is an increase of 70 % compared with the undamaged.
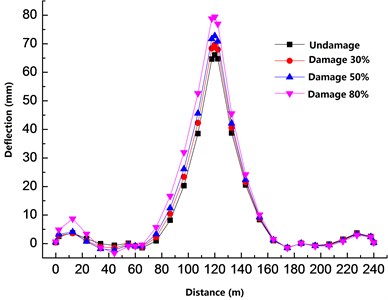
It can be seen from Fig. 7 that the deflection of the left-span upper chord plate structure group 4 under different degrees of damage is apparent. The damage of the member has a more significant impact on the left T-beam, where the damaged member is located. However, the impact on the right T-beam is relatively small. The deflection under 80 % of the damage of the member is at the joint 6 where the truss and the beam meet. The deflection difference reaches 14.19 mm, which is an increase of 37 % compared with the undamaged.
It can be seen from the analysis of Figs. 4 to 7 that the damage of the truss members has a more significant effect on the deflection of the main beam near the damaged truss. The damage of the upper chord has a more significant effect on the beam deflection than the damage of the web members. The damage of the upper chord affects the deflection of the entire T-beam, and the damage scope of the web is limited to the primary beam corresponding to the vertical web. The deflection of the beam is more sensitive to the damage of the upper chord. In the case of 30 % damage to the upper chord, the deflection of the main beam has changed significantly. When the web is damaged by 30 %, the deflection and undamaged changes are not significant. As the damage increases, the deflection of the main beam increases non-linearly.
Fig. 6Vertical displacement of main beam under damage of structural Group 3
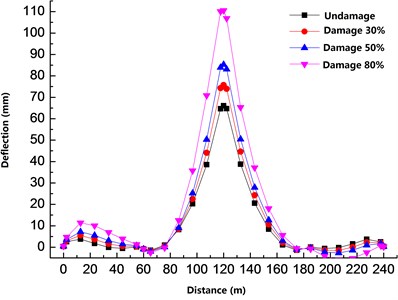
Fig. 7Vertical displacement of main beam under damage of structural Group 4
3.2. Effect of truss member failure on the structural deflection
When the damage deteriorates the truss members, the disaster of failure is prone to occur. It threatens the safety of the bridge structure. By simulating the failure of the rods at different positions, the graph is plotted in Fig. 8 to study the deflection of the rods at different positions.
Fig. 8Vertical displacement of the main beam under truss failure
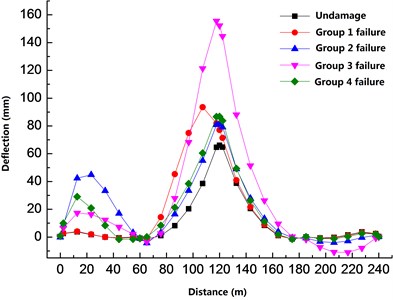
It can be seen from Fig. 8 that the deflection of the main beam changes to different degrees when the truss member fails. The failure of structural group 1 to structural group 4 all causes the increase of the deflection of the main beam. The deflection change of the structural group 3 under the failure of the members is greater than that of other structural groups when it fails. At junction 6 of the truss and beam, the deflection difference can reach 90.97 mm, and the deflection difference has increased by 140 % compared to undamaged. Similar to the damage situation, the effect of the failure of the upper chord on the deflection of the beam is significantly greater than that of the web.
4. Effect of damage on dynamic structural performance
4.1. Effect of damage on frequency
The sensitivity of damage to the dynamic performance of the structure is relatively high. Structural damage identification based on modal analysis is one of the main methods of bridge structure damage identification. In order to study the effect of structural damage on the dynamics of the structure, the following typical working conditions are studied: case 1, no damage; case 2, 20 % damage to the whole bridge truss; case 3, structural group 1 damage 50 %; case 4, structural group 2 damage 50 %; case 5 structural group 3 damage 50 %; case 6 structural group 4 damage 50 %. The list of bridge frequencies under different damage is shown in Table 1.
Table 1Frequency of bridges under different injuries
Modal number | Frequency | |||||
Case 1 | Case 2 | Case 3 | Case 4 | Case 5 | Case 6 | |
1 | 1.305 | 1.298 | 1.305 | 1.301 | 1.304 | 1.305 |
2 | 1.446 | 1.424 | 1.445 | 1.439 | 1.436 | 1.438 |
3 | 1.624 | 1.536 | 1.592 | 1.613 | 1.568 | 1.579 |
4 | 1.750 | 1.601 | 1.635 | 1.660 | 1.717 | 1.741 |
5 | 1.812 | 1.638 | 1.783 | 1.781 | 1.798 | 1.799 |
It can be seen from Table 1 that the frequency of truss members under different damage is different from that under undamaged. The whole bridge truss damage has a more significant impact on the frequency, and the frequency at 20 % damage is significantly less than the frequency at 50 % damage of some trusses. The impact of the upper chord damage on the frequency is higher than that of the web. Chord damage results in the reduction of the fundamental frequency.
4.2. Effect of damage on earthquake response
In this study, the El Centro wave is selected as the base input seismic wave for analysis. The components of the El Centro wave along the longitudinal, transversal, and vertical direction of the bridge are shown in Fig. 9. Based on the two aspects of displacement and force, the seismic response of different structure groups under different damage levels is analyzed.
Fig. 9Acceleration time-history of El Centro ground motion
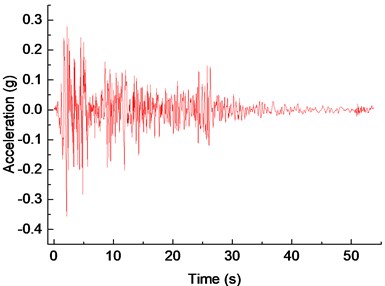
a) Longitudinal
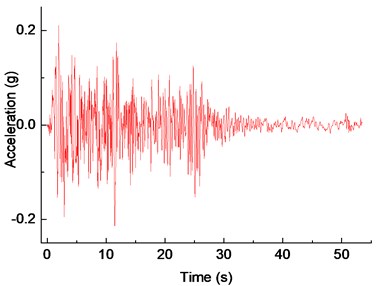
b) Transversal
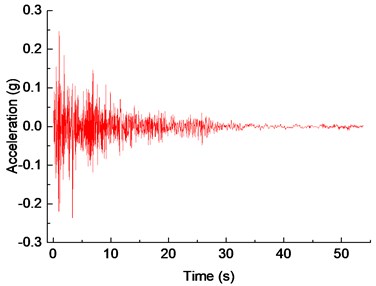
c) Vertical
4.2.1. Effect of damage on displacement
The top of the truss and the mid-span of the main beam with relatively large displacement amplitude is the typical position. Thus, the longitudinal and transversal displacement of the top of the truss and the vertical displacement of the mid-span of the main beam is selected to investigate the time history curve without damage and the displacement peak law under different damage conditions.
Fig. 10Time-history displacement
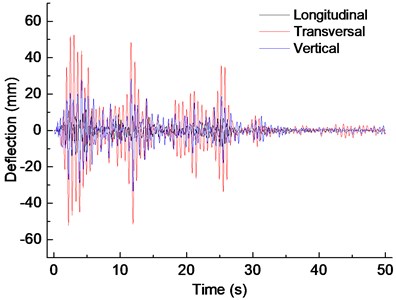
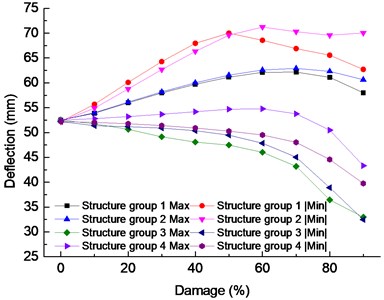
Fig. 11Transversal displacement amplitude of truss top under damage
In Fig. 10 the longitudinal displacement amplitude value of the truss top is 14.13 mm at 2.71 s, and the transversal of it is 52.49 mm at 3.02 s. Therefore, for this type of bridge, the lateral swing is more significant under the seismic effect. The vertical displacement amplitude value of the mid-span is 33.42 mm at 11.95 s. The transversal displacement amplitude value is significantly higher than the longitudinal and vertical of that.
Fig. 11 contains two direction’s displacement; Max denotes the maximum displacement aimed at the side of the bridge deck, and |Min| represents the absolute value of the minimum displacement, namely the maximum lateral displacement aimed at the outside of the bridge deck. From the Fig. 10, it can be seen that the change of transversal displacement amplitude of the truss top with the degree of damage, and at the same degree of damage, the Max and the |Min| is different. If the structure group 1 is damaged, the |Min| is higher than the Max, the |Min| has the largest of 69.99 mm at damage 50 %, the displacement increases by 34.05 %, compared with no damage, and in the |Min| peak position, the curve has a slightly protuberant, the Max value is relatively small, but the curve is relatively smooth. When the damage reaches 70 %, the Max displacement value was 62.16 mm as a maximum, and the displacement increased by 18.42 % compared with the undamaged. If the structure group 2 is damaged, the |Min| is higher than the Max, When the damage reaches 60 %, |Min| has the largest of 71.22 mm, the displacement increases by 36.41 %, compared with the undamaged, and in the |Min| peak position, the curve has a slightly protuberant. The Max value is relatively small, but the curve is relatively smooth, the changing curve is close to that of structure group 1 when the damage reaches 70 %, the Max is the largest of 62.92 mm, the displacement value increases 19.87 % compared with the undamaged. If the structure group 3 is damaged, the |Min| and the Max is relatively close, the most significant difference is only 2.45 mm when the damage reaches 90 %, the |Min| has the least of 32.49 mm, displacement decreases by 37.79 %, compared with the undamaged, and the smoothness of the curve is poor. When the damage reaches 90 %, the displacement value of Max has the least of 32.99 mm, compared with the undamaged, the displacement reduced 37.16 %. When the structure group 3 is damaged, the Max is higher than the |Min|, the Max increased firstly and decreased to less than the undamaged. Secondly, when the damage reaches 60 %, the Max has the largest of 54.77 mm, compared with the undamaged, the displacement increases only 4.35 %, and the smoothness of the curve is fine, the |Min| decreases with the increase of damage, when the damage reaches 90 %, the displacement value of |Min| has the smallest of 39.76 mm, compared with the undamaged, the displacement decreases by 23.84 %.
According to the analysis, the transverse displacement of the truss top is sensitive to the damage of these structure groups. When the damage of structure groups 1 and 2 is small, the displacement shows sensitivity, and when the damage of structure groups 3 and 4 is significant, the displacement change can be shown. The damage of structure group 2 is the most unfavorable to the displacement change of truss. The relation between damage degree and displacement is nonlinear.
Fig. 12Vertical displacement amplitude of truss top under damage
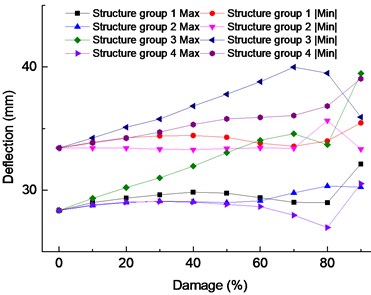
Fig. 12 includes two directions along with the vertical displacement, the Max represents the maximum of hogging, the |Min| denotes the maximum of down warping. When structure group 2 is damaged, the changing trend of the Max and the |Min| almost parallels, the maximum of Max appears on the damage of 90 % as 32.13 mm, displacement increases 13.29 %, compared with the undamaged. With the damage of 90 %, the largest |Min| is 35.46 mm, displacement increased by 6.10 % compared with the undamaged. When the structure group 2 is damaged, the maximum of Max appeared on the damage 80 % as 33.34 mm, displacement increased by 17.56 %, compared with the undamaged. With the damage of 80%, the largest |Min| is 35.65 mm, compared with the undamaged, displacement increased by 6.67 %. When the structure group 3 is damaged, the maximum of Max appeared on the damage 90 % as 39.48 mm, displacement increased by 39.21 %, compared with the undamaged. With the damage of 70 %, the |Min| has the largest of 39.98 mm, compared with the undamaged, displacement increased by 19.63 %. When the structure group 4 is damaged, the maximum value of Max is 30.53 mm. The displacement increased by 7.65 % compared with the undamaged. However, when the damage is 90 %, the maximum value of |Min| is 39.04 mm. The displacement increased by 16.82 % compared with the undamaged.
It can be seen from the analysis that the mid-span down warping amplitude caused by the earthquake is generally more significant than the up-warping amplitude, among which the down warping value caused by damage of structural group 3 is the largest.
4.2.2. Effect of damage on internal force
The bending (torsional) moment and shear time-history curves of the bottom position of the bridge pier without damage and the displacement peak law under different damage conditions are analyzed.
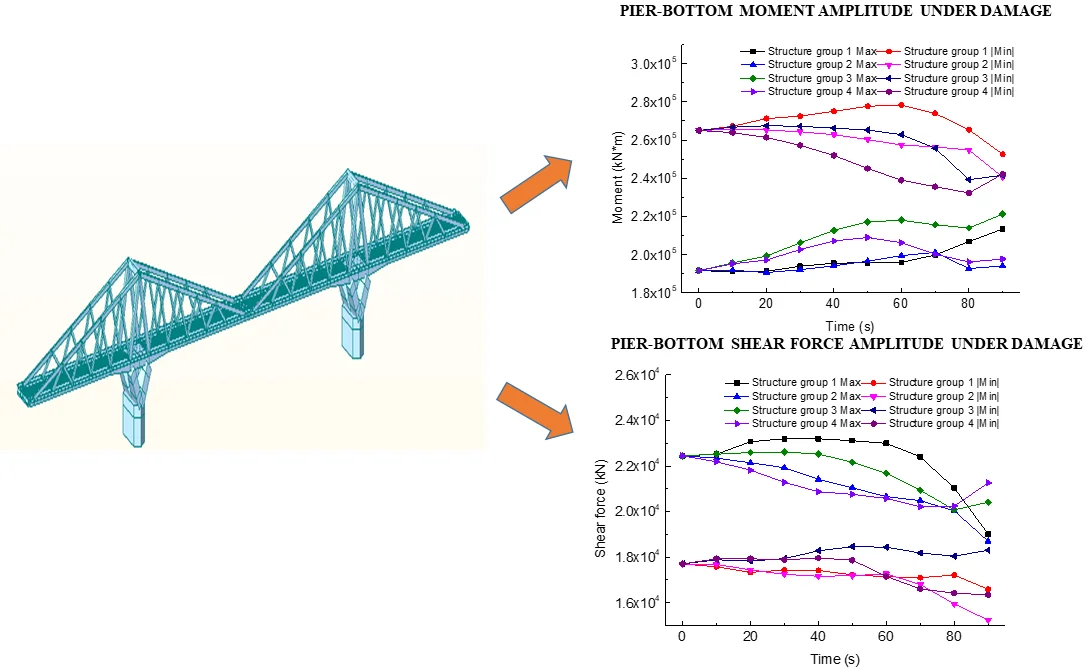
In Fig. 13 the torque amplitude at the bottom of the pier is 115386.9 kN∙m at 12.12 s; the longitudinal bending moment is 214683.5 kN∙m at 11.62 s; the transversal bending moment is 265054.9 kN∙m at 2.70 s. It can be seen that the largest bending moment amplitude caused by the earthquake is the transversal one.
In Fig. 14 the longitudinal shear amplitude of the pier bottom is 22452.59 kN at 4.98 s; the transversal shear amplitude is 11294.2 kN at 11.61 s. It can be seen that the longitudinal shear amplitude of the pier bottom caused by the earthquake is the largest.
Fig. 13Pier-bottom moment
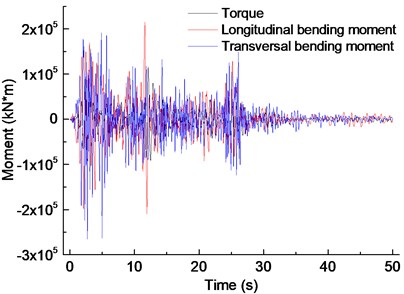
Fig. 14Pier-bottom shear
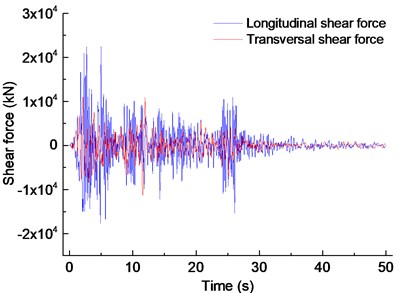
Fig. 15 shows the relationship between the transversal bending moment and the damage degree, this Fig. 15 contains two opposite directions of the bending moment. The Max represents the maximum bending moment forcing the pier bend to the middle span, and the |Min| represents the maximum bending moment forcing the pier bend to the side span. When the structure group 1 is damaged, the bending moment |Min| increases firstly, decreases to less than the undamaged bending moment, when the damage reaches 60 %, |Min| has the largest of 278361.6 kN m, it increases by 5.02 % compared with the undamaged. The bending moment value of Max is relatively small and slowly rise along with the change of damage degree. When the damage reaches 90 %, Max has a maximum value of 213494.1 kN m. Compared with no damage, the bending moment increases by 11.37 %. When the structure group 2 is damaged, the bending moment |Min| decreases, as the damage reaches 90 %, the |Min| has a minimum of 240668.9 kN m, the bending moment decreases by 9.20 %, compared with the undamaged. The Max bending moment value is relatively small, but slowly rising along with the change of damage degree, as the damage reaches 70 %, the bending moment Max has a maximum value of 201257.7 kN m, compared with the undamaged, the bending moment increases by 4.99 %. When structure group 3 is damaged, the bending moment |Min| first rises and then falls, as the damage reaches 20 %, the |Min| has the largest of 267533.4 kN m, compared with the undamaged, it increases by 0.94 %. The bending moment Maximum is relatively small in the beginning and is slowly rising with the change of damage, as the damage reaches 90 %, the bending moment Max has a maximum value of 221322.1 kN m, compared with the undamaged, the bending moment increases by 15.46%. When the structure group 4 is damaged, the bending moment |Min| falls firstly and rising follows, as the damage reaches 80 %, the |Min| has a minimum of 232364.1 kN m, compared with the undamaged, the bending moment decreases by 12.33 %. The bending moment maximum is relatively small and increases slowly with the degree of damage, and then decreases, as the damage reaches 50 %, the bending moment Max has a maximum of 209077.00 kN∙m, and the bending moment increases by 9.07 % compared with the undamaged.
Based on the above analysis, it is found that the bending moment amplitude, which forces the pier bend to the side span caused by the structure group’s damage, is more significant than that forcing the pier bend to the middle span. The damage of the structure group 1 is the most unfavorable to the bending moment response of the earthquake. However, not all the structure groups' damages lead to an increase in the bending moment response.
Fig. 15Pier-bottom moment amplitude under damage
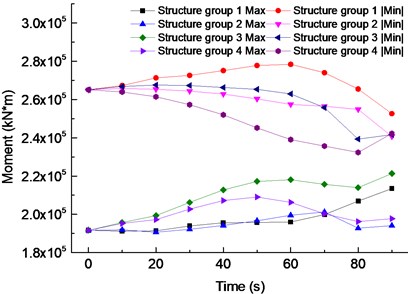
Fig. 16Pier-bottom shear force amplitude under damage
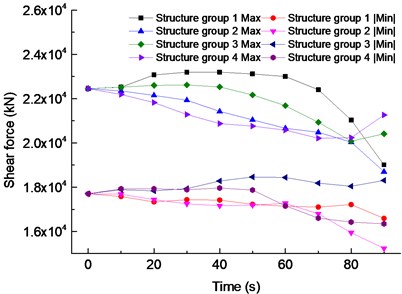
Fig. 16 shows the relationship between the shear force value of the pier bottom longitudinal and the bridge and the degree of damage. It contains two opposite direction shear force, Max represents the maximum shear force of the pier bottom toward the middle span, the |Min| represents that toward the side span. When the structure group 1 is damaged, shear Max first increases. Then it decreases to less than the undamaged shear value. As the damage reaches 40 %, the Max has the largest of 23197.59 kN, and shear force increased by 3.32 % compared with the undamaged. The shear force value |Min| is relatively small, slowly reducing with the change of damage degree. As the damage reaches 90 %, the shear force value |Min| has a minimum of 16590.81 kN, compared with the undamaged, shear force reduces 6.29 %. When the structure group 2 is damaged, the shear force Max reduced to less than the undamaged. As the damage reaches 90 %, the Max has a minimum of 18697.33 kN, compared with the undamaged, shear force reduced by 16.72 %. The shear force value |Min| reduces slowly with the change of damage degree, as the damage reaches 90 %, the shear force value |Min| has a minimum of 15235.8 kN, compared with the undamaged, shear force reduces 13.94 %. When the structure group 3 is damaged, shear force Max increases at first. Then it decreases to less than the undamaged, as the damage reaches 30 %, the Max has the largest of 22618.92 kN, shear force increased by 0.74 %, compared with the undamaged. The shear force value |Min| is relatively small, it rises firstly and falls secondly with the change of damage degree, as the damage reaches 50 %, the shear force value | Min | has the largest of 18461.55 kN, compared with the undamaged, shear reduces 4.28 %. When the structure group 4 is damaged, the shear Max at first is down slowly, as the damage comes to 80 %, an inflection point appears, the Max has a minimum of 20239.06 kN, the shear force reduces 9.98 %, compared with the undamaged. The shear value |Min| decreased slowly with the change of the degree of damage, when the damage reaches 90 %, the shear value |Min| is the smallest, which is 16346.28 kN, compared with the undamaged, the shear value decreased by 7.67 %.
The previous analysis found that the shear force amplitude of the pier bottom toward the middle span caused by the structural group's damage is more significant than that of the side-span. The damage of the structure group 1 is the most unfavorable to the shear response of the earthquake, and not all the structure groups' damage leads to the shear response increase.
5. Conclusions
In order to study the mechanical properties of truss members under the condition of damage, a prestressed concrete cable-stayed truss T-frame bridge was used as the background, and a finite element model was established in different damage conditions of truss members. The influence of the bridge on the deflection and frequency of the structure was studied. The conclusions are drawn as follows:
1) For prestressed concrete cable-stayed truss T-frame bridges, the truss members' damage has a significant effect on the deflection and frequency of the main beam.
2) The damage of the upper chord on the deflection of the beam is significantly more serious than the damage of the web. The damage of the upper chord affects the deflection of the entire T-beam. The impact of the web damage is limited to the primary beam corresponding to the vertical web. The relationship between the damage increase and the deflection of the main beam is nonlinear. Damage and failure of trusses have similar rules.
3) The frequency of truss members is different under different damage. Whole bridge truss damage has a more significant impact on frequency, and the impact of upper chord damage on frequency is higher than that of web members. Structural damage causes structural frequency reduction.
4) Under the three-dimensional action of wave El Centro seismic wave, the relationship between the damage degree of the structure group and the change of displacement or internal force is nonlinear. In terms of displacement, the displacement amplitude of the truss top to the transverse bridge is more significant than that to the longitudinal bridge, the damage of structure group 2 is the most unfavorable to the displacement change of truss, the down warping value caused by damage of structural group 3 is the largest. In terms of internal force, the largest internal force caused by the earthquake are the transversal bending moment amplitude forcing the pier bend to the longitudinal shear force value. The damage of the structure group 1 is the most unfavorable to the bending moment. The shear force response of pier bottom for the earthquake and not all the structure groups’ damage led to the increase in the earthquake response.
References
-
Lu Pengzhen, Fangyuan Li, Changyu Shao Analysis of a T-frame bridge. Mathematical Problems in Engineering, Vol. 2012, 2012, p. 640854.
-
Qiu Feng Structure Analysis and Desige Research of Prestressed Concrete Chord-Stayed Truss Bridge. Huazhong University of Science and Technology, 2006.
-
Jin Wen-Cheng, Zhou Chang-Dong, Qiu Feng, et al. Structural characteristics and structural types of prestressed concrete truss-stayed bridge. Bridge Construction, Vol. 2, 2007, p. 55-57.
-
Chen Ke The Diseases mechanism Analysis and Maintance and Strengthening of Prestressed Concrete Chord-Stayed Truss T Rigid Frame Bridge. Chang’an University, Xi’an, 2014.
-
Xia Yongming Three kinds of cable-stayed bridge truss system type introduction. Bridge Construction, Vol. 4, 1994, p. 58-62.
-
Wang Da Mechanics Characteristics and Construction Control of Prestressed Concrete Oblique-pulling through Truss Bridge. Chang’an University, Xi’an, 2014.
-
Jin Wen Cheng, Yin Huayi, Bai Jinzeng Construction control of prestressed concrete chord-stayed truss bridge. Journal of Huazhong University of Science, (Urban Science Edition), Vol. 26, Issue 3, 2009, p. 4-8.
-
Tang Xiang Mechanics Characteristics and Load Test Research of PC Oblique-pulling through Truss Bridge. Chang’an University, Xi’an, 2007.
-
Du Fei Construction Control Research of Prestressed Concrete Chord-Stayed Truss Bridge. Huazhong University of Science and Technology, Wuhan, 2007.
-
Xie Wei Stress analysis of the shear hinge and its effect on prestressed concrete truss T frame bridge. Chang’an University, Xi’an, 2014.
-
Liu Ai-Rong, Yu Qi-Cai, Zhang Jun-Ping Seismic response of long span continuous rigid-frame arch bridge. Shenzhen Daxue Xuebao (Ligong Ban)/Journal of Shenzhen University Science and Engineering, Vol. 27, Issue 3, 2007, p. 228-233.
-
Linzell D. G., Nadakuditi V. P. Parameters influencing seismic response of horizontally curved, steel, I-girder bridges. Steel and Composite Structures, Vol. 11, Issue 1, 2011, p. 21-38.
-
Tehrani Payam, Mitchell Denis Effects of column stiffness irregularity on the seismic response of bridges in the longitudinal direction. Canadian Journal of Civil Engineering, Vol. 40, Issue 8, 2013, p. 815-825.
-
Shen Xing, et al. Seismic performance of transverse steel damper seismic system for long span bridges. Engineering Structures, Vol. 141, 2017, p. 14-28.
-
Zheng Zhen, Huang Cheng Defeat detection and assessment for Hongtang Bridge in No. 316 national highway. Journal of Fuzhou University (Natural Science), Vol. 2, 2003, p. 191-195.
-
Cao Sheng-Tao, Li Zhi-Shan An elastoplastic damage constitutive model for concrete under uniaxial load. Engineering Mechanics, Vol. 34, Issue 11, 2017, p. 116-125.
-
Zhou Jianting, Yangjian Xi, Zongbao Real-Time Monitoring of Bridge Life Prediction Theory and Application. Science Press, Beijing, 2010.
-
Shan Deshan, Li Yanqiao, Fu Chunyu, et al. Intelligent Bridge Health Monitoring and Damage Assessment. China Communications Press, Beijing, 2010.
-
Li Aiqun, Ding Youliang Early Warning Theory of Engineering Structure Damage and Its Application. Science Press, Beijing, 2007.
About this article

This research was funded by the Open Research Fund of Key Laboratory of Failure Mechanism and Safety Control Techniques of Earth-Rock Dam of the Ministry of Water Resources (YK319012), the Open Research Fund of Key Laboratory of Hydraulic and Waterway Engineering of the Ministry of Education (Chongqing Jiao tong University, Grant No. SLK2017A02) and National Key Research and Development plan (2016YFC0802207).
