Abstract
Wheel-rail contact phenomena is problem considered in many scientific manuscripts. Mostly the research is focused on wear, friction and forces analysis. This paper presents research on rail vibration generated due to rail vehicle passage. The problem investigated was the influence of wheel slip phenomena on vibration of rail. The locomotive wheel slip can be caused due to braking, flat wheel or defect (wear) of rail surface. Therefore, results of presented investigations can be useful for many applications, including rail vehicle driving monitoring system, control system, especially due to braking distance or diagnostics of wheels of railway tracks. The research was taken place on experimental test track. For the complex analysis horizontal and vertical vibration were measured. The investigation requires regular train vehicle drive condition, where the wheels are rolling on the rail surface without wheel slip and second case for drive process including wheel rolling and wheel slip (friction rolling and sliding). The vibration signals are non-stationary thus its processing should be conducted simultaneously in the time and frequency domain, as time-frequency representation (TFR). For this purpose, Short Time Fourier Transform (STFT) and Continuous Wavelet Transform (CWT) can be employed.
1. Introduction
Wheel-rail contact is very important for safety of rail vehicle, thus it is scientific problem considered by many researchers [1, 2, 6-8, 17]. This paper presents research on rail vibration generated under the wheel-rail contact of driving rail vehicle. These are rolling vibration propagate as structural waves generated by the combination of small-scale undulations on the contact area surfaces. When consider contact phenomena due to sources of vibration the profile irregularity of a rail surface is one of the main one [9, 12, 15]. But for real condition there are much more important factors and sources of vibration, especially when consider dynamical phenomena occurred during driving of rail vehicle. When wheelsets suffer variational traction/braking torque or a stick/slip vibration, the dominant vibration frequency is the longitudinal frequency of contact patch. As the frequency of contact patch is a specific value, it produces the periodic impact to the wheels as well as to the wear of wheel rim, this may lead the polygonization of wheels [10]. It is well known that in the contact zone between railway wheel and rail the surfaces must be strong enough to resist the normal (vertical) forces introduced by heavy loads and the dynamic response induced by track and wheel irregularities. The dynamic phenomena accompanying the wheel rolling over a road (rail, track), with lateral slip effects occur in rolling of a wheel and wheelset on a straight track in the case of lateral load and especially on curves [14, 16, 18]. Different curvature radii and rotary oscillations of wheelsets result in skew rolling and, in turn, in lateral slip oscillation in the contact zone between the wheel and rail. It significantly increases noise, vibrations and wear [13].
2. Research methodology
The research was conducted on experimental rail track. The experimental rail track is consisted of pair rails mounting on wood sleepers joined by rail pads. The test 2-axle bogie vehicle was driving on this rail track. The view of the experimental rail track has been depicted in the Fig. 1.
Fig. 1Experimental rail track
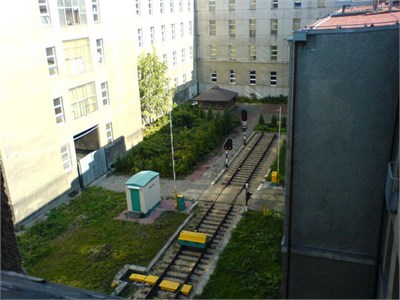
The investigations require measurement of 3-axial vibration due to different properties of lateral and longitudinal or vertical waves propagation. The two cases were investigated. First was conducted for the regular drive condition where the wheels are rolling on the rail surface without wheel slip. Second case study for drive process including wheel rolling and wheel slip (friction rolling and sliding).
3. Measurement system
The acceleration of vibration was measured by acceleration sensors. The accelerations were recorded with the use of specially mounting kit for accelerometers (Fig. 2). It is due to assumption of universal method of sensors placement for the different type of rail. Also, very important is to ensure electrocompability of the measurement system not to influence on railway power loop [19]. Method developed for the measurement, as presented mounting kit, allows to ensure repeatability of results.
Fig. 2Location of sensors (special mounting kit)
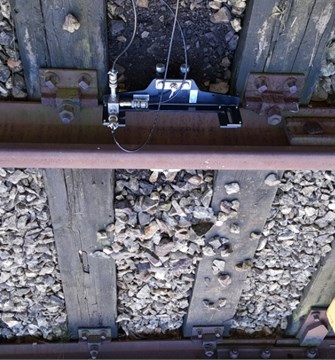
a)
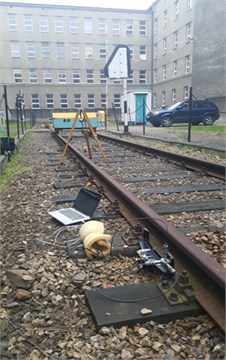
b)
4. Method of analysis
As the result of the research the vibration signals were collected. The signals are non-stationary thus processing should be conducted simultaneously in the time and frequency domain. Such approach requires time-frequency transformation of the signal. This paper presents possibilities of STFT and CWT transformations application for purpose of time-frequency method for research on influence of locomotive wheel slip on rail vibration. The STFT calculate local spectra of pre-defined constant segments (constant windows) of signal. The CWT transformation based differences are analysis with a basic function, as mother wavelet and non-constant scaled segments (changeable windows) of signal. Both transformations results are time-frequency representations (TFR).
4.1. Short time Fourier transform (STFT)
The STFT is a simple and effective method widely used in machine diagnostics [5, 11]. The result of STFT are collection of spectrums calculated for pre-defined segments of the signal. Thus, it is occurred TFR of the signals.
The Short Time Fourier Transform equation:
where () is window width.
The STFT algorithm based on Fast Fourier Transformation (FFT) for the following pre-defined segments of signal and the window function with constant width . The resolution of the TFR result depend on length of the window. For narrow window we achieve better time resolution but for wide window the frequency resolution will be better. Also, the type (shape) of the window is important, for example rectangle window can modify beginning and the end of windows, which are the source of leak in spectrum. For minimalizing of this kind of effects other windows are often used (for example triangle, Hanning, Hamming). Thus, the windows width should be considered as decision about precision in time or frequency domains. To improve the resolution in frequency domain it can be used zero-complementing method. This method is based on adding samples with zero value of amplitude to the original signal to multiple the number of samples of the signal.
Another approach for improving the precision of STFT transformation is superposition of windows reached as difference between shift and width of window, so the FFT can be multiple for defined range of samples.
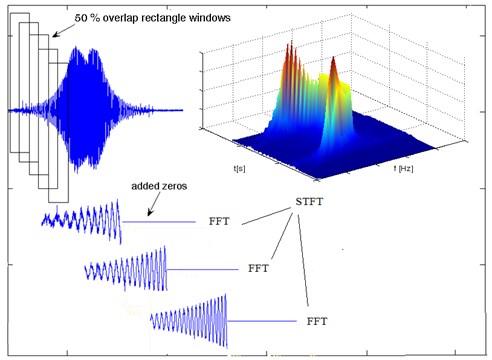
The paper presents results of the signal processing by STFT with the Hamming window. The proposed method was employed both approaches, so at first the window was 100 % elongated by using complement zero and next such windows were superpositioned in 50 %. The signal processing method has been depicted in Fig. 3.
It can be noticed that using overlapping windows and adding zeros increases the precision of the determination of individual spectral components of the spectrogram STFT. Zero-padding directly affects the frequency resolution spectra of individual components. In contrast, the overlapping windows allows to overcome the clear limits pass between these spectra. In the end, applied operations allowed to determine the smoothed spectrograph STFT especially for further analysis of a particular frequency band selection.
Fig. 3STFT procedure with overlap and with added zeros
4.2. Continuous wavelet transform (CWT)
The method used to analyze the collected data is a wavelet transform. This is a time-frequency analysis method proposed by Morlet and Grossman (1984). They formulated a basic function, the rules of constructing on its basis the family of analyzing functions, and a formula describing the result of the analysis in the - (time-frequency) domain as a function of two variables ( and ) [3-5]. The basic function has the form:
This is a mother function because it is used to construct a family of analyzing wavelets :
where: – time shift; > 0 the narrowing-expansion factor is responsible for the frequency of the analysis range.
After entering the additional scale parameter, a Wavelet Transform (Wavelet Transform WT) was created in the location window in the Gabor transform.
The analysis function called the main wavelet has the coefficient a which causes the change of the wavelength and the coefficient which changes the position of the wavelet on the time axis. The equation represents band-pass filtering of signals by means of filters with different transmission bands. The Wavelet Transform (WT) is a two-dimensional function in which is a scale parameter (frequency) and is a translation parameter (time shifts):
Coefficients representing the realized signal in the field of - describes the relationship:
This dependence is equivalent to the convolution of the signal with the analysis wavelet.
The function is an evenly locally oscillating function and assumes zero values outside the coherent oscillation interval. The course of the function is similar to the undulations, local oscillations quickly disappear along with the distance from the center hence the name: Wavelet.
In the Wavelet analysis, the amount of wavelet oscillation is constant, and the frequency change is accompanied by a proportional change in the wavelength of the wavelength.
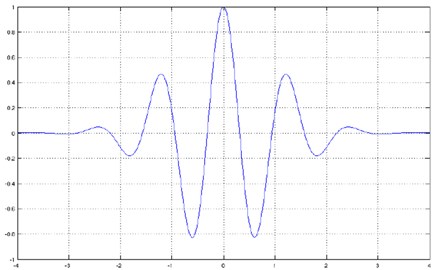
Analysis of the non-stationary spectral properties of the signal requires the use of windows, which automatically increase when analyzing high frequencies and are automatically expanded when analyzing low frequencies which is what is possible with the wavelet analysis. The analysis uses a Morlet wavelet shown in the Fig. 4.
The Morlet wavelet was chosen due to characteristics of studied signals.
Fig. 4Morlet wavelet function
5. Results of TFR analysis
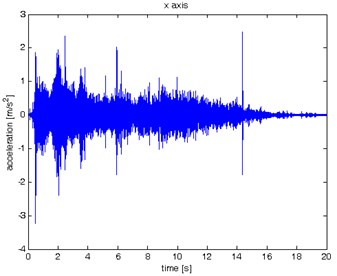
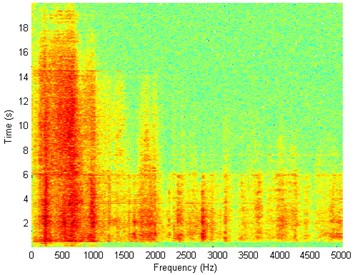
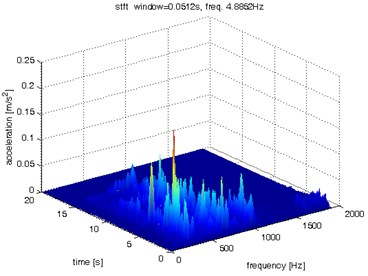
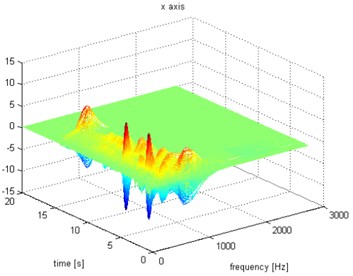
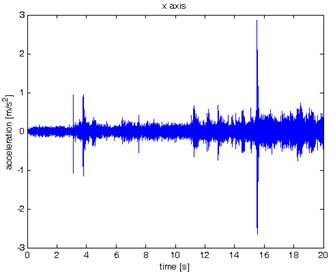
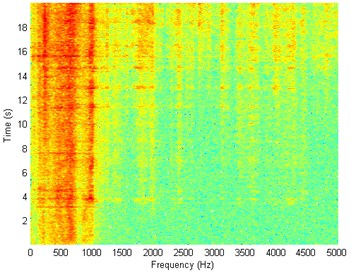
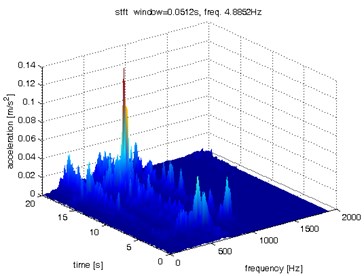
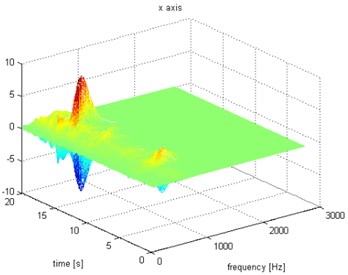
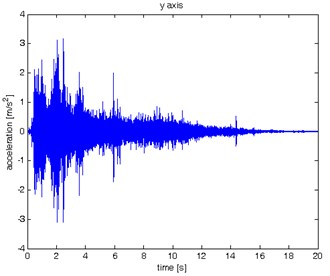
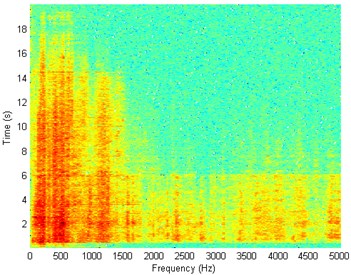
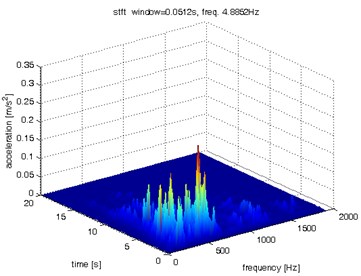
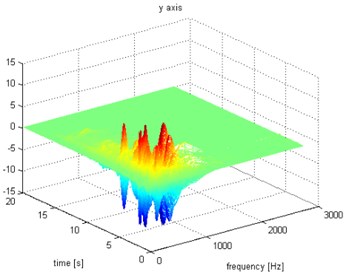
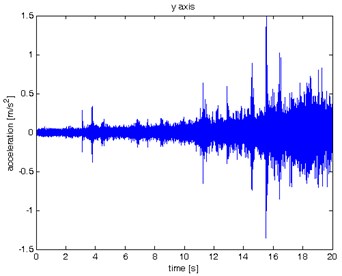
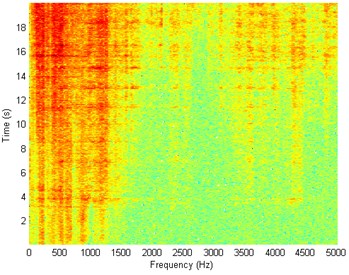
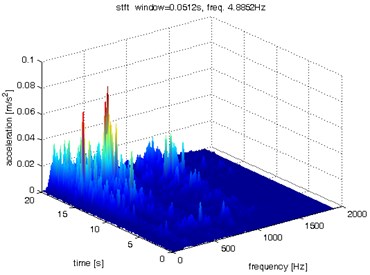
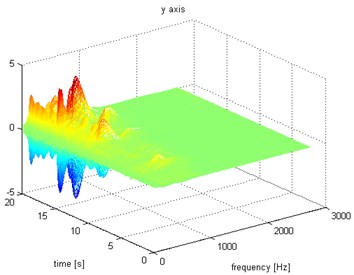
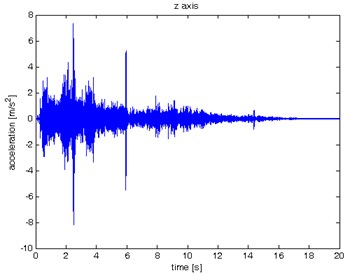
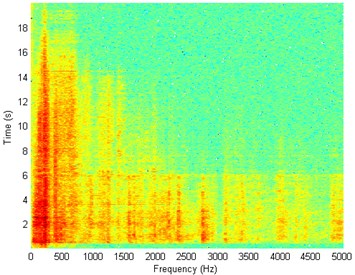
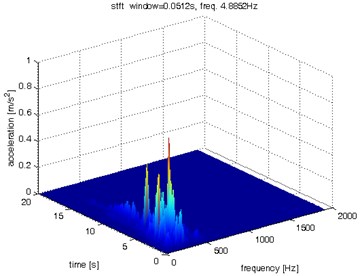
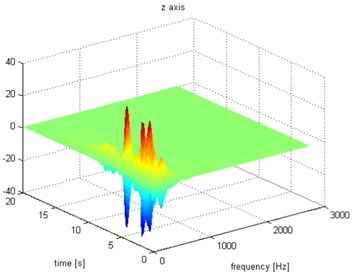
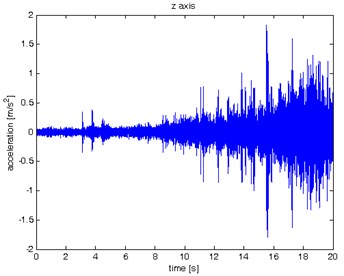
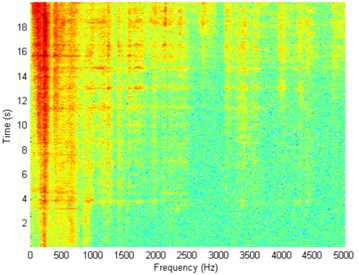
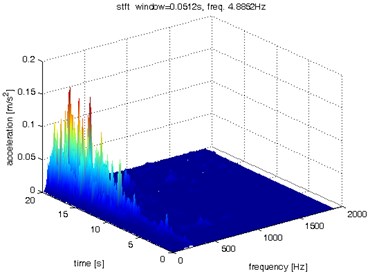
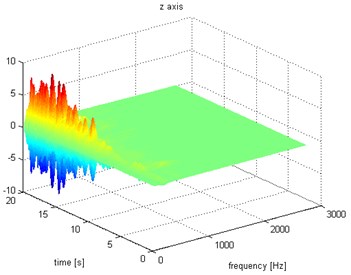
The results of spectrogram, STFT and CWT are time-frequency representation (TFR) of signal calculated for acceleration signals (in three orthogonal direction , , ) measured without wheel slip are presented in Figs. 5, 7, 9 and measured with wheel slip are presented in Figs. 6, 8, 10.
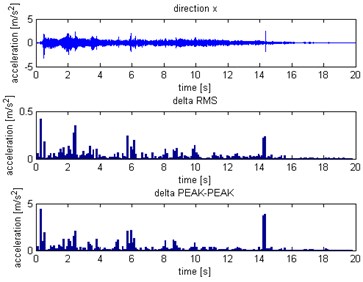
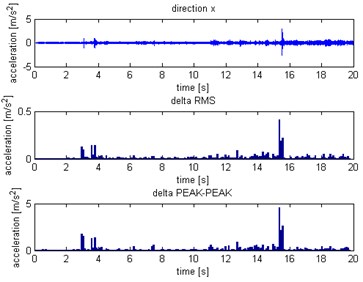
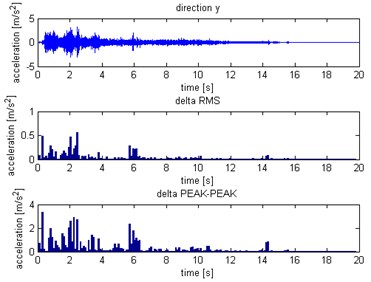
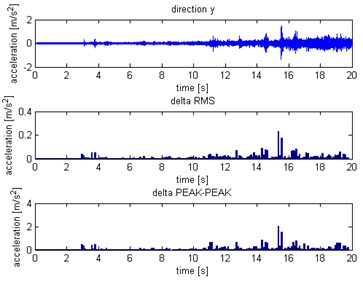
The statistical estimators were also used in the analysis. The values were determined for short-term sections (a sliding window was used). Due to the analysis of TFR of the signals and properties of waveforms the root mean square () and peak to peak () have been calculated:
For the subsequent and values calculated in this way, relative increments in subsequent windows were determined:
The results as the distribution of selected parameters have been depicted the Figs. 11-13.
Fig. 5Waveform and TFR of vibration without wheel slip (x axis)
a)
b)
c)
d)
Fig. 6Waveform and TFR of vibration with wheel slip (x axis)
a)
b)
c)
d)
Fig. 7Waveform and TFR of vibration without wheel slip (y axis)
a)
b)
c)
d)
Fig. 8Waveform and TFR of vibration with wheel slip (y axis)
a)
b)
c)
d)
Fig. 9Waveform and TFR of vibration without wheel slip (z axis)
a)
b)
c)
d)
Fig. 10Waveform and TFR of vibration with wheel slip (z axis)
a)
b)
c)
d)
Fig. 11Distribution for X axis: a) without slip, b) with slip
a)
b)
Fig. 12Distribution for Y axis: a) without slip, b) with slip
a)
b)
Fig. 13Distribution for Z axis: a) without slip, b) with slip
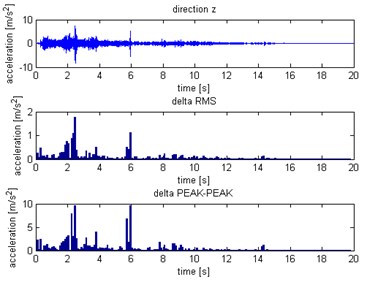
a)
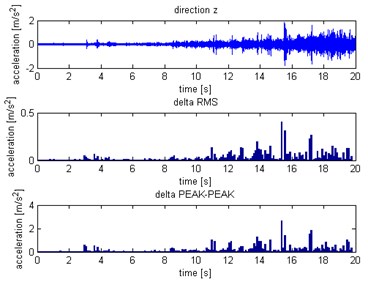
b)
6. Conclusions
Designated spectrograms and spectra STFT and CWT allow simultaneous observation of signal structure in the frequency and time domain. The CWT is of interest for the analysis of non-stationary signals, because it provides an alternative to the classical STFT. When these methods were compared in term of process time, the STFT took the shortest time and it was applicable on line. On the other hand, the CWT took longer time but, in some situation, gives better results. Both for with and without wheel slipcases, there are a broadband impulse in signal and that is associated with the quality of co-operation in the rail wheel contact. In the case of and direction, the frequency components dominate in the range up to about 1 kHz while the direction in the range up to 0.5 kHz. It is difficult to distinguish the state of cooperation on the basis of the evaluation of vibration signals or spectra alone. Further research will focus on proposing estimators (based, for example, on analyzes in selected frequency bands), to classify and distinguish the nature of cooperation in the rail wheel contact.
References
-
Baek K. S., Kyogoku K., Nakahara T. An experimental investigation of transient traction characteristics in rolling-sliding wheel/rail contacts under dry wet conditions. Wear, Vol. 263, Issue 1, 2007, p. 169-179.
-
Bezin Y., Iwnicki S. D., Cavallett M. The effect of dynamic rail roll on the wheel-rail contact conditions. Vehicle System Dynamics, Vol. 46, Issue 1, 2008, p. 107-117.
-
Burdzik R. Novel method for research on exposure to nonlinear vibration transferred by suspension of vehicle. International Journal of Non-Linear Mechanics, Vol. 91, 2017, p. 170-180.
-
Kroworz A., Katunin A., Lopes H., Araújo dos Santos J. Efficiency assessment of wavelet transforms and wavelets for damage localization in beams using shearograph. Diagnostyka, Vol. 19, Issue 4, 2018, p. 71-79.
-
Burdzik R., Konieczny Ł., Warczek J., Cioch. W. Adapted linear decimation procedures for TFR analysis of non-stationary vibration signals of vehicle suspensions. Mechanics Research Communications, Vol. 82, 2017, p. 29-35.
-
Ortiz J. O., Betancur German R., Gomez J., et al. Detection of structural damage and estimation of reliability using a multidimensional monitoring approach. Proceedings of the Institution of Mechanical Engineers Part F – Journal of Rail and Rapid Transit, Vol. 232, Issue 4, 2018, p. 1021-1032.
-
Gutierrez-Carvajal R. E., Betancur German R., Castaneda Leonel F., et al. A fractional Fourier transform-based method to detect impacts between the bogie and the car body of a railway vehicle: a data-driven approach. Proceedings of the Institution of Mechanical Engineers Part F – Journal of Rail and Rapid Transit, Vol. 232, Issue 1, 2018, p. 288-296.
-
Gutierrez-Carvajal R. E., Betancur German R., Barbosa J., et al. Full-scale fatigue test performed to the bolster beam of a railway vehicle. International Journal of Interactive Design and Manufacturing – IJIDEM, Vol. 12, Issue 1, 2018, p. 253-261.
-
Iwnicki S. Handbook of Railway Vehicle Dynamics. Taylor and Francis, Boca Raton, 2006.
-
Johansson A., Andersson C. Out-of-round railway wheels-a study of wheel polygonalization through simulation of three-dimensional wheel-rail interaction and wear. Vehicle System Dynamics, Vol. 43, Issue 8, 2005, p. 539-559.
-
Chilinski B., Zawisza M. Analysis of bending and angular vibration of the crankshaft with a torsional vibrations damper. Journal of Vibroengineering, Vol. 18, Issue 8, 2016, p. 5353-5363.
-
Burdzik R., Nowak B., Rozmus J., Słowiński P., Pankiewicz J. Safety in the railway industry. Archives of Transport, Vol. 44, 2017, p. 15-24.
-
Konowrocki R., Bajer C. Friction rolling with lateral slip in rail vehicles. Journal of Theoretical and Applied Mechanics, Vol. 47, Issue 2, 2009, p. 275-293.
-
Burdzik R., Nowak B. Identification of the vibration environment of railway infrastructure. Procedia Engineering, Vol. 187, 2017, p. 556-561.
-
Soedel W. Vibrations of Shells and Plates. Second Edition, Marcel Dekker Inc., New York, 1993.
-
Wagner U. Nonlinear dynamic behavior of a railway wheelset. Vehicle System Dynamics, Vol. 47, Issue 5, 2009, p. 627-640.
-
Jacyna M., Wasiak M., Lewczuk K., Kłodawski M. Simulation model of transport system of Poland as a tool for developing sustainable transport. Archives of Transport, Vol. 31, 2014, p. 23-35.
-
Ziqiang X., Shihuib L., Xiaoqing D., Weihua M. Study on longitudinal vibration of wheel/rail contact and its implications for wheel polygnization. Journal of Advances in Vehicle Engineering, Vol. 3, Issue 1, 2017, p. 22-28.
-
Siergiejczyk M., Pas J., Rosinski A. Issue of reliability-exploitation evaluation of electronic transport systems used in the railway environment with consideration of electromagnetic interference. IET Intelligent Transport Systems, Vol. 10, Issue 9, 2016, p. 587-593.
Cited by
About this article

