Abstract
Crack on piezoelectric ceramic is the main reason leading to failure of ultrasonic motors. A novel degradation feature extraction method based on discrete cosine transform (DCT) -singular value (SV) cross entropy was proposed in this paper. In order to improve the correlation with the crack, the DCT coefficients with the property of energy aggregation, were used to extract fault information. To avoid the influence of human factors in traditional DCT de-noising method, a matrix composed of DCT coefficients was constructed, and the SV cross entropy of the matrix was taken as the degradation feature for ultrasonic motor. A numerical simulated noise was added to the measured signal to verify the anti-noise performance of the feature. Analysis of the experimental results demonstrates that the proposed DCT-SV cross entropy is feasible and effective in indicating the degradation of piezoelectric ceramic in ultrasonic motor.
Highlights
- DCT coefficients of monitor electrode voltage can sensitively reflect the energy change in stator vibration of ultrasonic motor.
- DCT-SV cross entropy is sensitive to the piezoelectric ceramic degradation state, and has a good performance to discover early degradation.
- DCT-SV cross entropy presents a satisfactory anti-noise performance which has been verified by the simulated noise.
1. Introduction
For the advantages of high torque, quick response, no electromagnetic and auto-locking, ultrasonic motors have been widely used in the areas such as aerospace, medical equipment, optical instruments, robots, and new military equipment [1, 2]. Crack on piezoelectric ceramic is the main reason leading to failure of ultrasonic motors. It is necessary to pay considerable attention to the degradation feature extraction for piezoelectric ceramic, so that early warning and prevention could be made in time especially in the case of slight degradation.
The literature referring to the crack of piezoelectric ceramic mainly focuses on the mechanism and stress analysis [3-5]. In ultrasonic motor, monitor electrode voltage (MEV) is often used to monitor the vibration of stator. Since the MEV generated by the positive piezoelectric effect is similar to the signal generated by the acceleration sensor, the fault diagnosis methods based on vibration analysis have great reference value for this study. The basement of the feature extraction is the signal processing for obtaining sensitive failure information, and various methods have been applied in signal analysis and fault diagnosis recently, such as wavelet transform and empirical mode decomposition (EMD). Wang Z. [6] extracted the rolling bearing fault feature parameters by the best set of mother wavelets. Hu Q. [7] proposed an effective method for rotating machinery based on a weighted extreme learning machine with wavelet packet decomposition. Li Y. [8] applied bandwidth EMD and adaptive multi-scale morphology analysis for incipient fault diagnosis of rolling bearings. Yu X. [9] improved the accuracy of bearing fault diagnosis by local Fisher discriminant analysis and EMD based on vibration signals. However, these popular methods also have unsolved problems: One is the selection of thresholds and wavelet basis in wavelet transform; the other one is the mode fixing and end effect in EMD method.
In the past few years, signal processing methods based on spectral information analysis are widely used in fault diagnosis of mechanical devices. Among them, local mean decomposition as a novel time–frequency analysis method, can self-adaptively decompose a complicated signal into a set of components, each of which is the product of an envelope signal and a purely frequency modulated signal. Zhao H. [10] proposed a compound interpolation envelope local mean decomposition for fault diagnosis of reciprocating compressor, the envelope frequency spectrum presented a more significant peak of fault frequency. Li D. [11] proposed an enhanced bispectrum technique for incipient induction motor fault detection, and the effectiveness of the method was examined by different operating conditions. Hassan M. A. [12] introduced a new concept based on the bicoherence spectrum to assess the health conditions of helicopter drive train. Discrete Cosine Transform (DCT) as the spread of Fourier transform, has the property of energy aggregation [13, 14]. Wang Y. [15] proposed an improved DCT de-noising method for vibration signal to reveal the performance degradation of the hydraulic pump. Furthermore, singular value decomposition (SVD) is also widely used in the rotating machinery fault diagnosis. Kang M. [16] proposed SVD-based feature extraction to categorize the faults of the induction motor by support vector machine. Yang Q. [17] introduced an efficient solution to diagnose multiple mechanical faults in wind turbine gearbox by EMD and SVD joint approach. Yang H. [18] presented sliding window de-nosing K-SVD method for bearing fault diagnosis. Liu Y. [19] assembled SVD with wavelet transformation to extract the fault feature for submersible pump.
Entropy is able to quantify the disorder or uncertainty of probability distribution, and it has been widely applied in damage monitoring. Zhao H. [20] proposed a novel hermite local mean decomposition to construct the envelopes, and the multiscale fuzzy entropy was successfully used for bearing clearance fault diagnosis of reciprocating compressor. Ai Y. T. [21] fused singular spectrum entropy, power spectrum entropy, wavelet space spectrum entropy and wavelet energy spectrum entropy for the rolling bearing fault diagnosis. Cross entropy is an index that can reflect the deviation degree of two sets of probability distribution. The smaller cross entropy value, the more consistent the probability distribution, and vice versa. Ye J. [22] used cross entropy to diagnosis the main fault types of turbine, which is a good reference for degradation feature extraction of ultrasonic motor.
As far as degradation feature extraction for piezoelectric ceramic is concerned, the energy transmission would be subjected to a disturbance as the traveling wave passes through the crack on ceramic. MEV can reflect the vibration of piezoelectric ceramic in ultrasonic motor [23]. For the reason that DCT has the property of energy aggregation, DCT coefficients of MEV signal will be sensitive to energy change caused by the crack. The DCT coefficients can be used for information extraction to improve the correlation with the degradation. However, DCT just separates the useful information and noise in different frequency ranges, and the noise will still affect the results of degradation feature extraction based on information entropy analysis. In traditional method, the noise can be filtered out by removing the high frequency coefficients which are usually selected by engineering experience [15]. Therefore, the filtering results are largely influenced by human factors. Furthermore, drive frequency of the ultrasonic motor generally needs to be more than 20 kHz, the traditional method would also result in the loss of useful information. To solve above problems, singular value (SV) will be incorporated into the calculation of information entropy in this paper. A matrix can be constructed by DCT coefficients of MEV signal, then SV sequence of the matrix will be used to extract cross entropy for improving anti-noise performance.
Consequently, a novel degradation feature extraction method for piezoelectric ceramic in ultrasonic motor is proposed based on DCT-SV cross entropy. The remainder of this paper is organized as follows: In Section 2, the SV sequence based on DCT coefficients is given. Then the cross entropy quantifying the distribution differences between test sample and standard sample will be detailed. In Section 3, the effectiveness of the proposed method will be validated with experimental results. Finally, the conclusions are provided in Section 4.
2. DCT-SV cross entropy
The MEV signal sequence is noted as with points, 1, 2,…, . The DCT coefficients can be defined as the following formula [24]:
where 1, 2,…, , , , .
DCT has the property of compacting the most energy within the fewest number of coefficients. In order to reduce the influence of human factors in traditional DCT de-noising method, SV is incorporated into the calculation of information entropy. The proposed DCT-SV cross entropy can be described as follows.
Construct a matrix according to DCT coefficient sequence :
where 1, 1 and is the integration of .
SVD of matrix can be expressed as follows [25]:
where and are orthogonal matrixes, , is the order of .
The weight coefficient of singular value can be defined as:
where 1, 2,…, .
The DCT-SV cross entropy which is taken as the degradation feature, is defined as follows:
where denotes the weight coefficient distribution of test data, denotes the one of standard data in normal state.
Therefore, the proposed DCT-SV cross entropy can quantify the distribution difference between test data and standard data. The smaller the DCT-SV cross entropy, the closer the standard data and test data are. Furthermore, 0 if and only if .
The flowchart of degradation feature extraction is concluded as Fig. 1.
3. Experimental results
3.1. Data sampling of MEV signal
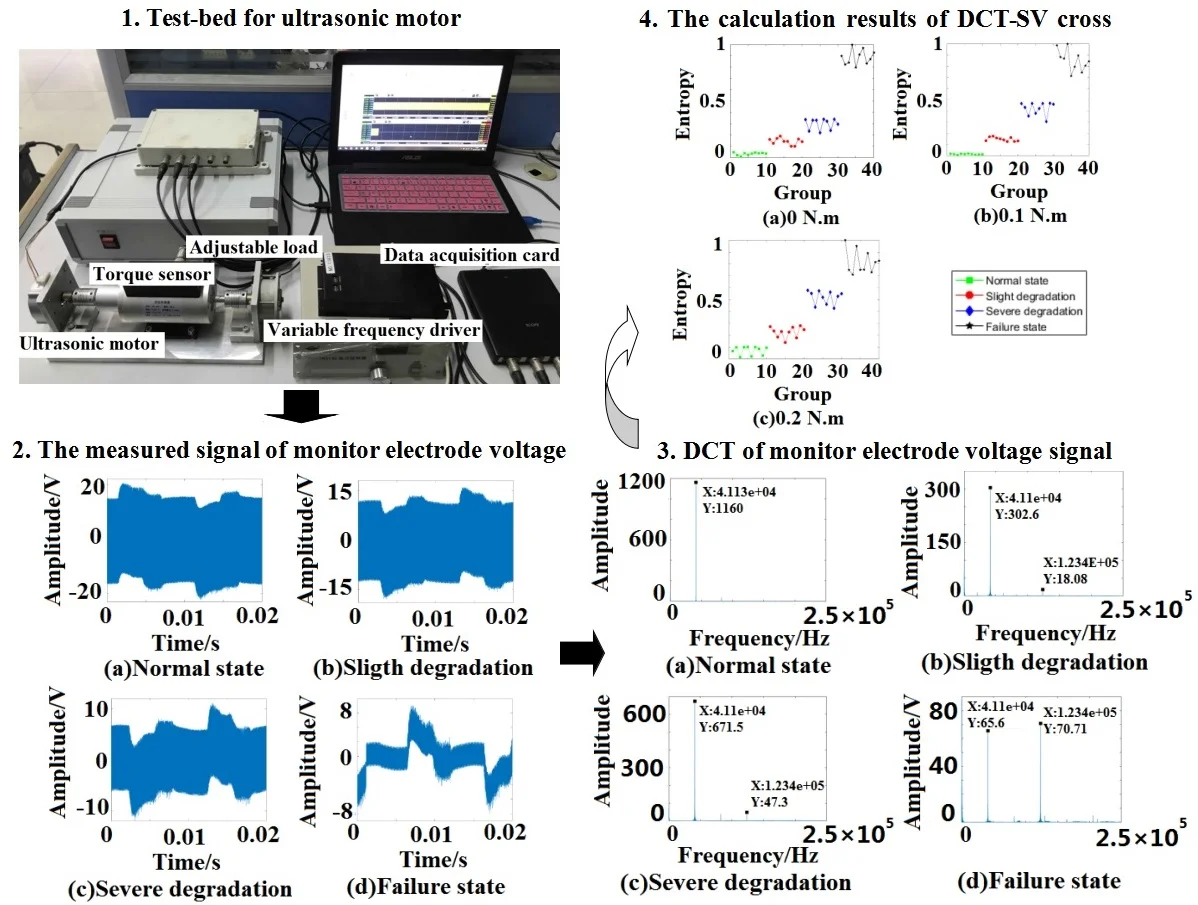
The data sampling of MEV signal was carried out by the ultrasonic motor test-bed, which is shown in Fig. 2.
Fig. 1The flowchart of degradation feature extraction
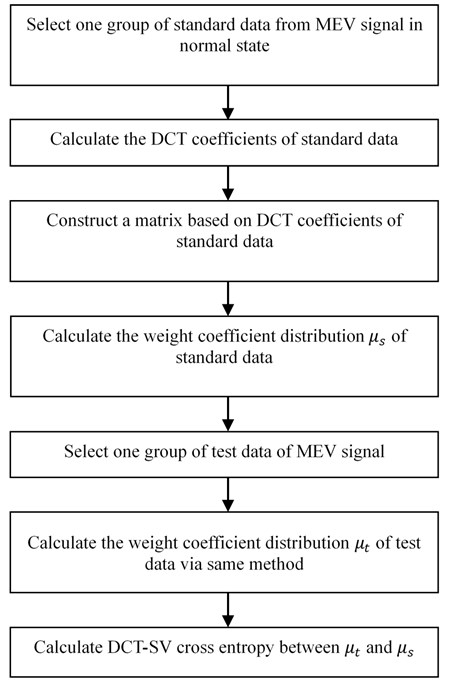
Fig. 2Test-bed for ultrasonic motor
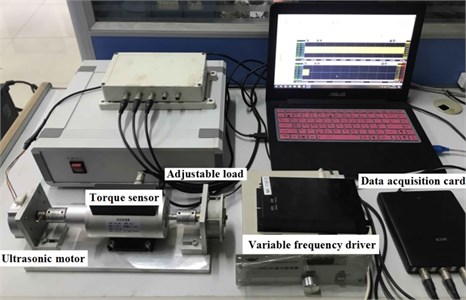
The tested ultrasonic motor is a TRUM-60-P. Its maximum torque is 0.6 N·m. The speed is controlled by a variable frequency driver, and the load can be changed by a magnetic powder brake. The frequency of MEV was 41 kHz, and the signal was collected by the Handyscope HS4 data acquisition card of TiePie engineering. The sampling frequency was set to be 500 kHz, and the sampling time of each group data was 2 s. The MEV signals were recorded in three load conditions including 0 N·m, 0.1 N·m and 0.2 N·m. There were 40 test samples under each load condition, and 10 test samples in each degradation state. The test samples were numbered as follows: 0-10 groups were actual normal state, 11-20 groups were actual slight degradation, 21-30 groups were actual severe degradation, and 31-40 groups were actual failure state.
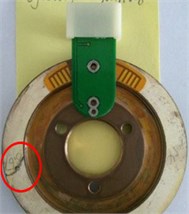
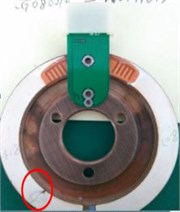
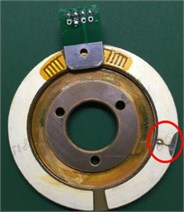
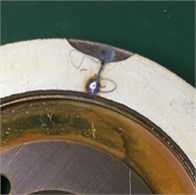
The piezoelectric ceramics of four degradation states are shown in Fig. 3.
Fig. 3The piezoelectric ceramics in four degradation states
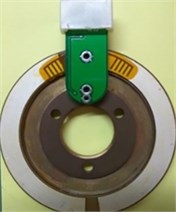
a) Normal state
b) Slight degradation
c) Severe degradation
d) Failure state
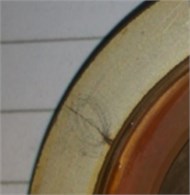
e) Crack details in slight case

f) Crack details in severe case
g) Crack details in failure case
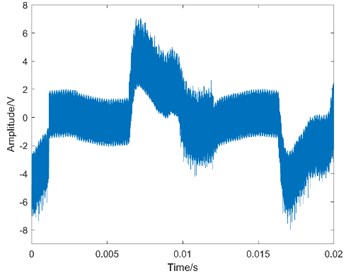
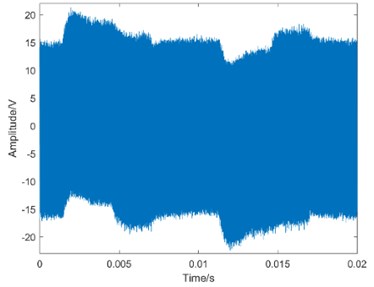
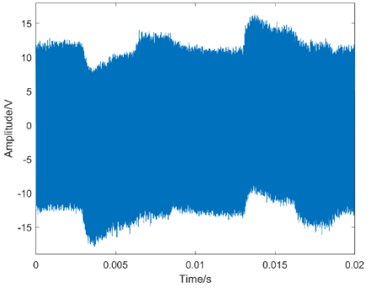
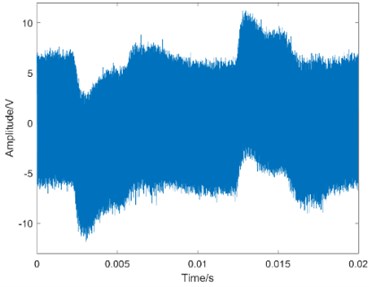
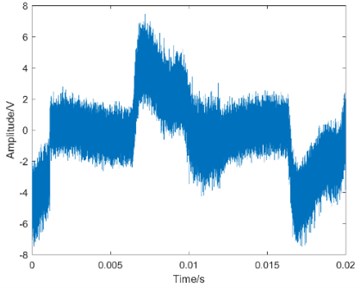
Fig. 4The waveform of MEV
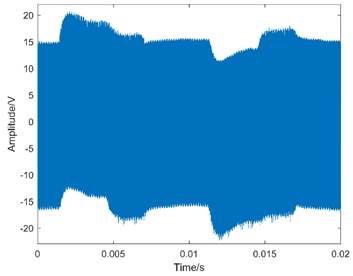
a) Normal state
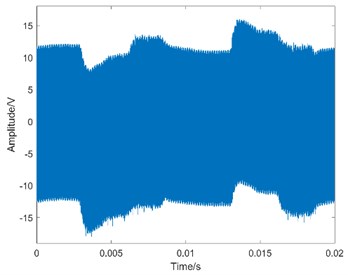
b) Slight degradation
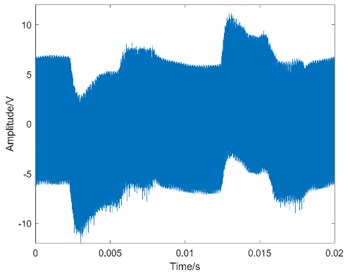
c) Severe degradation
d) Failure state
The surface conditions of the cracks are described as follows:
(1) Normal state: intact;
(2) Slight degradation: the average width of crack is 0.2 mm and the length is 7.6 mm;
(3) Severe degradation: the average width of crack is 0.7 mm and the length is 8.7 mm;
(4) Failure state: the average width of central crack is 0.4 mm and the length is 2.3 mm. In addition, there are defect (12.2 mm2) and pitting corrosion (4.1 mm2) located on both sides of the crack, respectively.
Taking operation condition 0 N·m as an example, the waveform of MEV is shown in Fig. 4.
3.2. DCT spectrum
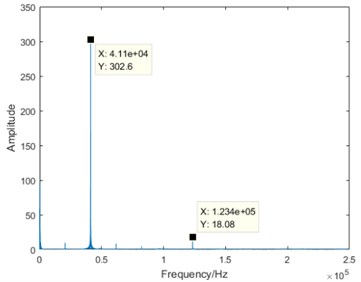
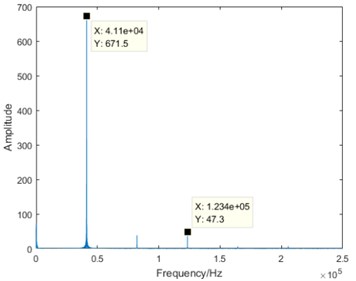
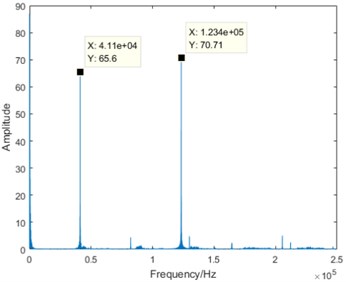
Taking the no-load condition as an example, the DCT spectrum in four degradation states is shown as Fig. 5.
From the comparison of four sub-graphs in Fig. 5, the 41.1 kHz driving component can be clearly distinguished. With the degradation development and the attenuation of stator vibration, the amplitude of the driving component is gradually decreasing. On the contrary, it is also worth noting that there are some components increasing with the degradation development. Taking the 123.4 kHz component as an example, it is almost close to zero in normal state, the amplitude in severe degradation state is slightly larger than that in slight degradation state, and the amplitude increases significantly in failure state. Based on the above analysis, it is true that the DCT coefficients contain some useful information varying regularly with the degradation. Furthermore, DCT spectrum becomes more complex from normal state to failure state. Therefore, the entropy representing DCT coefficient complexity can be used for the degradation feature extraction.
Fig. 5The DCT spectrum of MEV signal
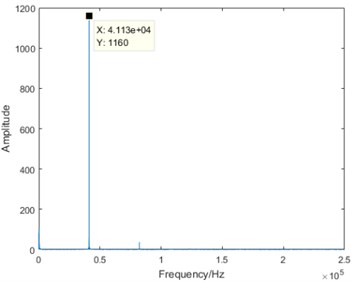
a) Normal state
b) Slight degradation
c) Severe degradation
d) Failure state
3.3. DCT entropy
In order to verify the superiority of the proposed DCT-SV cross entropy, DCT entropy was used for comparative analysis. The DCT entropy is described as follows [26]:
where is the DCT coefficients of MEV. is the data length of test sample.
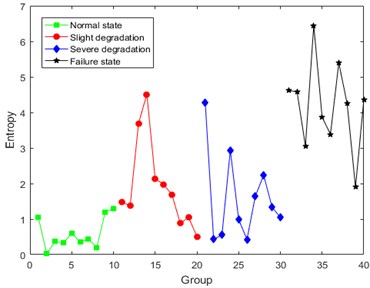
Taking operation condition 0 N·m as an example, the results of DCT entropy in four degradation states are shown as Fig. 6.
Fig. 6Results of DCT entropy
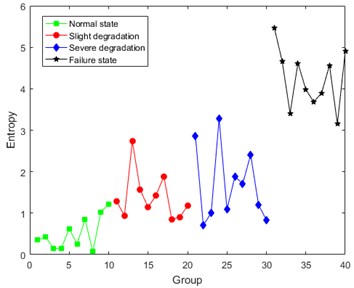
Fig. 7Waveform of the simulated signal with 10 dB noise
a) Normal state
b) Slight degradation
c) Severe degradation
d) Failure state
Analysis of Fig. 6 shows that the values of DCT entropy are generally increasing with the constant development of degradation, which represents that the DCT coefficients of MEV signal contains degradation information caused by the crack. However, the first three degradation states can’t be distinguished very clearly. The volatility of DCT entropy in the same degradation state is still relatively large. The main reason for this situation is considered to be the noise interference in MEV signal.
To further verify the noise influence on the calculation results, the simulated 10 dB noise was added to the measured signal, and the corresponding waveform is shown in Fig. 7.
The DCT entropy results of the simulated signal are shown in Fig. 8.
Compared with Fig. 6, the volatility in Fig. 8 becomes larger, and the difference between failure state and the first three states gets smaller. Consequently, it is unreasonable to take DCT entropy as the degradation feature, and the noise influence on the results of DCT entropy has been verified again.
The traditional way filtering out the noise is to remove the high frequency DCT coefficients according to engineering experience which is largely influenced by human factors. In this paper, DCT-SV cross entropy will be taken as the degradation feature to improve the anti-noise performance.
Fig. 8DCT entropy results of the simulated signal
3.4. Degradation feature extraction based on DCT-SV cross entropy
3.4.1. The parameter selection of the constructed matrix
The row number in the constructed matrix determines the length of SV sequence, and SV is proportional to the amount of information [27]. According to Eq. (5), will affect the calculation results of DCT-SV cross entropy. Consequently, the choice of value will be discussed in the following. Limited by the paper space, the SV sequences of constructed matrices in which ranges from 1 to 10, are listed in Table 1.
Table 1The statistics of SV sequence
1 | 90.504 | |||||||||
2 | 81.760 | 38.811 | ||||||||
3 | 84.815 | 29.946 | 10.032 | |||||||
4 | 74.023 | 50.203 | 12.827 | 5.171 | ||||||
5 | 86.169 | 23.586 | 10.834 | 9.190 | 2.781 | |||||
6 | 86.219 | 22.220 | 12.741 | 5.812 | 3.036 | 2.127 | ||||
7 | 86.902 | 20.299 | 12.886 | 5.584 | 4.185 | 2.696 | 2.047 | |||
8 | 85.140 | 19.265 | 12.924 | 4.710 | 3.284 | 1.967 | 1.802 | 1.686 | ||
9 | 86.763 | 20.483 | 12.627 | 5.399 | 3.498 | 2.383 | 1.991 | 1.578 | 0.680 | |
10 | 86.557 | 20.019 | 13.602 | 5.169 | 3.253 | 2.101 | 1.718 | 1.503 | 0.673 | 0.522 |
Based on the row information summarized in Table 1, it is clear that SV decreases gradually with the increasing of column number, and it means that the information corresponding to SV also decreases gradually.
According to Eq. (4), the weight coefficient of SV is defined to reflect the information proportion. The statistics of weight coefficient are shown in Table 2.
In this paper, we set 0.01 as the threshold for the choice of value. The SV whose weight coefficient is less than 0.01 (1 %) will be considered to be meaningless, because the corresponding information is small enough to be ignored. From the statistics in Table 2, we can notice that, as the column number reaches up to 9, the weight coefficients highlighted in bold will be less than the threshold value 0.01. Therefore, 8 was selected to construct a matrix for DCT-SV cross entropy.
Table 2The weight coefficients statistics for SV
1 | 1 | |||||||||
2 | 0.678 | 0.322 | ||||||||
3 | 0.680 | 0.240 | 0.080 | |||||||
4 | 0.520 | 0.353 | 0.090 | 0.036 | ||||||
5 | 0.650 | 0.178 | 0.082 | 0.069 | 0.021 | |||||
6 | 0.652 | 0.168 | 0.096 | 0.044 | 0.023 | 0.016 | ||||
7 | 0.646 | 0.151 | 0.096 | 0.041 | 0.031 | 0.020 | 0.015 | |||
8 | 0.651 | 0.147 | 0.099 | 0.036 | 0.025 | 0.016 | 0.014 | 0.013 | ||
9 | 0.641 | 0.151 | 0.093 | 0.040 | 0.026 | 0.018 | 0.015 | 0.012 | 0.005 | |
10 | 0.641 | 0.148 | 0.101 | 0.038 | 0.024 | 0.016 | 0.013 | 0.011 | 0.005 | 0.004 |
3.4.2. Results of DCT-SV cross entropy
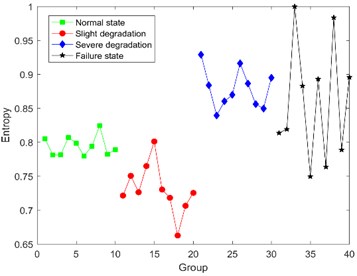
Under the condition that 8, the DCT-SV cross entropy results of test sample in three load conditions are shown in Fig. 9.
Fig. 9 shows that DCT-SV cross entropy keep a clear uptrend with the degradation in all three load conditions, and there are also clear discrimination from normal state to failure state. Furthermore, it also has a good performance to discover slight degradation.
For further analysis, Bispectral analysis is adopted to extract the degradation feature for the following comparison. The calculation results of Bispectral singular entropy are shown in Fig. 10 [28].
Table 3Comparison between DCT-SV cross entropy and Bispectral singular entropy
Feature extraction method | Normal state | Slight degradation | Severe degradation | Failure state |
DCT-SV cross entropy (0 N·m) | 0.052±0.005 | 0.145±0.044 | 0.279±0.060 | 0.898±0.101 |
DCT-SV cross entropy (0.1 N·m) | 0.012±0.006 | 0.150±0.024 | 0.386±0.082 | 0.856±0.144 |
DCT-SV cross entropy (0.2 N·m) | 0.057±0.043 | 0.209±0.071 | 0.502±0.076 | 0.855±0.145 |
Bispectral singular entropy (0 N·m) | 0.721±0.029 | 0.748±0.077 | 0.896±0.050 | 0.864±0.137 |
Bispectral singular entropy (0.1 N·m) | 0.719±0.027 | 0.679±0.031 | 0.888±0.089 | 0.843±0.157 |
Bispectral singular entropy (0.2 N·m) | 0.802±0.022 | 0.732±0.069 | 0.884±0.045 | 0.875±0.125 |
Fig. 9The calculation results of DCT-SV cross entropy
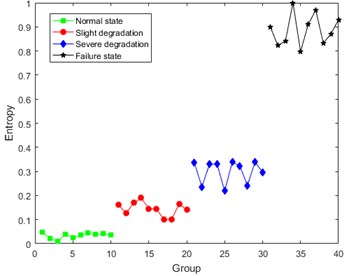
a) 0 N·m
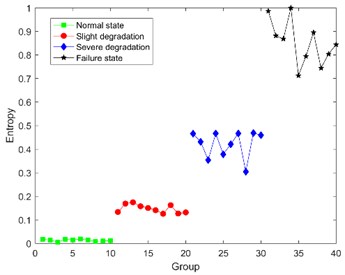
b) 0.1 N·m
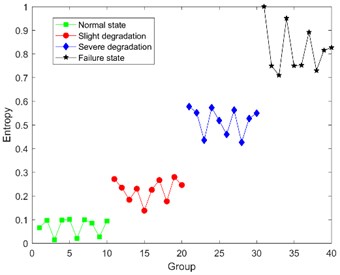
c) 0.2 N·m
Fig. 10The results of Bispectral singular entropy
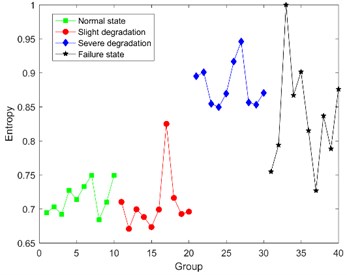
a) 0 N·m
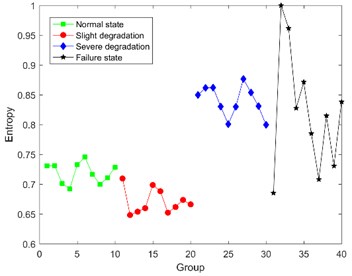
b) 0.1 N·m
c) 0.2 N·m
Fig. 10 shows that it seems reasonable that the Bispectral singular entropy values of the latter two states are slightly higher than that of the former two states. But there is a wrong logic that the average entropy value of normal state is higher than the one of slight degradation, and the values in severe degradation and failure state are overlapped and indistinguishable. Consequently, Bispectral singular entropy can’t be used as the feature to indicate different degradation state for ultrasonic motor.
In order to verify the superiority of the proposed method, comparison between DCT-SV cross entropy and Bispectral singular entropy are listed in Table 3.
From Table 3, it is obvious that not only DCT-SV cross entropy keeps better correlation with degradation, but also the fluctuation range of DCT-SV cross-entropy is smaller than that for Bispectral singular entropy.
3.5. Anti-noise performance of degradation feature
In order to verify the anti-noise performance of the proposed DCT-SV cross entropy, a numerical simulated noise was added to the measured MEV signal. There were five kinds of signal-to-noise ratio including 10 dB, 20 dB, 30 dB, 40 dB, 50 dB, and the one of the original measured signal was marked as “∞”. The DCT-SV cross entropy results with simulated noise are shown in Fig. 11.
The analysis of Fig. 11 shows that DCT-SV cross entropy values of the four degradation states get closer with the increasing noise intensity. The main reason for this situation is that, to some extent, the noise cancels out the complexity difference of DCT coefficients among the states. However, benefiting from the anti-noise ability of SVD, the proposed feature still keeps a good performance to follow the degradation trend from normal state to failure state [29].
Fig. 11DCT-SV cross entropy of the signal with simulated noise
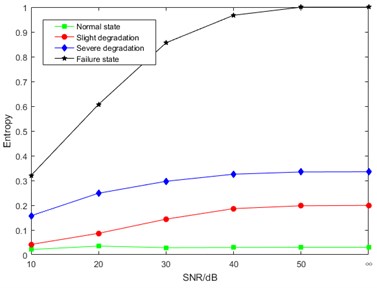
a) 0 N·m
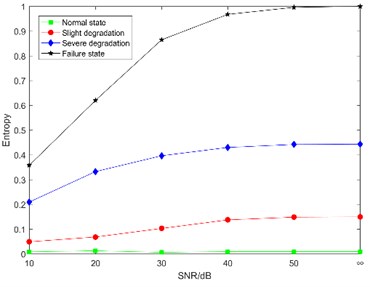
b) 0.1 N·m
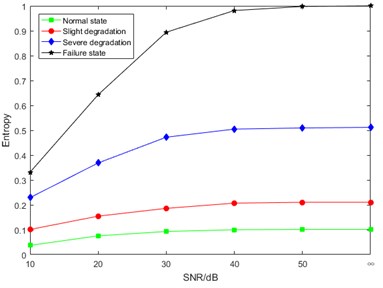
c) 0.2 N·m
4. Conclusions
A degradation feature extraction method for piezoelectric ceramic of ultrasonic motor was proposed based on DCT-SV cross entropy, which was verified by experiment results analysis. The conclusions can be drawn as follows:
1) DCT coefficients of MEV signal can sensitively reflect the energy change in stator vibration of ultrasonic motor, and the coefficients can be used to extract the degradation feature for piezoelectric ceramic.
2) DCT-SV cross entropy as the degradation feature, is sensitive to the piezoelectric ceramic degradation state changing, and has a good performance to discover early degradation. It is meaningful for the condition-based maintenance of ultrasonic motors.
3) DCT-SV cross entropy presents a satisfactory anti-noise performance which has been verified by the simulated noise.
References
-
Stepanenko D. A., Minchenya V. T. Development and study of novel non-contact ultrasonic motor based on principle of structural asymmetry. Ultrasonics, Vol. 52, Issue 7, 2012, p. 866-872.
-
Li X., Yao Z. Y., Zhou S. L., Lv Q. B., Liu Z. Dynamic modeling and characteristics analysis of a modal-independent linear ultrasonic motor. Ultrasonics, Vol. 72, 2016, p. 117-127.
-
Zhou Y. T., Kim T. W. A moving thermal dielectric crack in piezoelectric ceramics with a shearing force applied on its surface. Applied Mathematical Modelling, Vol. 63, 2018, p. 1-17.
-
Viun O., Komarov A., Lapusta Y., Loboda V. A polling direction influence on fracture parameters of a limited permeable interface crack in a piezoelectric bi-material. Engineering Fracture Mechanics, Vol. 191, 2018, p. 143-152.
-
Zhao Y. F., Guo Y. G., Miao T. C., Zhao M. B., Fan C. Y. An iterative approach for analyzing cracks in two-dimensional piezoelectric media with exact boundary conditions. Engineering Analysis with Boundary Elements, Vol. 90, 2018, p. 76-85.
-
Wang Z. W., Zhang Q. H., Xiong J. B., Xiao M., Sun G. X., He J. Fault diagnosis of a rolling bearing using wavelet packet denoising and random forests. IEEE Sensors Journal, Vol. 17, Issue 17, 2017, p. 5581-5588.
-
Hu Q., Qin A. S., Zhang Q. H., He J., Sun G. X. Fault diagnosis based on weighted extreme learning machine with wavelet packet decomposition and KPCA.IEEE Sensors Journal, Vol. 18, Issue 20, 2018, p. 8472-8483.
-
Li Y. B., Xu M. Q., Liang X. H., Huang W. H. Application of bandwidth EMD and adaptive multiscale morphology analysis for incipient fault diagnosis of rolling bearings. IEEE Transactions on Industrial Electronics, Vol. 64, Issue 8, 2017, p. 6506-6517.
-
Yu X., Dong F., Ding E. J., Wu S. P., Fan C. Y. Rolling bearing fault diagnosis using modified LFDA and EMD with sensitive feature selection. IEEE Access, Vol. 6, 2018, p. 3715-3730.
-
Zhao H. Y., Wang J. D., Jay L., Li Y. A compound interpolation envelope local mean decomposition and its application for fault diagnosis of reciprocating compressors. Mechanical Systems and Signal Processing, Vol. 110, 2018, p. 273-295.
-
Li D. Z., Wang W., Ismail F. An enhanced bispectrum technique with auxiliary frequency injection for induction motor health condition monitoring. IEEE Transactions on Instrumentation and Measurement, Vol. 64, Issue 10, 2015, p. 2679-2687.
-
Hassan M., Bayoumi A., Shin Y. Quadratic-nonlinearity index based on bicoherence and its application in condition monitoring of drive-train components. IEEE Transactions on Instrumentation and Measurement, Vol. 63, Issue 3, 2014, p. 719-728.
-
Sai N., Patil R., Sangle S., Nemade B. Truncated DCT and decomposed DWT SVD features for image retrieval. Procedia Computer Science, Vol. 79, 2016, p. 579-588.
-
Sun J., Li H. R., Xu B. H. The morphological undecimated wavelet decomposition – discrete cosine transform composite spectrum fusion algorithm and its application on hydraulic pumps. Measurement, Vol. 94, 2016, p. 794-805.
-
Wang Y. K., Huang Z. J., Zhao X. C., Zhu Y., Wei D. H. A novel de-noising method based on discrete cosine transform and its application in the fault feature extraction of hydraulic pump. Journal of Shanghai Jiaotong University, Vol. 21, Issue 3, 2016, p. 297-306.
-
Kang M., Kim J. M. Singular value decomposition based feature extraction approaches for classifying faults of induction motors. Mechanical Systems and Signal Processing, Vol. 41, Issues 1-2, 2013, p. 348-356.
-
Yang Q., Hu C. Z., Zheng N. G. Data driven diagnosis of nonlinearly mixed mechanical faults in wind turbine gearbox. IEEE Internet of Things Journal, Vol. 5, Issue 1, 2018, p. 466-467.
-
Yang H. G., Lin H. B., Ding K. Sliding window denoising K-Singular value decomposition and its application on rolling bearing impact fault diagnosis. Journal of Sound and Vibration, Vol. 421, 2018, p. 205-219.
-
Liu Y. H., Yu Z. W., Zeng M., Zhang Y. S. LLE for submersible plunger pump fault diagnosis via joint wavelet and SVD approach. Neurocomputing, Vol. 185, 2016, p. 202-211.
-
Zhao H. Y., Wang J. D., Han H., Gao Y. Q. A feature extraction method based on HLMD and MFE for bearing clearance fault of reciprocating compressor. Measurement, Vol. 89, 2016, p. 34-43.
-
Ai Y. T., Guan J. Y., Fei C. W., Tian J., Zhang F. L. Fusion information entropy method of rolling bearing fault diagnosis based on n-dimensional characteristic parameter distance. Mechanical Systems and Signal Processing, Vol. 88, 2017, p. 123-136.
-
Ye J. Fault diagnosis of turbine based on fuzzy cross entropy of vague sets. Expert Systems with Applications, Vol. 36, Issue 4, 2009, p. 8103-8106.
-
An G. Q., Li H. R. Degradation state identification of cracked ultrasonic motor by means of fault feature extraction method. Shock and Vibration, Vol. 2019, 2019, p. 5180590.
-
Yang E. H., Yu X., Meng J., Sun C. Transparent composite model for DCT coefficients: design and analysis. IEEE Transactions on Image Processing, Vol. 23, Issue 3, 2014, p. 1303-1316.
-
Fan X. Q., Zhu Y. L. Faulty phase selection based on high-order multi-resolution singular entropy for high voltage transmission lines. Electric Power Automation Equipment, Vol. 31, Issue 4, 2011, p. 50-54.
-
Li Z. F., Gu J. F., Zhuang H. Y., Kang L., Zhao X. Y., Guo Q. Adaptive molecular docking method based on information entropy genetic algorithm. Applied Soft Computing, Vol. 26, 2015, p. 299-302.
-
Zhao X. Z., Chen T. J., Ye B. Y. Processing of milling force signal and isolation of state information of milling machine based on singular value decomposition. Chinese Journal of Mechanical Engineering, Vol. 43, Issue 6, 2007, p. 169-174.
-
Li F. Q., Liu G. H., Wu Z. G. Experimental study of structural damage based on bispectral analysis and singular value decomposition. Journal of Zhejiang University. Engineering Science, Vol. 46, Issue 10, 2012, p. 1872-1879.
-
Jiang H. M., Chen J., Dong G. M., Liu T., Chen G. Study on Hankel matrix-based SVD and its application in rolling element bearing fault diagnosis. Mechanical Systems and Signal Processing, Vol. 52, Issue 1, 2015, p. 338-359.
Cited by
About this article

This project is supported by National Natural Science Foundation of China (Grant No. 51877070), China Postdoctoral Science Foundation (Grant No. 2017M623404), Natural Science Youth Foundation of Hebei (Grant No. E2017208086) as well as Science and Technology Research Youth Foundation for Hebei College (Grant No. QN2017329).
An Guoqing provides ideas, algorithms, and the preparation of papers. Song Kaiyao and Li Rui participated in the data collection. Sun Huiqin provided the procedures needed to collect data. Li Hongru carried out the construction of the experimental platform.
