Abstract
Aiming at the problem that some traditional high voltage circuit breaker fault diagnosis methods were over-dependent on subjective experience, the accuracy was not very high and the generalization ability was poor, a fault diagnosis method for energy storage mechanism of high voltage circuit breaker, which based on Convolutional Neural Network (CNN) characteristic matrix constructed by sound-vibration signal ,was proposed. In this paper, firstly, the morphological filtering was used for background noise cancellation of sound signal, and the time scale alignment method based on kurtosis and envelope similarity were proposed to ensure the synchronism of the sound-vibration signal. Secondly, the Pearson correlation coefficient was used to construct two-dimensional image characteristic matrix for the expanded sound-vibration signal. Finally, the characteristic matrix was trained by utilizing CNN. Local Response Normalization (LRN) and core function decorrelation were utilized to improve the structure of CNN model, which reduced the bad impact of large data fluctuation of energy storage process on the diagnostic accuracy of circuit breaker energy storage mechanism. Compared with the traditional method, the proposed method has obvious advantages, whose total accurate rate up to 98.2 % and generalization performance is excellent.
Highlights
- The combination of sound signal and vibration signal
- CNN optimization model based on Local Response Normalization (LRN) and core function decorrelation
- Signal preprocessing based on morphological denoising and time scale alignment method
- data expansion to obtain the large amount of data
- Pearson correlation coefficient to construct sound-vibration signal characteristic matrix for CNN
1. Introduction
As an important control and protection device in power system, reliable operation of high voltage circuit breaker directly affects the security and stability of power system, so the fault diagnosis of circuit breaker is crucial [1, 2]. Before switching on and off, the spring operating mechanism of circuit breaker needs to sequentially control the energy storage motor, gear transmission device, spring energy storage medium, stop plate, and limit switch to realize the conversion, transmission and storage of electrical energy from power grid to mechanical energy of energy storage spring. At present, the fault diagnosis research of circuit breaker concentrates on the process of opening and closing: using control coil current, insulation tie rod displacement, and vibration signal to identify mechanical faults [3-5]. Those researches focus on problems occurring in the operation process of circuit breaker itself, while the research on the faults of energy storage process is not deep enough, lacking quantitative criteria. How to discover the types of energy storage faults and their occurrence, development, and the rule of change is worthy of further study.
The existing fault diagnosis methods for circuit breakers are mainly based on vibration signals, which are characterized by abundant state information and high signal-to-noise ratio [6]. However, in a practical application, there will be a saturation phenomenon when the amplitude is large, and it is easy to produce high-frequency shock failure caused by the cumulative effect of charge [7]. Sound signal can effectively avoid saturation failure due to the wide measurement frequency band, and the installation of the pickup device is convenient, the signal is less affected by the installation mode [8, 9]. Sound signal and vibration signal are homologous signals, which are both generated by the vibration of circuit breaker components. Their homologous complementary characteristics can be utilized and give full play to their respective advantages to jointly diagnose the fault of circuit breaker energy storage mechanism.
For the sound-vibration combination method, in literature [7], the improved ensemble empirical mode decomposition (EEMD) is used to decompose the sound-vibration signal, and then the two-dimensional spectral entropy of the decomposed IMF is obtained as the feature vector for fault diagnosis. Literature [10] uses complementary ensemble empirical mode decomposition (CEEMD) algorithm to decompose sound-vibration signals and extracts the energy coefficient, sample entropy and power spectral entropy of IMF components as feature vectors for fault diagnosis. Literature [11] uses fuzzy peak optimization C-means clustering and SVM to diagnose sound-vibration signals. Although the above methods have achieved some achievements, there are still some existing problems:
1) Previous studies have not considered the difference between sound and vibration signals, but simply combined the two, resulting in low diagnostic accuracy.
2) The method of feature extraction relies on manual selection and expert knowledge, which is over-subjective and easy lead to the omission of fault information [12]. And the extracted features need to be screened before selecting the appropriate classifier for fault classification. The appropriate features and methods need to be selected according to different situations, so the generalization ability is poor.
With the continuous development of deep learning theory, as a typical deep learning algorithm, CNN has strong feature self-learning ability, good adaptability and parallel processing ability [13-15]. It has gained some certain advantages in fault diagnosis of mechanical equipment. Literature [16] converts vibration signal into frequency domain signal by fast Fourier transform, and then uses one dimensional convolution neural network (1DCNN) to diagnose fault after pre-treatment. In literature [17], The researcher take the vibration signal as input directly, uses 1DCNN to extract features, and faults are classified by soft-max regression model. Literature [18] uses EEMD to decompose vibration signals, then uses Hilbert transform to extract fault features, and uses CNN to realize fault identification. The above researches are all based on CNN fault diagnosis of vibration signal, while the fault diagnosis method combining sound signal and CNN has not been reported in any literature. In addition, the above research is all based on 1DCNN for fault diagnosis of single signal. The diagnostic process is cumbersome and the accuracy is not high, which fails to maximize CNN's self-learning ability.
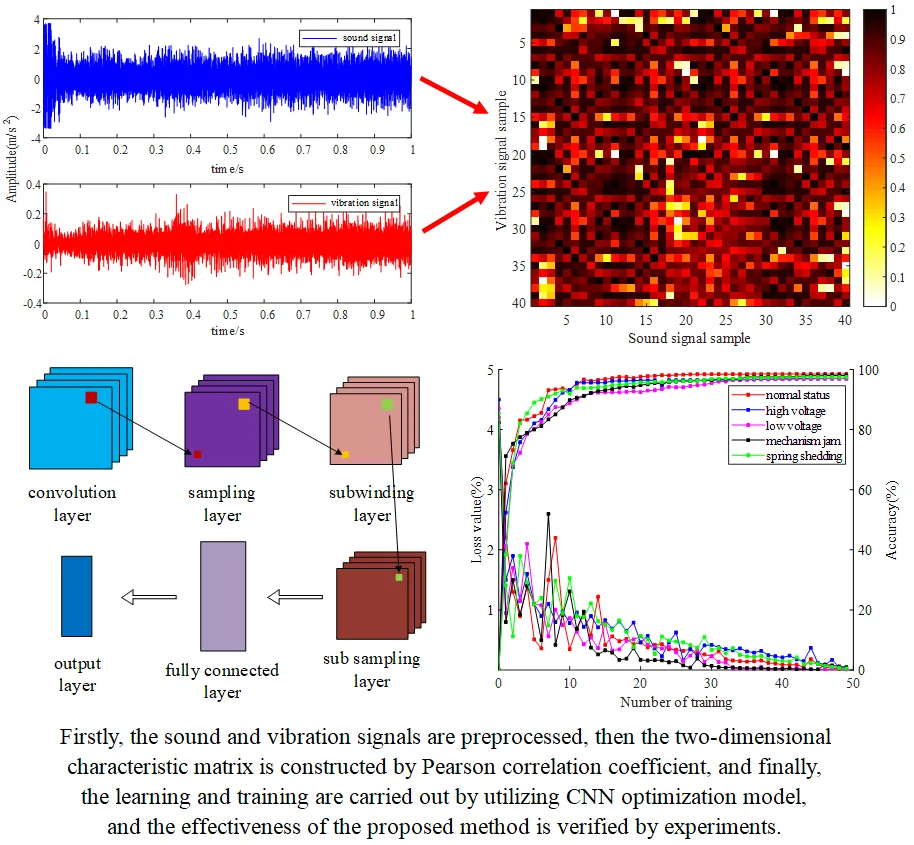
To solve these problems, this paper presents a fault diagnosis method of circuit breaker energy storage mechanism with CNN based on characteristic matrix constructed by sound-vibration signal. The Pearson correlation coefficient is used to construct a two-dimensional sound-vibration joint characteristic matrix, which is used as the input of CNN for fault diagnosis.
2. Construction methods of CNN characteristic matrix by sound-vibration signal
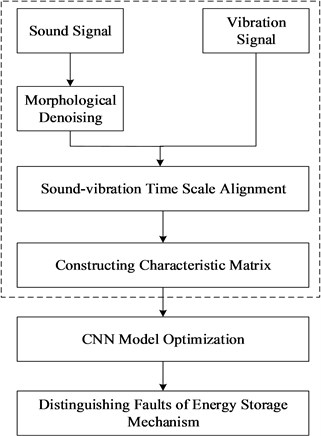
Because of the large interference of the background noise on the sound signal, morphology is used to remove the background noise firstly. Then the collected sound and vibration signals are aligned with time scales based on kurtosis and envelope similarity. After time alignment, overlapping data expansion is used to increase the dimension of matrix. Finally, the CNN characteristic matrix of sound-vibration signals is constructed by Pearson correlation coefficient to identify fault.
2.1. Circuit breaker machinery fault diagnosis process
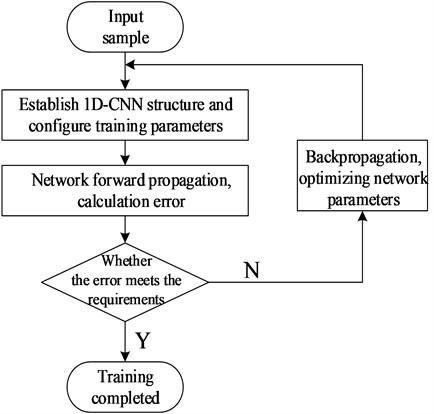
There is a close relationship between sound-vibration signals in different states of energy storage process and mechanical state [19]. The implicit relationship between the two can be reflected accurately by the sound-vibration signal characteristic matrix, so the fault diagnosis of circuit breaker can be realized from that. The diagnostic flow chart is shown in Fig. 1.
Fig. 1Fault diagnosis flow chart of circuit breaker energy storage mechanism
2.2. Morphological denoising of sound signals
Because of the selection of singular value and wavelet threshold for Singular value decomposition (SVD) and wavelet decomposition, denoising effects are not ideal. Based on the geometric characteristics of sound signals in energy storage process, morphology is transformed by structural elements to achieve signal matching, signal extraction, detail preservation, and noise suppression. It only needs algebraic operation without calculating frequency domain information and has a considerable speed[20]. Moreover, the highly efficient non-linear filtering function is very suitable for the noise signal filtering in the energy storage process of circuit breakers.
Fig. 2Comparison of results before and after denoising
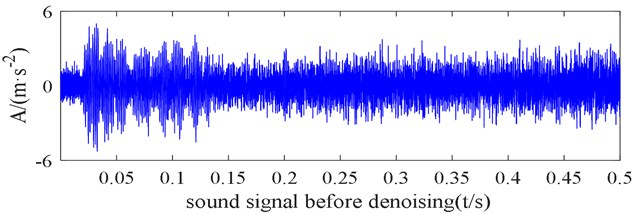
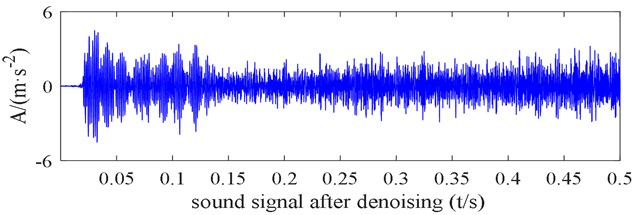
Open and close operations smooth signals in different ways. The open operation can be used to filter peak noise and remove signal edge burrs. The close operation can smooth and suppress trough noise of signals. In this paper, according to the non-stationarity characteristics of the sound signal in the energy storage process of circuit breaker, a hybrid filter based on morphological open-close and close-open operation is adopted. Elliptic and diamond elements are selected. The maximum width of the signal is 1/40-1/10, is set to 12, is set to 5. The noise removal effect of the sound signal in the case of low voltage of the energy storage mechanism is shown in Fig. 2.
From Fig. 2 and verification of multiple sets of actual signals, it can be seen that the background noise of the sound signal is significantly reduced after denoising; the details of the original signal are preserved. After calculation, the signal-to-noise ratio of the original signal is increased by 18.2 %, and the mean square error is reduced.
2.3. Time scale alignment
Because of the difference of the transmission speed of the sound-vibration signal and the position of the sensor, when the circuit breaker begins to store energy, the collected sound wave will lag the vibration signal, as shown in Fig. 3.
Fig. 3Diagram of vibration advance sound signal
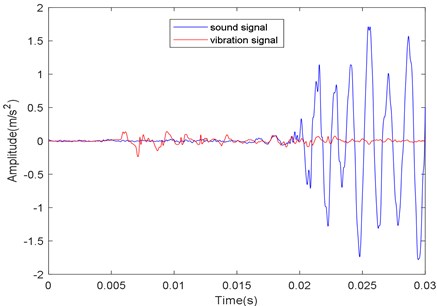
In order to distinguish the fault of the energy storage mechanism of circuit breaker accurately, it is necessary to analyze and compare the sound and vibration signals of the mechanism at the same time. As a dimensionless parameter, kurtosis is particularly sensitive to shock signal, so it can be used to detect the peak of the envelope of sound-vibration signals. Sound-vibration signals can be divided into equal parts, and the kurtosis of each part can be calculated. By comparing the kurtosis values of each part of the signal, the signal segments with obvious differences in kurtosis values can be found to confirm the time segments of the change. The formula of kurtosis is as follows:
In the formula, is the instantaneous value of the sound-vibration signal envelope, is the envelope mean, is the probability density and is the standard deviation.
The Minkowski formula (as Eqs. (2)) is used to judge the similarity in time segments, in order to find the corresponding moment of sound and vibration signals. The similarity is judged by the q root of the sum of q-power of the absolute difference between the envelope of sound and vibration signals. When the highest similarity moment is found, the initial moment of sound signal minus the initial moment of vibration signal is , and the alignment can be achieved by advancing with sound signals:
In the formula, and are the data points of sound and vibration signals, and is the distance adjustment parameter.
2.4. Overlapping data enlargement
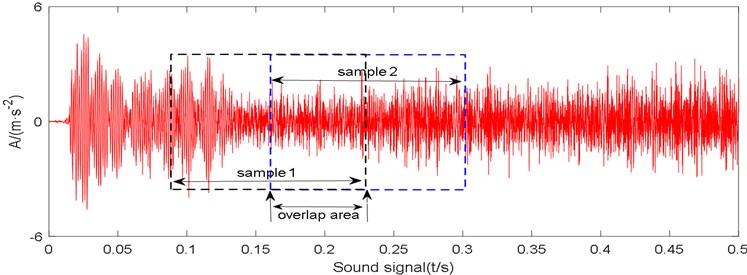
Using overlapping data enlargement can completely preserve the correlation of adjacent samples, avoid the loss of features caused by sample truncation. It provides a large amount of data for the construction of sound-vibration joint characteristic matrix, increases the dimension of characteristic matrix, lays a foundation for accurate fault diagnosis with CNN.
For signal whose length is , the sample length is and the overlap rate is . The method of expansion and segmentation is as follows:
(1) Find the maximum number of separable samples under the current signal length: , is the downward integer operator.
(2) Find each segmentation sample. The location of the -th sample in the original signal is shown as follows:
is the segmented sample data. The expansion diagram is shown in Fig. 4.
Too short sample segmentation length can improve the convergence speed of the model and save training time, but it is easy to cause the lack of non-linear feature information; Too long sample segmentation length will affect the convergence speed and the real-time diagnosis of the model. Through experimental analysis, set sample length to 1024 and set to 0.5.
Fig. 4Data expansion diagram
2.5. Construction of sound-vibration joint matrix
The rows and columns of the CNN characteristic matrix represent the corresponding values of the sampling points, and the number of samples and parameters of the sound-vibration signals are the same. When the motor fault occurs, the value of sound and vibration signals will also change. The complex and diverse relationship reflects the corresponding fault. Pearson correlation coefficient is used to describe the correlation of sound-vibration signal, and the value of correlation coefficient is used as the matrix element.
Pearson correlation coefficient is used to measure the relationship between two variables. It is uncorrelated with the specific value of the variable and is a non-parametric statistic. If the mean of sound-vibration signals tends to be greater or less than their respective mean values at the same time, the correlation coefficient is positive; If they tend to fall on the opposite side of their mean values at the same time, the correlation coefficient is negative. The calculation is as follows:
Formula: and separately represents the values of sampling points of sound-vibration signals.
Pearson correlation coefficient is in the range of [–1, 1], so it will be normalized and filled in the characteristic matrix. In order to facilitate the observation of the values of the elements of the matrix, 40 consecutive sample data collected under high energy storage voltage and low energy storage voltage are selected to calculate the characteristic matrix and draw two-dimensional images as Fig. 5.
From Fig. 4, we can observe the correlation of sound-vibration signals when the storage voltage of circuit breaker is high and low, but the fault type cannot be identified directly from the above two-dimensional images. In this situation, we can use the CNN’s powerful feature extraction and identification ability to diagnose the fault.
Fig. 5Two-dimensional images of the characteristic matrix
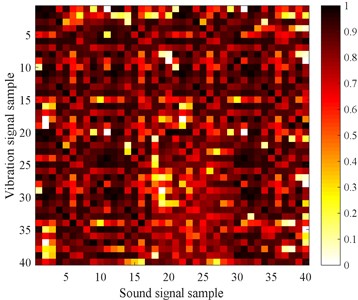
a) High energy storage voltage
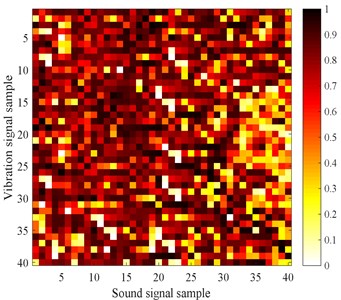
b) Low energy storage voltage
3. Diagnostic methods and optimization of CNN
3.1. Diagnostic principle of CNN
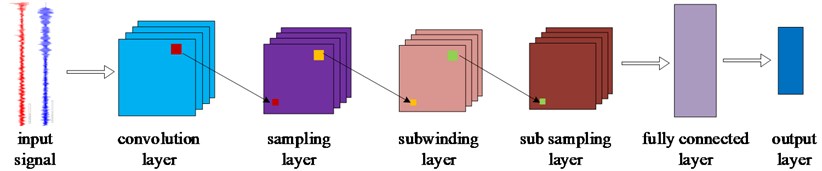
As a multi-layer neural network structure, CNN consists of input layer, convolution layer, pooling layer, full connection layer, and output layer, as shown in Fig. 6.
In each layer, a weight matrix and a characteristic matrix are defined to convolute. The convolution results of the former layer will be output after the activation function operation, and become the neurons that construct the corresponding features of the next layer.
The convolution layer convolutes input data through convolution kernels, and constructs feature vectors using non-linear activation functions. The same convolution kernel shares parameters in the convolution process to obtain a class of features. The calculation process is as follows:
Among them, represents the input of layer , represents the input feature vector, represents the network of layer , represents the convolution core, and represents the offset of the convolution core. Usually, the rectified linear unit (ReLU) is chosen as the non-linear activation function, which can make a part of the output of neurons be 0, reduce the interdependence of parameters, improve the sparsity of the network, and effectively suppress the over-fitting problem. The calculation of ReLU is as follows:
The formula is the activation value of and represents the output value of the convolution operation.
The pooling layer contains average pooling and maximum pooling. The dimensionality reduction and feature extraction of input data are realized by pooling kernel and scaling mapping. Its transformation function is as follows:
In the formula, is the width of the convolution core, is the value of the -th neuron in the -th feature of the -th layer, and is the corresponding value of the -th neuron.
The output layer of CNN connects the output of the last pooling layer, and then often uses the Soft-Max classifier to solve the multi-classification problem. The model is as follows:
In the formula, is the deviation vector, is the characteristic vector and is the weight matrix.
Fig. 6Structural sketch of convolutional neural network
3.2. Fault simulation and parameter setting
The circuit breaker model used in the experiment is ZN63-12, rated voltage is 12 kV. Energy storage motor model is HDZ-22060B, rated voltage is 220 V, energy storage time under rated voltage is less than 15 seconds. The piezoelectric sensor (CK 8605) with the frequency range 1-10000 Hz and waterproof pickup (WM-025N) with the frequency range of 20-20 kHz are selected, and the sampling rate is set to 40 kHz.
Because of the complexity of energy storage mechanism and energy storage control process of circuit breaker, power supply fluctuations, drive mechanism jams, shedding of the energy storage spring, and failure of the limit switch may occur, ultimately leading to the circuit breaker cannot complete opening and closing operation normally. Therefore, the experiments of normal energy storage, high energy storage voltage, low energy storage voltage, mechanism jamming, and spring shedding are carried out respectively, and sound-vibration signals are collected under different states. Changing the voltage level in the energy storage process of circuit breaker can simulate the state of high voltage and low voltage. The wooden stick is used to clamp the rotating shaft mechanism to increase the jamming of the damp can simulate mechanism jam. Loosening the fastening screw at one end of circuit breaker spring can simulate spring shedding. The field test drawings are as for Fig. 7.
Fig. 7Field fault simulation
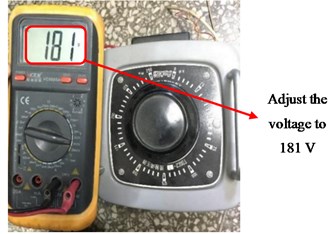
a) Low voltage
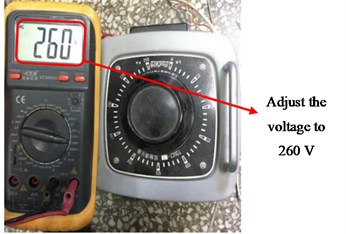
b) High voltage
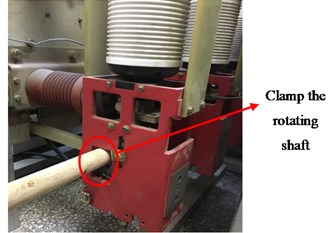
c) Mechanism jam
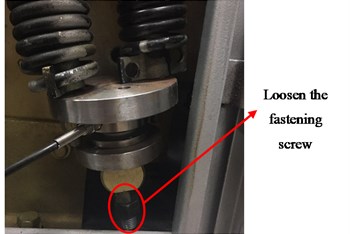
d) Spring shedding
Through many experiments, the parameters of the model are set as follows: The number of CNN convolution layers is 2, and the parameters are set to 32@2×2 and 64@2×2. The size of the maximum pooling layer is 2×2 and the step size is 2. The nodes of the two full connection layers are set to 256 and 64. Using RMSprop optimizer, the initial learning rate is set to 0.03, the attenuation rate is 0.99; the number of iterations is 50, Dropout is set to the full connection layer, and its coefficient is 0.5. The training steps of the model are shown in Fig. 8.
Fig. 8Model training diagram
3.3. CNN model optimization
The convolutional neural network has a strong generalization ability because of its special structure. However, for circuit breakers, the mechanical components start, move and stop in a certain order to produce a series of composite signals superimposed by shock waves in the process of energy storage. Due to the large variation of each measurement signal, the generalization performance and accuracy of CNN are limited.
There is a correlation between the convolution cores of CNN, and the smaller the correlation is, the more comprehensive the features of convolution extraction, the better generalization and accuracy [21]. In order to improve generalization and accuracy, this paper decomposes the kernel function into multi-resolution wavelet coefficients by wavelet decomposition, and chooses the wavelet decomposition coefficients in the orthogonal direction to deal with the error modification of convolution kernel to remove the correlation of the kernel function. At the same time, a local response normalization (LRN) is added after each convolution-pooling layer to reduce the bad impact of the too many model parameters. The LRN layer can imitate the biological “side inhibition” mechanism and make the larger response value larger. The response normalization is expressed as [22]:
In the formula: denotes the number of adjacent mapping kernels passing through the same spatial location, denotes the total number of kernels in this layer, denotes the output of ReLU non-linear neurons of the -th core at location (, ), and , , denotes the verification set hyperparameters with values of 2, 0.0002 and 0.5, respectively.
In order to avoid over-fitting, a Early-Stopping mechanism is introduced into the full-connection layer of the model, whose coefficients are 0.5 and 0.01, respectively. The model structure of this paper is shown in Table 1.
Table 1CNN structure
Layer name | Characteristic description |
Convolution layer 1 | Convolutional Kernel (32) Decorrelation |
Pool 1 | 2×2, maximum pooling |
LRN 1 | Local Response Normalization |
Convolution layer 2 | Convolutional Kernel (64) Decorrelation |
Pool 2 | 2×2, maximum pooling |
LRN 2 | Local Response Normalization |
Full connection 1 | Early-Stopping (256) |
Full connection 2 | Early-Stopping (64) |
4. Experimental results and analysis validation
4.1. Experimental result
The model uses Python and Tensorflow as software, Windows 10 as operating system, Intel (R) Core (TM) i7-6850 KCPU as a processor, Nvidia Titan XP GPU as a accelerator, and 8 GB of running memory.
350 sets of data were collected for each kind of state, 220 sets of data for training and 130 sets of data for testing, each group of data contains 50000 sampling points. For the ZN63-12 type circuit breaker, the time required from the output torque of the switching energy storage motor to maintain the energy is 10 seconds. Therefore, if the sampling frequency is set to 40 kHz, 40 0000 points can be obtained in one energy storage cycle of the circuit breaker, which constitutes eight 96×96 characteristic matrices. The model was trained 50 times, and the minimum square error (MSE) was used as the loss function. The formula was as follows:
In the formula, is the prediction of the -th sample and is the real classification of the -th sample. In order to verify the learning effect, principal component analysis (PCA) is used to extract the first two principal components to visualize the learning characteristics of the penultimate layer (full connection layer), so that the first largest variance of data projection is on the first coordinate (called the first principal component) and the second one is on the second coordinate (the second principal component). As shown in Fig. 9.
Fig. 9Learning features visualization
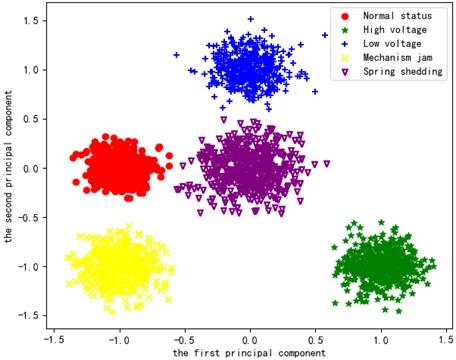
From Fig. 9, we can see that the learning characteristics of each state of the model are clustered in the corresponding regions, which shows that the model has a good distinction.
Soft-Max is used as a classifier to classify, and the recognition effect is shown in Fig. 10 (the upper part of the graph refers to the accuracy, the lower part refers to the loss value):
Fig. 10Model accuracy and loss
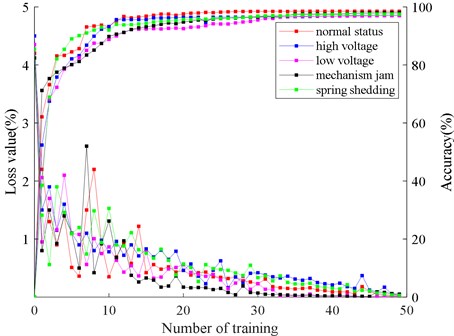
As can be seen from the Fig. 10, with the increase of training times, the recognition accuracy of the model increases gradually, and tends to be stable after 35 training times, and the accuracy no longer increases. Meanwhile, the loss value decreases gradually, and the training effect of convolution neural network is constantly optimized. Although 50 training times are set in this paper, the accuracy no longer increases after 40 iterations, and the loss value is reduced to the lowest. Because the Early-Stopping mechanism is introduced into the model, the training of the model is stopped when the accuracy and loss values of the model are not changed significantly, which effectively avoids the phenomenon of over-fitting.
After training, the total classification accuracy of the model reaches 98.2 %. It is proved that the fault diagnosis method based on sound-vibration signal to construct the CNN characteristic matrix can accurately reflect the operation status of energy storage mechanism. The diagnosis results are shown in Table 2.
Table 2Diagnostic results of CNN
Category | Normal status | High voltage | Low voltage | Mechanism jam | Spring shedding | Sum | Accuracy |
Normal status | 127 | 2 | 0 | 0 | 1 | 130 | 97.7 % |
High voltage | 1 | 128 | 1 | 0 | 0 | 130 | 98.5 % |
Low voltage | 0 | 1 | 128 | 1 | 0 | 130 | 98.5 % |
Mechanism jam | 1 | 0 | 2 | 126 | 1 | 130 | 96.9 % |
Spring shedding | 0 | 0 | 0 | 1 | 129 | 130 | 99.2 % |
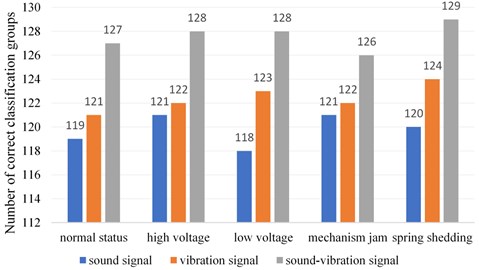
4.2. Diagnosis effect verification of sound-vibration signal
In order to verify the effect of sound-vibration signal, the diagnostic results are compared with those of single sound and single vibration signal, as shown in Fig. 11. (Single sound and vibration signal can be processed by the short-time Fourier transform mentioned in reference [15]. So the one-dimensional signals can be generated into time-frequency diagrams for CNN fault diagnosis).
The diagnostic accuracy of sound-vibration signals is 92.2 % and 94.2 % respectively, while that of sound-vibration signals is 98.2 %. It can be concluded that the combination of sound-vibration signals can reflect the state information of energy storage mechanism more comprehensively, the diagnostic effect has improved.
Fig. 11Comparison of three signal diagnosis results
4.3. Accuracy comparison with other models
In order to verify the accuracy of this algorithm compared with other algorithms, the EEMD algorithm mentioned in reference [18] is used to decompose the original signal. After extracting the features, LSTM, BP and SVM are used for diagnosis. The results are shown in Table 3.
Table 3 shows that the classification accuracy of CNN is much higher than that of other algorithms. The average accuracy of CNN is 10.6 % higher than LSTM, 12.5 % higher than BP and 12.2 % higher than SVM. This is mainly due to the unique structure of CNN, such as weight sharing, pooling, and full connection. These structures make CNN have the characteristics of scale displacement, invariance and region perception. They can learn features comprehensively and have strong fault tolerance, which make up for the shortcomings (such as inadequate feature learning and poor generalization ability) of other shallow classification algorithms.
Table 3Comparison of results from different diagnostic models
Diagnosis method | Diagnostic accuracy | |||||
Normal status | High voltage | Low voltage | Mechanism jam | Spring shedding | Average accuracy | |
LSTM | 88.2 % | 87.5 % | 89.5 % | 86.3 % | 86.5 % | 87.6 % |
BP | 84.2 % | 87.5 % | 86.5 % | 84.1 % | 86.3 % | 85.7 % |
SVM | 87.1 % | 85.5 % | 86.3 % | 86.0 % | 85.2 % | 86.0 % |
CNN | 97.7 % | 98.5 % | 98.5 % | 96.9 % | 99.2 % | 98.2 % |
4.4. Verification of generalization ability of this model
Due to the difference of data source and structure in the actual circuit breaker monitoring process, it is necessary to classify the fault samples with same type and different characterization. Therefore, the ZN63-12 type circuit breaker is replaced by ZN65-12, the sampling rate is changed from 40 kHz to 30 kHz, the ZD-530 type piezoelectric sensor and COTT-C2 waterproof pickup are used, and the position of the sensor is also changed at the same time.
In order to verify the generalization ability of the optimization model, the original model was used to compare the diagnosis results as Fig. 12.
Fig. 12Diagnostic effects comparison of different models
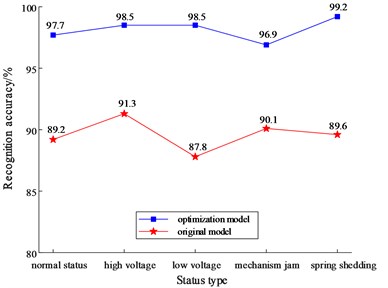
When the source of data, the setting of acquisition parameters and the location of sensors have changed, the overall diagnostic accuracy of the optimized CNN model in Fig. 12 is still reaching 97.5 %, which is much higher than that of the non-optimized model. It shows that the optimized model has stronger adaptability to fresh samples and better generalization ability.
Comparing the generalization ability of this model with other models, the diagnostic results are shown in Table 4.
Table 4Comparison of results with different diagnostic models
Method | LSTM | BP | SVM | CNN |
Accuracy 1 / % | 86.5 | 85.2 | 86.8 | 98.2 |
Accuracy 2 / % | 75.3 | 78.6 | 80.4 | 97.5 |
Note: is for raw data and accuracy 2 is for new variable data | ||||
From Table 4, we can see that the accuracy of traditional intelligent diagnosis methods is significantly reduced when data structures and sources are initiated, while the accuracy of CNN model is still very high because of its excellent generalization performance.
5. Conclusions
A new method for fault diagnosis of high voltage circuit breaker, based on CNN characteristic matrix constructed by sound-vibration signal, is proposed in this paper. Combining the sound-vibration signal with the deep learning algorithm can accurately identify multiple faults in different scenarios.
1) The combination of sound signal and vibration signal greatly improves the accuracy of fault identification of high voltage circuit breaker energy storage mechanism.
CNN has a strong learning ability that can extract fault features automatically from the characteristic matrix constructed by sound-vibration signals. the extracted features have complementary characteristics, so the method has obvious advantages compared with single signal diagnosis.
2) CNN fault diagnosis method is introduced to process the sound-vibration signal, and the model is improved according to the characteristics of energy storage process, which greatly improves the generalization performance of the model.
Since the CNN convolution layer extracts different features through convolution operations with different convolution kernels, the correlation between convolution kernels will affects the independence of feature extraction. Removing the correlation between kernel functions can extract features more comprehensively and effectively. at the same time, using the “lateral inhibition” idea to achieve local inhibition, creating a competitive mechanism for local neuronal activity, making the value with larger response even larger, and suppressing the feedback of other neurons with less response. the combination of the two can greatly improve the generalization performance of CNN model.
3) The fault identification method uses morphological denoising and time scale alignment method based on kurtosis and envelope similarity to clip the sound-vibration signals, data expansion to obtain the large amount of data required for training, and combines Pearson correlation coefficient to construct sound-vibration signal characteristic matrix for fault identification using CNN, which opens up a new way for the fault identification of circuit breaker energy storage mechanism.
References
-
Xu Guozheng Principle and Application of High Voltage Circuit Breakers. Tsinghua University Press, Beijing, 2000.
-
Song Youwen Discussion on several problems of line breaker failure protection. Power System Protection and Control, Vol. 36, Issue 23, 2008, p. 88-91.
-
Zhao Shutao, Wang Erxu Fault diagnosis of circuit breaker energy storage mechanism based on current-vibration entropy weight characteristic and grey wolf optimization-support vector machine. IEEE Access, Vol. 7, 2019, p. 86798-86809.
-
Zhao Shutao, Wu Chengjian, Li Ming, et al. Research on the testing method of mechanical characteristics of circuit breakers based on NCC-P-S optimization algorithm. Journal of Electrical Engineering of China, Vol. 37, Issue 14, 2017, p. 4265-4271.
-
Lin Jintao Research on Mechanical Fault Diagnosis Method of Circuit Breaker Based on Vibration Signal. Shandong University, 2019.
-
Jérôme Gilles Empirical wavelet transform. IEEE Transactions on Signal Processing, Vol. 61, Issue 16, 2013, p. 3999-4010.
-
Zhao Shutao, Zhang Pei, Shenlu, et al. Vibration-sound combined fault diagnosis method for high voltage circuit breakers. Journal of Electrical Technology, Vol. 29, Issue 7, 2014, p. 216-221.
-
Zhao Shutao, Wang Yaxiao, Li Mufeng, et al. Circuit breaker fault diagnosis method based on sound-vibration joint characteristic entropy. Journal of North China Electric Power University (Natural Science Edition), Vol. 43, Issue 6, 2016, p. 20-24.
-
Yang Yuanwei, Guan Yonggang, Chen Shigang, et al. Mechanical fault diagnosis method of high voltage circuit breaker based on sound signal. China Journal of Electrical Engineering, Vol. 38, Issue 22, 2018, p. 6730-6737.
-
Sun Shuguang, Yu Hao, Du Taihang, et al. Fault vibration diagnosis method of universal circuit breaker based on multi-feature fusion and improvement of QPSO-RVM. Journal of Electrical Technology, Vol. 32, Issue 19, 2017, p. 107-117.
-
He Mengyuan, Ding Qiaolin, Zhao Shutao, et al. Research of circuit breaker intelligent fault diagnosis method based on double clustering. IEICE Electronics Express, Vol. 14, Issue 17, 2017, p. 20170463.
-
Qu Jianling, Yu Lu, Yuan Tao, Tian Yanping, et al. an adaptive fault diagnosis algorithm for rolling bearings based on one-dimensional convolution neural network. Journal of Instruments and Instruments, Vol. 39, Issue 7, 2018, p. 134-143.
-
Ren Hao, Qu Jianfeng, Chai Yi, et al. Research status and challenges of in-depth learning in the field of fault diagnosis. Control and decision-making, Vol. 32, Issue 8, 2017, p. 1345-1358.
-
Huang Xinbo, Hu Xiaowen, Zhu Yongcan, et al. Fault diagnosis of high voltage circuit breakers based on convolutional neural network algorithm. Power automation equipment, Vol. 38, Issue 5, 2018, p. 136-140.
-
Liu Cheng Fault Diagnosis of High Voltage Circuit Breakers Based on Vibration Signal Processing. Xiamen Institute of Technology, 2017.
-
An Jing, Ai Ping, Xu Sen, et al. An intelligent fault diagnosis method for rotating machinery based on one-dimensional convolution neural network. Journal of Nanjing University (Natural Science), Vol. 55, Issue 1, 2019, p. 133-142.
-
Li Dongdong, Wang Hao, Yang Fan, et al. Fault detection of planetary gearbox of wind turbine based on one-dimensional convolution neural network and Soft-Max classifier. Motor and Control Applications, Vol. 45, Issue 6, 2018, p. 80-87.
-
Xiao Liangjun Research on fault diagnosis method of offset press rolling bearing based on convolution neural network. Xi’an University of Technology, 2018.
-
Li Guoli, Huo Mingxia, Gao Xinzhi, et al. Mechanical fault diagnosis method of circuit breaker based on LMD and time-frequency fractal dimension. Instruments and Analysis Monitoring, Vol. 4, 2018, p. 1-5.
-
Meng Qinghua, Hou Zhoubo, Sun Xiaohong Research on noise reduction algorithm for vibration signal of automobile hub unit based on mathematical morphology. Mechatronics Engineering, Vol. 30, Issue 4, 2013, p. 411-416.
-
Menger Research on Insulator State Recognition Based on CNN. North China Electric Power University, 2018.
-
Krizhevsky A., Sutskever I., Hinton G. E. ImageNet classification with deep convolutional neural networks. International Conference on Neural Information Processing Systems, 2012, p. 1097-1105.
About this article

