Abstract
Foam concrete (FC) is utilizable in various fields of application in civil engineering practice. It's most often used as a leveling sub-base in the floors of the buildings or foundation structures or as a fill material in open spaces such as unused underground structures. Foam concrete contains void pores so it has much lower bulk density than regular concrete. Together with the saving of material inputs, physical and mechanical parameters and low thermal conductivity, it predestinates its use as a structural element of the structures such as sub-base layers. Strain modulus from the second load cycle is the common control parameter in the sub-base design. Some elements of conventional PLT equipment are not usable for foam concrete testing because of larger deflection radius due to the larger stiffness of foam concrete. When reliable relation between dynamic modulus and conventional strain modulus is determined, LWD testing can substitute the PLT test as a quick and simple method. This paper is the first approach to estimate this relation.
1. Introduction
Foam concrete (FC) is prepared from cement, water, additives and technical foam. It has promising mechanical and thermal parameters, and fully mechanized treatment [1-5]. Typically, almost 70 % of the volume consists of pores filled with air, that means low volume density and saving of material inputs. Our effort is to substitute the traditional sub-base layers of the industrial floors, pavements or foundation of the buildings [6-9]. According to the required mechanical and thermal properties, a specific formula represented by the nominal bulk density was developed. Usually, bulk density of the foam concrete starts at 900 kg·m-3 [10, 11]. Progress of foam concrete formula led to reduction of bulk density, but mechanical parameters remain at the same level. Lower bulk density means higher thermal resistance and lower production costs. Today, we can prepare the foam concrete of bulk densities from 300 to 900 kg·m-3.
Our recent research is aimed at the design of pavements, industrial floors and foundation sub-bases with the foam concrete. Foam concrete can also be used in earth structures, where soft soils are present thanks to low bulk density [12]. We try to shift the foam concrete to the structure designs as a replacement for current materials.
2. Foam concrete testing
We adopted the same requirements for both of the standard and foam concrete sub-base. The static and dynamic deformation moduli were investigated in this paper as widely used methods to check the quality of the sub-base. Bulk density testing allows us to verify the level of quality of earthworks for the granular materials but this method is very time-consuming [13, 14]. On the contrary, bulk density control of fresh mixture of foam concrete is quick and represents the quality of the foam concrete layer very well.
For the observations, a physical model of the sub-base in the test area of Department of Railway Engineering and Track Management of University of Zilina was created. Physical modeling is proven method for observation of the structure’s behavior and can be combined with numerical simulation [15-17].
Main goal was to determine the deformation characteristics of the sub-base made from foam concrete in the experimental field. A plate load test (PLT) using static loading and dynamic testing with the light weight deflectometer (LWD) were utilized. The LWD equipment was chosen because of quick determination of the deformation modulus but reliability of the results should be verified by another method. PLT testing is usually realized to estimate the dependency between the static and dynamic moduli. A measurement beam of PLT apparatus is located very close to the loading plate so its supports can settle because of depression around the loading plate. LWD apparatus doesn’t require such beam and can be used for layers of various stiffness [18-21].
Sub-base in the experimental field was proposed with the foam concrete FC 400 with the nominal dry bulk density of 400 kg·m-3 because of supposed usage in the family house foundations.
2.1. Experimental field
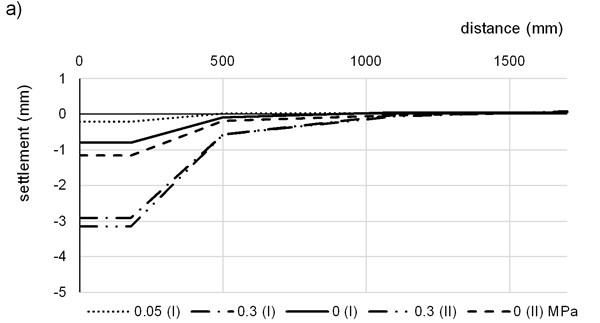
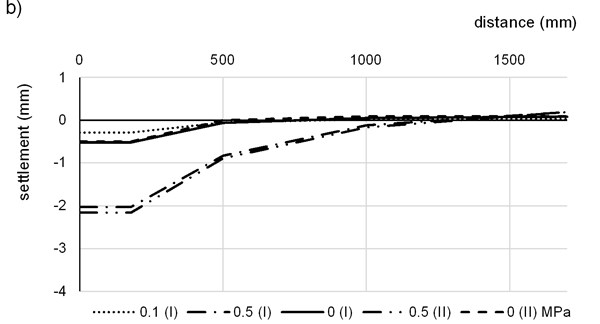
Measurements in the experimental field can be realized at controlled boundary conditions to achieve reliable results. Scheme of the experimental field is plotted in Fig. 1. The Fig. 1 shows the positions of FWD testing sites. PLT testing was performed in the middle row in the same position as a FWD testing. In total, 12 FWD and 4 PLT tests were performed. Steel frame above the field served as a counterweight for PLT testing (Fig. 1, section A-A').
Fig. 1Scheme of the experimental field. Circles represent the PLT and LWD testing sites, dimensions in mm
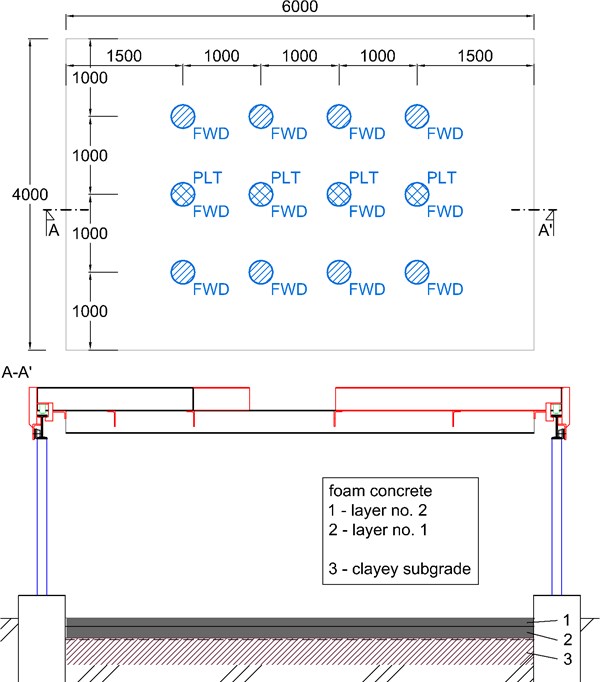
Subgrade consists of anthropogenous clay of intermediate plasticity with rigid consistency. No groundwater was observed in the boreholes. Surface of the subgrade was leveled without compaction. We assume the use of the FC 400 foam concrete in the foundation slabs of family houses where mechanical and thermal properties are important. Modification of basic formula allows to decrease the bulk density and increasing of the thermal resistance at the same time with remaining almost the same mechanical characteristics compared to FC 500. Subgrade under the foundation structures of family houses is not always compacted so we prepared the subgrade in this manner. The values given in the Table 1 were obtained by the laboratory testing of a clay samples taken from experimental field. Characteristics of the clay in the subgrade are in Table 1.
Table 1Subgrade soil characteristics
Parameter | Value | Unit | |
Liquid limit | 43.0 | % | |
Plasticity limit | 21.1 | % | |
Index of plasticity | 21.9 | % | |
Actual moisture content | 7.7 | % | |
Non-woven polypropylene geotextile with the unit weight of 200 g·m-2 was laid on the subgrade as a permanent part of the FC design. Two foam concrete layers were created. First layer with the thickness of 12 cm was placed on the geotextile and second one with the thickness of 10 cm was placed on the first layer after measurements. Total thickness of the foam concrete layers was 22 cm.
PLT and LWD tests were carried out on the clayey subgrade and on the both foam concrete layers as plotted in Fig. 1. Construction of the field is shown in Fig. 2.
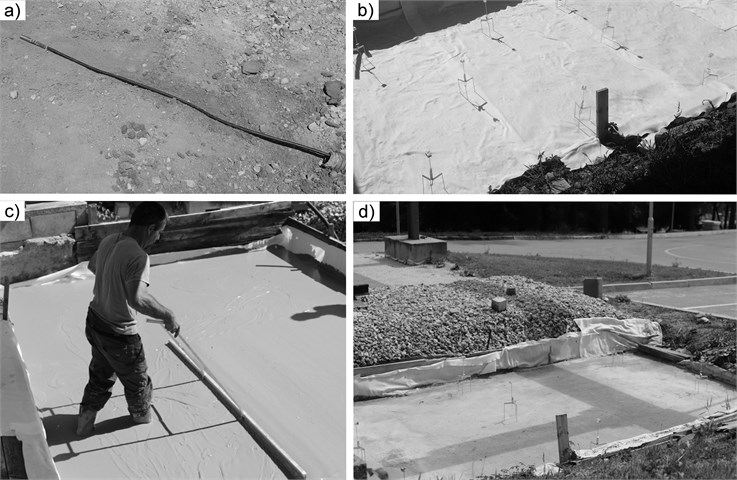
Fig. 2Construction stages of the experimental field: a) thermometer on the subgrade, b) geotextile on the subgrade, c) leveling of the fresh FC mixture, d) final FC layer prepared for realization of the second FC layer with the thickness markers
Temperature at the top of the FC layer, at the bottom of the layer and in the very upper layer of the subgrade was measured during the testing to clarify the temperature regime of the compound, especially during the winter season (Fig. 3). Vertical lines indicate the date of the PLT and LWD testing on particular layer.
Fig. 3Temperature in the experimental field during testing: a) top of the FC layer, b) bottom of the FC layer, c) clayey subgrade
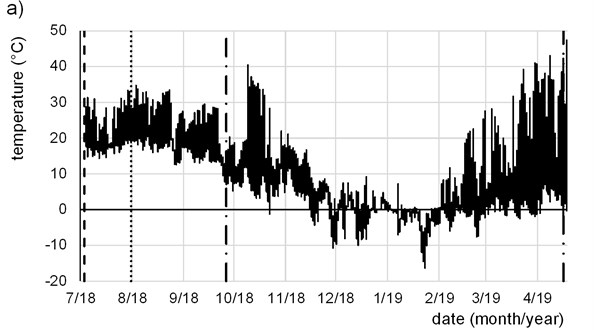
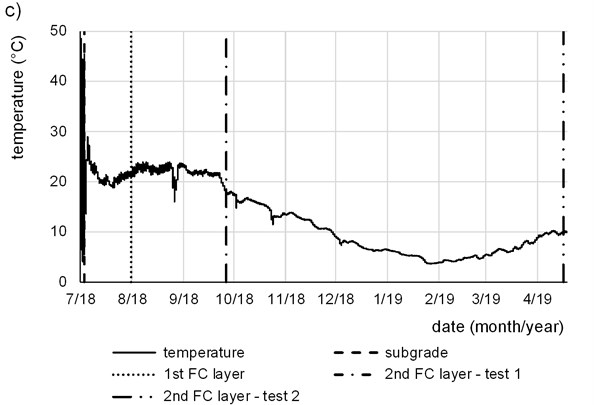
Measurements on the second FC layer were carried out before (2nd FC layer – test 1) and after winter season (2nd FC layer – test 2). Surface of the FC was covered with the foil between the test days. Excitation of temperature is clearly visible at the top and less at the bottom of FC. No freezing was observed in the top layer of the subgrade (Fig. 3(c)) but the lowest temperature reached – 4.6 °C at the bottom of FC and – 16.4 °C was recorded at the top of FC (end of 1/19).
2.2. Plate load test
PLT testing was carried out with the rigid steel loading plate with the diameter of 357 mm. Load was added in stages at which steady settlement of the loading plate was recorded. Maximum contact stress was 0.15 MPa for the clayey subgrade, 0.3 MPa for the first FC layer and 0.5 MPa for the second FC layer. Theory for calculation of modulus is based on the principles of elastic half-space. The equations for the calculation are given in the Slovak technical standard [18] and in certain variations they can also be found in the foreign standards. Strain modulus was calculated for the middle third of the overall pressure interval following the Eq. (1):
where: – second load cycle strain modulus (MPa), – Poisson’s ratio (0.40 for the subgrade and 0.25 for the foam concrete), – radius of the loading plate (0.1785 m), – selected stress interval (MPa), – loading plate settlement difference for given stress interval (mm).
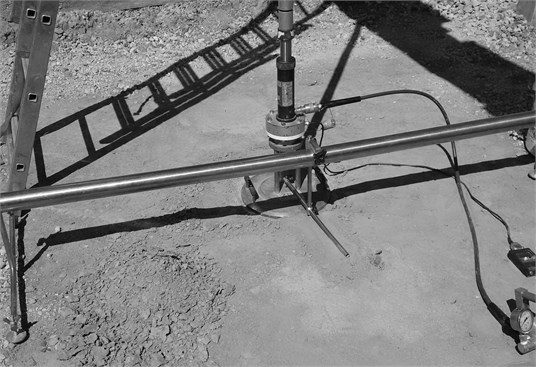
Clayey subgrade was tested using conventional measurement beam supplied as a regular part of PLT equipment (Fig. 4). The Fig. 4 shows the PLT testing on the clayey subgrade. Rigid steel plate was loaded up to maximum vertical contact stress in several loading stages, when attenuation of plate settlement was achieved in every stage. Depression around the loading plate doesn’t affect the beam legs because of small stiffness of the soil. Calculated strain modulus from the second load cycle for the clayey subgrade varied in interval from 11.5 to 13.4 MPa.
Fig. 4PLT testing on the subgrade with conventional measurement beam
Because of high stiffness of the FC layer, we assumed that deflection radius around the loading plate could affect the legs of conventional measurement beam shipped with the loading plate for PLT testing. Therefore, larger beam with the legs situated outside the FC slab was created (Fig. 5). Polymer tube was reinforced by the strip of steel at which vertical holders for deformeters were attached. These were placed to identify the deflection of the FC slab surface. We tried to reduce the use of steel elements because of thermal expansivity of steel but some tempering was necessary to stabilize the deflection of the beam. Additionally, we screened the test site to avoid the direct radiance by sunrays and wind.
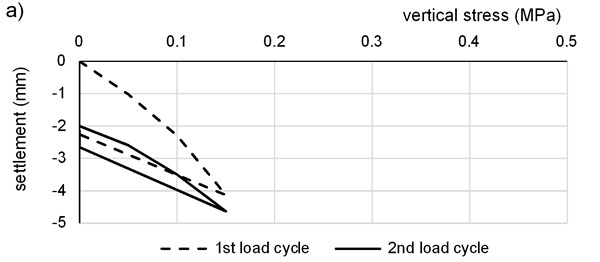
The plate was loaded by the piston connected with the hinge so only vertical force without moment effect was applied. Vertical contact stress and corresponding steady vertical settlement were recorded. Typical load/settlement curves for PLT tests for both load cycles are plotted in Fig. 6.
Fig. 5Large beam with the deformeters during the PLT test on the FC layer
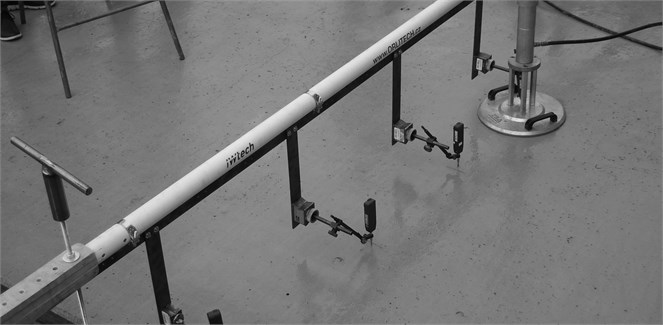
Fig. 6Typical load/settlement curves for PLT test: a) on the subgrade, b) on the 1st FC layer, c) on the 2nd FC layer
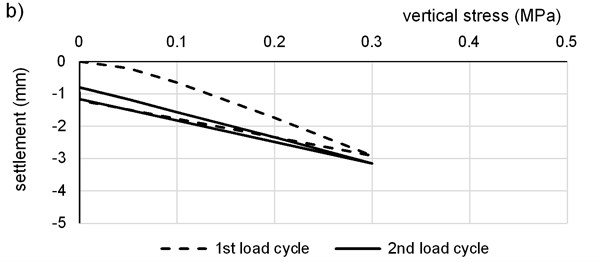
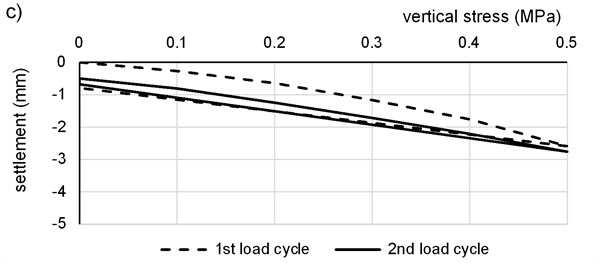
Propagation of the deflection curve for the first and second FC layer is plotted in Fig. 7.
Fig. 7Deflection curve during PLT testing: a) measurement on the 1st FC layer, b) measurement on the 2nd FC layer – test 1, c) measurement on the 2nd FC layer – test 2
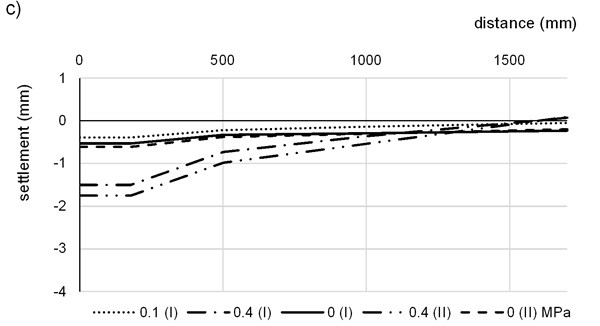
Deflection radius for the 12 cm FC layer is smaller than half width of the slab so the entire depression fits the slab (Fig. 7(a)). For the 22 cm slab, the edges are lifted, so deflection radius is larger than half width of the slab (Fig. 7(b) and 7(c)). As we can see, standard measurement beams cannot be used for PLT testing on the FC slabs because of the influence of the depression around the loading plate. On the other hand, the testing is still possible with conventional loading plate and pressure cylinder.
2.3. Light weight deflectometer
Light Weigh Deflectometer (LWD) equipment is based on impact theory. The 10 kg weight falls from the height of 0.755 m on the damping pad on the steel circular loading plate. The impact causes a contact stress of 0.1 MPa (vertical force of 7.07 kN). The impact interval is 17.9 ms what is related to the vehicle tire pass at the velocity of 60 km·h-1. This stress causes the deflection under the loading plate . The dynamic deformation or impact modulus is calculated following the Eq. (2):
where: – dynamic deformation modulus (MPa), – impact force (7.07 kN), – loading plate diameter (0.3 m), – deflection under the loading plate, – Poisson’s ratio (0.40 for the subgrade and 0.25 for the foam concrete).
Scheme of the LWD test equipment with typical test output is plotted in Fig. 8.
Fig. 8Scheme of the LWD testing apparatus and the graphic output of the test
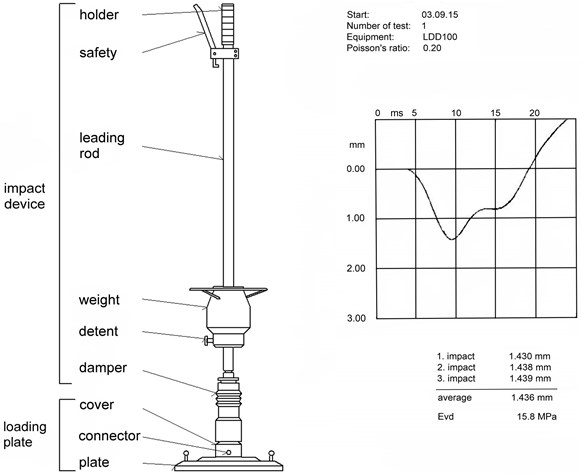
Value of the modulus and deflection is displayed on the display of the control unit after 3rd impact. A 3 LWD test sites were situated close to the corresponding PLT test sites (Fig. 1).
The testing repeated on the same place immediately after the first test causes the increase of values. The test sites for measurements were therefore moved after the winter period in order to avoid the influence of the previous testing.
3. Results and discussion
The dependency of static and dynamic values of moduli is plotted in the following figures (Fig. 9 and 10). Dynamic deformation modulus was determined as a representative value from particular test results (Fig. 1). Both of the moduli were adjusted following the local thickness of FC at corresponding test position.
Fig. 9Relation between static and dynamic values of moduli
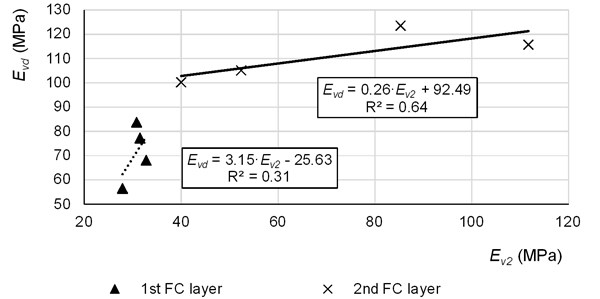
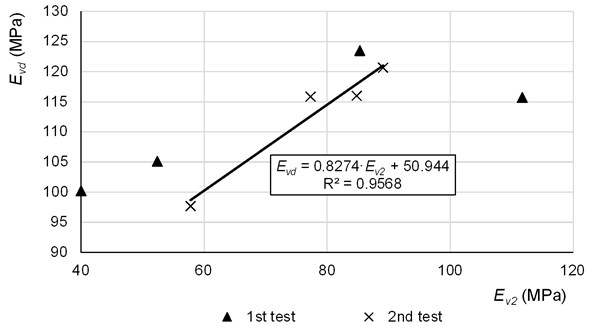
Fig. 10Relation between static and dynamic values of moduli. Comparison of the results from first and second test on the 2nd FC layer
Large spread of the dynamic values can be seen for the first FC layer (Fig. 9). Despite the small spread of the values, the dispersion is most likely caused by the flexible nature of the FC slab and by some inhomogeneity of the clayey subgrade and of foam concrete.
Second FC layer shows better dependency but modulus is more scattered in pre-winter tests (Fig. 9). Post winter outputs show better results and the reliability index is high (Fig. 10). This shows quite good relation between and moduli.
4. Conclusions
Generally, a large number of different approaches can be adopted to determine the stiffness of the foam concrete layer. From an experimental point of view, typical testing techniques for conventional sub-grade layer can be utilized such as Clegg Impact Soil Tester (CIST), Humboldt tester or bulk density testing. It should be noted that these methods were developed for testing of different materials than foam concrete so their usability depends on some adjustment of the testing procedures and testing equipment limitations. Further, a numerical modelling can be a part of the design process.
The LWD testing gives relative small reliability of outputs but testing after winter season shows better relation. High porosity of the foam concrete and quite high damping potential complicate the determination of the dynamic modulus as a substitution to the time consuming PLT testing. Further data collection is necessary to determine the appropriate dynamic modulus as a control parameter for the quality assessment. A larger set of data should be recorded and analyzed to estimate the objectified modulus.
PLT testing is more reliable than LWD testing. However, physical execution of the test is time-consuming and requires additional equipment such as frame for sensors. This testing method is only applicable in controlled conditions when beam can be located outside of the foam concrete slab or deflection area. Practical application is limited so LWD testing is studied as a verified replacement of PLT testing. This method is quick and considering the high level of homogeneity of foam concrete it can be used as a regular testing method after some adjustment. Additionally, theoretical approach for the first estimation of the compound can be used. The SOJUZDORNII theory is one of them. However, this theory is very sensitive to input data especially in case of subgrade material [22].
Next step will involve conducting of more PLT and LWD tests to determine their mutual relation more precisely. After the tests, numerical simulation to verify the behavior of the foam concrete in the sub-grade will take place. This involves the simulation of PLT and LWD testing and comparison of the results with laboratory determined FC parameters.
References
-
Brodnan M., Bahleda F., Kotes P. Analysis of mechanical properties of concrete of frozen and unfrozen specimens. Procedia Engineering, Vol. 91, 2017, p. 435-440.
-
Dobes P., et al. The determination of values of the specific heat capacity of the selected thermal insulation materials used in track bed structure. MATEC Web of Conferences, Vol. 117, 2017, p. 00039.
-
Izvolt L., et al. Calibration of TDR test probes for measuring moisture changes in the construction layers of the railway line. Proceedia Engineering, Vol. 161, 2016, p. 1057-1063.
-
Izvolt L., Dobes P., Mecar M. Contribution to the methodology of the determination of the thermal conductivity coefficients λ of materials applied in the railway subbase structure. Communications: Scientific letters of the University of Žilina, Vol. 15, 2013, p. 9-17.
-
Izvolt L., et al. Mathematical modeling of the various factors impact on the frost depth of subgrade construction. Procedia Engineering, Vol. 111, 2015, p. 331-338.
-
Decky M., Drusa M., Zgutova K., Blasko M., Hajek M., Scherfel W. Foam concrete as new material in road constructions. Procedia Engineering, Vol. 161, 2016, p. 428-433.
-
Drusa M., Fedorowicz L., Kadela M., Scherfel W. Application of geotechnical models in the description of composite foamed concrete used in contact layer with the subsoil. Proceedings of 10th Geotechnical Conference, Geotechnical Problems of Engineering Constructions, 2011.
-
Kadela M., et al. Application of foamed concrete in road pavement – weak soil system. Procedia Engineering, Vol. 193, 2017, p. 439-446.
-
Kadela M., Kozłowski M. Foamed concrete layer as sub-structure of industrial concrete floor. Procedia Engineering, Vol. 161, 2016, p. 468-476.
-
Hajek M., Decky M., Drusa M., Orininova L. Elasticity modulus and flexural strength assessment of foam concrete layer of Poroflow. IOP Conference Series: Earth and Environmental Science, Vol. 44, 2016, p. 022021.
-
Hajek M., Decky M., Scherfel W. Objectification of modulus elasticity of foam concrete poroflow 17-5 on the sub-base layer. Journal CEE, Vol. 12, Issue 1, 2016, p. 55-62.
-
Decky M., Drusa M., Pepucha L., Zgutova K. Earth Structures of Transport Constructions. Pearson, Harlow, 2013.
-
Decky M., Remisova E., Mecar M., Bartuska L., Lizbetin J., Dreveny I. In situ determination of load bearing capacity of soils on the airfields. Journal Procedia Earth and Planetary Science, Vol. 15, 2015, p. 11-18.
-
Zgutova K., Decky M., Sramek J., Dreveny I. Using of alternative methods at earthworks quality control. original research article. Procedia Earth and Planetary Science, Vol. 15, 2015, p. 263-270.
-
Kadela M. Model of multiple-layer pavement structure-subsoil system. Bulletin of the Polish Academia of Sciences, Technical Sciences, Vol. 64, Issue 4, 2016, p. 751-762.
-
Kozłowski M., Kadela M., Gwóźdź-Lasoń M. Numerical fracture analysis of foamed concrete beam using XFEM method. Applies Mechanics and Materials, Vol. 837, 2016, p. 183-186.
-
Kozłowski M., Kadela M., Kukiełka A. fracture energy of foamed concrete based on three-point bending test on notched beams. Procedia Engineering, Proceedings of 7th Scientific-Technical Conference on Material Problems in Civil Engineering, Vol. 108, 2015, p. 349-354.
-
Valaskova V., Vlcek J., Gago F., Drusa M. Dynamic testing of the sub-base layer made from foam concrete using light weight deflectometer. Vibroengineering Procedia, Vol. 25, 2019, p. 139-142.
-
Yongliang H., Mingshi G., Hongchao Z., Yichao Z. Behaviour of foam concrete under impact loading based on SHPB experiments. Shock and Vibration, Vol. 2019, 2019, p. 2065845.
-
Falliano D., Domenico D., Ricciardi G., Gugliandolo E. Experimental investigation on the compressive strength of foamed concrete: effect of curing conditions, cement type, foaming agent and dry density. Construction and Building Materials, Vol. 165, 2018, p. 735-749.
-
She W., Du Y., Zhao G., Feng P., Zhang Y., Cao X. Influence of coarse fly ash on the performance of foam concrete and its application in high-speed railway roadbeds. Construction and Building Materials, Vol. 170, 2018, p. 153-166.
-
Valaskova V., Vlcek J. Laboratory and in situ investigation of modulus of elasticity of foam concrete. E3S Web of Conferences, Vol. 157, 2020, p. 06013.
Cited by
About this article

This paper was supported by the Grant National Agency VEGA of the Slovak Republic (Grant No. 1/0006/20).
