Abstract
The sugarcane harvester vibration has a bad effect on the sugarcane cutting quality. The effect of sugarcane field roughness on the sugarcane harvester vibration is much more significant than those of cutting forces and the engine. In order to simulate sugarcane field roughness, a simulated sugarcane field exciter (SSFE) was developed to actuate a self-developed sugarcane harvester experiment platform (SHEP). The dynamics and the mathematical models of the SHEP were established. Simulations of the mathematical model show these two models are reasonable. The dynamic characteristic experiment of the SSFE shows it matches characteristics of sugarcane field roughness, but great lateral oscillations existed when it worked. Then the SSFE II was developed. The dynamic characteristic experiment of the SSFE II shows it matches characteristics of sugarcane field roughness and improves the SSFE. The modal test of the SHEP was done to further study dynamic characteristics of the SSFE II. With the SSFE II, simulated experiments of sugarcane harvesters under complete vibration causing conditions can be done in labs instead of sugarcane fields to avoid the low efficiency, poor security and bad reliability during experiments in sugarcane fields.
Highlights
- A sugarcane harvester experiment platform (SHEP) was developed. On the SHEP, an actuating engine is used to simulate the engine excitation and a simulated sugarcane field exciter (SSFE) developed based on sugarcane field roughness signals is used to simulate the sugarcane field excitation. Therefore, simulated experiments of sugarcane harvesters can be done in labs instead of sugarcane fields.
- The dynamics and the mathematical models of the SHEP were established and simulated.
- The SSFE was developed and improved through lateral-oscillation-limiting devices. That is, the SSFE II was developed based on the SSFE to improve it so that a much more accurate simulated sugarcane field excitation can be achieved in the lab.
- Output frequency calibration experiments and dynamic characteristic experiments of the SSFE and the SSFE II were done and showed the SSFE and the SSFE II match characteristics of sugarcane field roughness and the SSFE II improves the SSFE in that the SSFE II simulates the sugarcane field excitation much more accurately and makes the SHEP much more similar to a sugarcane harvester.
- The LMS modal test of the SHEP was done to further study dynamic characteristics of the SSFE II.
- With the SSFE II, simulated experiments of sugarcane harvesters under complete vibration causing conditions can be done in labs instead of sugarcane fields to avoid the low efficiency, poor security and bad reliability during experiments in sugarcane fields.
1. Introduction
The mechanized sugarcane harvesting area is only 5 % in the whole planting area [1]. A most important reason for difficult mechanized sugarcane harvesting promotion is that mechanized sugarcane cutting brings a poor cutting quality.
Aimed at the poor cutting quality of mechanized sugarcane harvesting, related research was done by scholars all over the world. Kroes [2, 3] and Mello [4] studied effects of cutting forces, cutting energies and different cutting-edge positions on the sugarcane cutting quality through experiments. Kroes [5] studied effects of sugarcane-pressing rollers, cutters, the cutter installing angle and the space distance among saw teeth of cutting edges on the sugarcane cutting quality through simulations. Mello [6] studied the effect of penetrating cutting on the sugarcane cutting quality. Liu Qingting [7, 8] studied broken forms of sugarcanes suffering from tensions, compressions, bending and torsional moments and kinematics of sugarcanes cut by plain knives. Liu Qingting [9] explored the cutting mechanism and mechanical properties of the sugarcane stem material. Yang Jian [10] studied effects of sugarcane fields and machine structural factors on the sugarcane ratoon breaking rate. Yang Wang [11] studied the sugarcane cutting mechanism through an emulator of the sugarcane-cutter system with changeable structural and kinematic parameters.
Moreover, Thanomputra [12] used the high-pressure water cutting method with abrasive sands added to improve the sugarcane cutting efficiency. Mello [13] and Momin [14] used different blades to carry on experimental research on the sugarcane cutting quality and found bending-angle-shape blades with or without saw teeth can improve the sugarcane cutting quality. Ripoli [15] designed a cutter whose cutting depth into soils can be adjusted according to the gradient variation of sugarcane fields to reduce the sugarcane wastage and the impurity content. Johnson [16] and Mathanker [17] studied effects of the sugarcane cutting velocity and the cutting edge angle on the cutting energy. Kroes [18] designed a double-cutter model to study the kinematic trajectory of the cutters and calculated the maximum velocity ratio between the sugarcane harvester moving velocity and the cutter rotation velocity to improve the cutting quality. Silva [19] evaluated the sugarcane root damage degree caused by cutting height differences through experiments. Lai Xiao [20, 21] found the sugarcane field excitation has a bad effect on the cutting system of sugarcane harvesters, causes the vertical cutter frame vibration and deteriorates the sugarcane cutting quality. Wang Peng [22] designed a cutter vibration model to study the effect of the bearing clearance on the cutting system vibration. Yang Jian [23] and Pelloso [24] studied effects of the cutter rotation velocity and the sugarcane harvester moving velocity on the cutting quality.
It is shown through research mentioned above that sugarcane field roughness has a bad effect on the sugarcane cutting quality. In the sugarcane cutting process, besides sugarcane field roughness, cutting forces and the engine also cause vibrations. It is shown through experiments done by our research group that the sugarcane harvester vibration has a bad effect on the sugarcane cutting quality and the effect of sugarcane field roughness on the sugarcane harvester vibration is much more significant than those of cutting forces and the engine. However, none of research mentioned above was focused on characteristics of sugarcane field roughness and how the sugarcane field excitation can be obtained in labs instead of sugarcane fields to avoid the low efficiency, poor security and bad reliability during experiments in sugarcane fields, then to study how to improve the sugarcane cutting quality under simulated experimental conditions.
For purposes above, a sugarcane harvester experiment platform (SHEP) was developed by our research group. On the SHEP, an actuating engine is used to simulate the engine excitation and a simulated sugarcane field exciter (SSFE) developed based on sugarcane field roughness signals collected in sugarcane fields is used to simulate the sugarcane field excitation. That is, the sugarcane field excitation can be obtained in labs, which has never been achieved in previous research. Thus, simulated experiments of sugarcane harvesters under complete vibration causing conditions of the engine, cutting forces existing in the sugarcane cutting process and sugarcane field roughness can be done in labs instead of sugarcane fields.
2. Characteristics of sugarcane field roughness
Characteristics of sugarcane field roughness were obtained through sugarcane field roughness signals collected in a flat and a hilly sugarcane fields. It is shown by proportion analysis on frequency bands of flat and hilly sugarcane field roughness signals through MATLAB that their main excitation frequency band is 1-6 Hz, in which the excitation frequency band with the greatest contribution is 0.5-3.5 Hz. Therefore, sugarcane field roughness signals are low-frequency vibration signals which generate great vibration displacements with low frequencies while small vibration displacements with high frequencies. This founds the theoretical basis for design on the SSFE.
The piecewise fitting method was used to obtain a fitting equation, written as Eq. (1) every 20 seconds to respectively match flat and hilly sugarcane field roughness signals accurately:
where: – amplitude with the unit of m; – the angular frequency with the unit of rad/s; – the frequency with the unit of Hz; – the initial phase with the unit of rad.
In this paper, the fitting equation of the hilly sugarcane field roughness signal was used. The fitting effect of Eq. (1) for the hilly sugarcane field roughness signal in 0-20 s obtained through MATLAB is shown in Fig. 1(a). The curve of Eq. (1) for the hilly sugarcane field roughness signal drawn through MATLAB is shown in Fig. 1(b).
Fig. 1The fitting effect and the curve of Eq. (1) for the hilly sugarcane field roughness signal
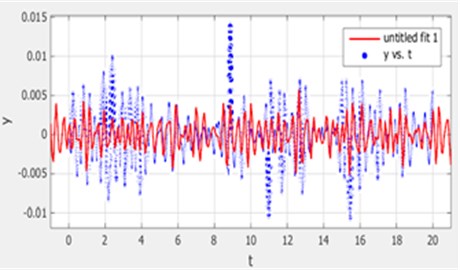
a) The fitting effect of Eq. (1) in 0-20 s
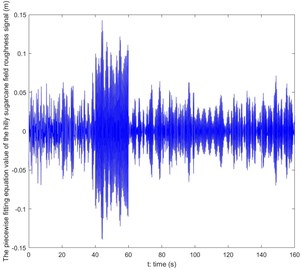
b) The curve of Eq. (1)
In Fig. 1(a), blue curves are actual curves of the hilly sugarcane field roughness signal and red ones are curves of Eq. (1) in 0-20 s. Shapes of red curves coincide with those of blue ones except that amplitudes of red curves are different from those of blue curves, showing Eq. (1) matches the hilly sugarcane field roughness signal well every 20 seconds.
The sugarcane field excitation is generated by sugarcane field roughness and calculated through Eq. (2):
where: – the first derivative of ; , – the stiffness and damping coefficients between wheels of a sugarcane harvester and a sugarcane field.
3. Design and improvement on the SSFE
The SSFE is shown in Fig. 2, where: 1 – the shorter axis; 2 – the axis coupler; 3 – upper springs; 4 – an eccentric mass block; 5 – the middle support platform; 6 – lower springs; 7 – the longer axis.
Fig. 2The SSFE
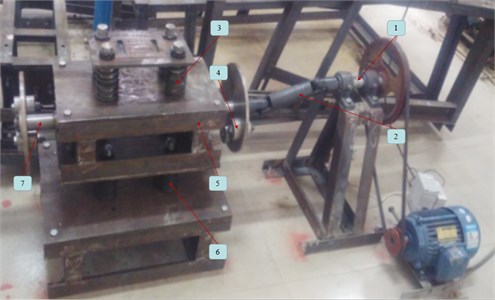
Lower springs are used to simulate stiffness and damping parts between wheels and a sugarcane field to simulate their moving. Upper springs are used to simulate stiffness and damping parts between wheels and the body frame of a sugarcane harvester. The SSFE vibration is produced through unbalanced forces generated by the high-speed rotation of eccentric mass blocks. Unbalanced forces can be changed through the number of eccentric mass blocks.
Lateral oscillations of the SSFE can simulate lateral swings of a sugarcane harvester working in a sugarcane field. It is found through experiments done by our research group that the vertical cutter vibration is bad for the sugarcane cutting quality while lateral cutter oscillations are good for cutting off sugarcanes. Therefore, lateral oscillations of the SSFE are unavoidable and needed, but they should not be great, or the SSFE may turn over laterally, so the SSFE vibration displacements along lateral directions should be smaller than that along the vertical direction. The SSFE with lateral-oscillation-limiting devices (SSFE II) was developed based on the SSFE to improve it so that much more an accurate simulated sugarcane field excitation can be achieved in the lab. Lateral-oscillation-limiting devices are external and internal sleeves of the upper and lower springs. The SSFE II is shown in Fig. 3, where: 1, 2 – the external and the internal sleeves of the upper spring; 3 – eccentric mass blocks; 4 – the axis coupler; 5, 6, 9 – the upper, the middle and the lower support platforms; 7, 8 – the external and the internal sleeves of a lower spring.
There are one upper spring and four lower springs in it.
Fig. 3The SSFE II
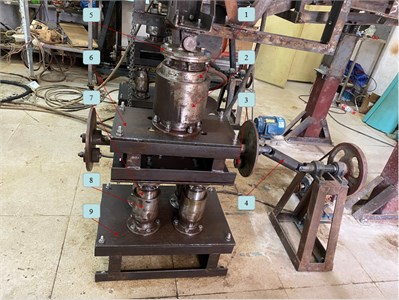
Fig. 4The SHEP
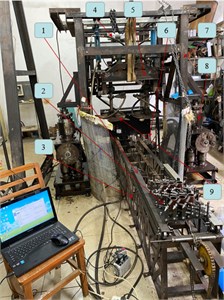
The SHEP with two SSFE IIs is shown in Fig.4, where: 1 – the sugarcane-feeding device; 2 – the sugarcane-clamping device; 3 – the sugarcane-feeding pathway; 4 – the actuating engine; 5 – the cutter frame; 6 – a vibration absorber; 7 – the body frame; 8 – the SSFE II; 9 – a cutter.
Two SSFE IIs are in the front of the SHEP while two vibration absorbers are at the back. The actuating engine is at the top. The SHEP is equivalent to a sugarcane harvester working in a sugarcane field.
4. The dynamics and the mathematical models of the SHEP
The dynamics model of the SHEP is simplified as a spring-mass system shown in Fig. 5. The body frame of the SHEP, two cutters and the actuating engine are simplified as mass blocks. Two SSFE IIs and two vibration absorbers are simplified as spring dampers, equivalent to four wheels of a sugarcane harvester. The positive direction of the axis is the upward vertical direction. The axis is along radiuses of two cutters with the positive direction pointing to the left of the SHEP. The axis is along the sugarcane-feeding pathway with the positive direction pointing to the back of the SHEP. The and the axes are along two lateral directions vertical to the axis.
Fig. 5The dynamics model of the SHEP
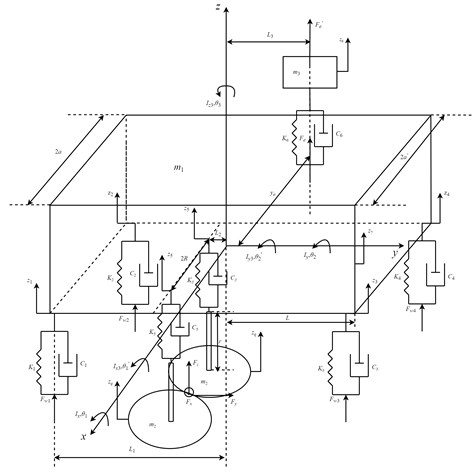
In Fig. 5 , , – masses of the body frame, a cutter and the actuating engine, 3600 kg, 70 kg, 400 kg; , , , , – rotational inertias of the body frame and a cutter around the , the and the axes, 3.4×10⁵ kg⋅m2, 65.39153867 kg⋅m2, 23.05961249 kg⋅m2, 54.79386107 kg⋅m2; , , , – stiffness and damping coefficients between two front wheels and the body frame, 3.52×10⁵ N/m, 2.686×10³ N/((m/s)); , , , – stiffness and damping coefficients between two rear wheels and the body frame, 5.28×10⁵ N/m, 2.218×10³ N/((m/s)); , – the stiffness and the damping coefficients between two cutters and the body frame, 9.093×10⁶ N/m, 6.3 N/((m/s)); , – the stiffness and the damping coefficients between the actuating engine and the body frame, 5.98×10⁶ N/m, 1.57×10³ N/((m/s)); , , , – sugarcane field excitations acting on the four wheels, as are calculated through Eq. (3) according to Eq. (2):
, – periodical forces acting on the body frame by the engine and the engine by its internal structures, as are calculated through Eq. (4):
, , – cutting forces along the , the and the axes, as are calculated through Eq. (5):
, , , – halves of the front wheel distance, the rear wheel distance, the length of the body frame and the center distance of two cutters, 0.68 m, 0.605 m, 2.5 m, 0.27 m; – the distance between front wheels or rear wheels and the mass center of the body frame, 1.5 m; – the distance between the mass center of the cutter frame and that of the body frame, 0.9 m; , – distances between the mass center of the body frame with the action line of observed along the axis and the axis, 0.1 m, 0.3025 m; – the length of the cutter axis, 0.5 m; , , , – vertical displacements of connection points of four wheels and the body frame; – vertical displacements of connection points of two cutters and the body frame. They are calculated through Eq. (6):
, , – vertical displacements of the body frame, a cutter and the actuating engine; , – rotation angles of the body frame around the and the axes; , , – rotation angles of a cutter around the , the and the axes. They are calculated through given parameters above.
According to the D’Alembert principle, the mathematical model of Fig. 5 is written as Eq. (7) in a matrix form:
where:
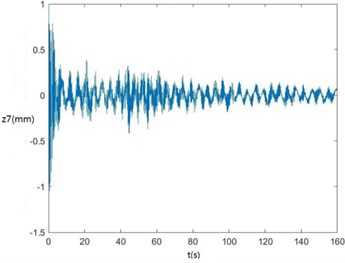
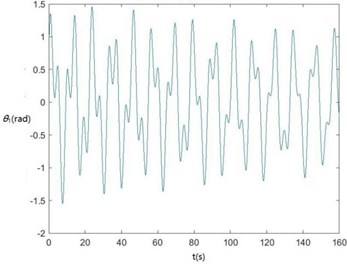
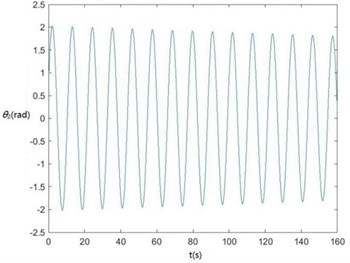
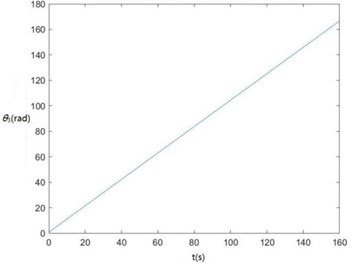
Curves of , , , , , , and changing with time drawn through MATLAB are shown in Fig. 6.
Fig. 6Curves of zq, z7, z6, θ1, θ2, θ3, θ1' and θ2' changing with time
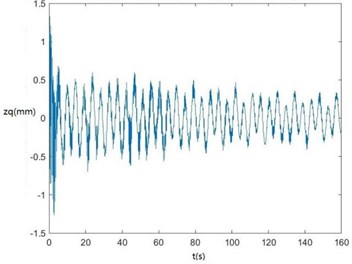
a) The curve of changing with time.
b) The curve of changing with time.

c) The curve of changing with time
d) The curve of changing with time
e) The curve of changing with time
f) The curve of changing with time
g) The curve of changing with time
h) The curve of changing with time
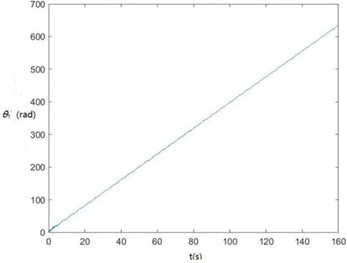
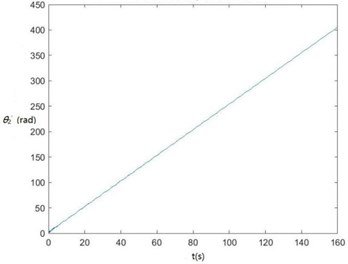
According to Fig. 6, , , , and become smaller and smaller, that is, convergent along with time, showing the dynamics and the mathematical models of the SHEP are reasonable. Finally, they change with time in approximately periodical variation laws in that , and are periodical excitations, showing displacements of two cutters, the body frame and the engine of a sugarcane harvester along the axis finally change approximately in periodical variation laws along with time. and become greater and greater along with time in that two cutters keep rotating around their axes in the sugarcane cutting process.
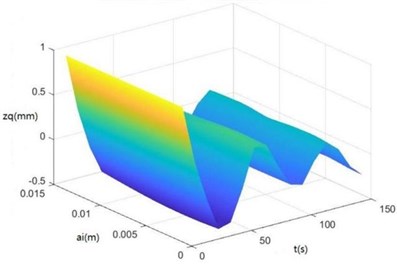
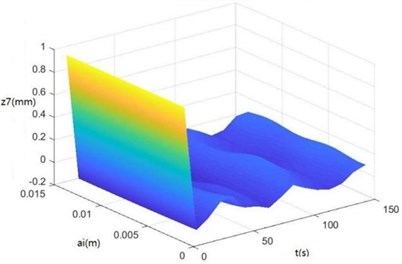
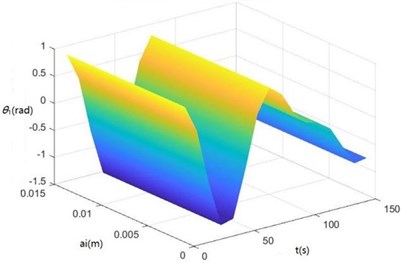
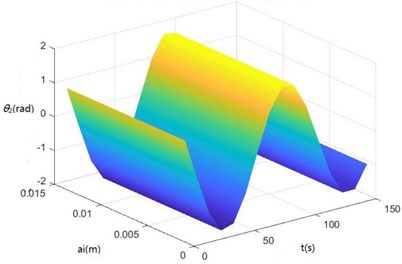
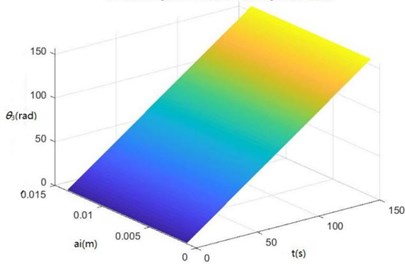
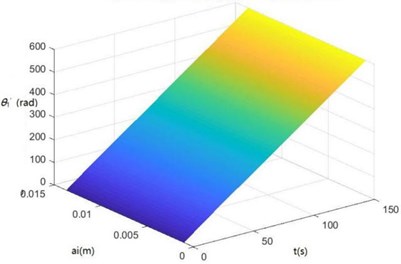
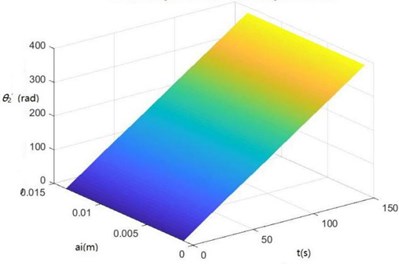
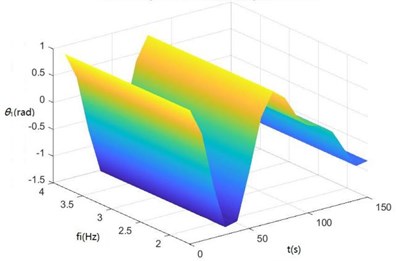
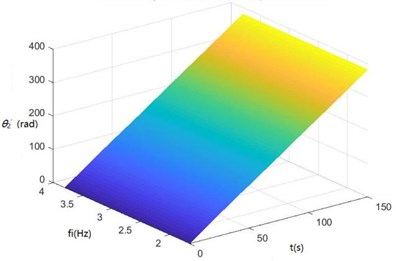
Surface diagrams of , , , , , , and changing with during continuous time drawn through MATLAB are shown in Fig. 7.
According to Fig. 7, the greater is, the greater , , , , , , and will be, showing the sugarcane field excitation is a kind of displacement excitations, that is, the hillier a sugarcane field is, the more severe the sugarcane harvester vibration will be.
Fig. 7Surface diagrams of zq, z7, z6, θ1, θ2, θ3, θ1' and θ2'changing with ai during continuous time
a) The surface diagram of changing with
b) The surface diagram of changing with

c) The surface diagram of changing with
d) The surface diagram of changing with
e) The surface diagram of changing with
f) The surface diagram of changing with
g) The surface diagram of changing with
h) The surface diagram of changing with
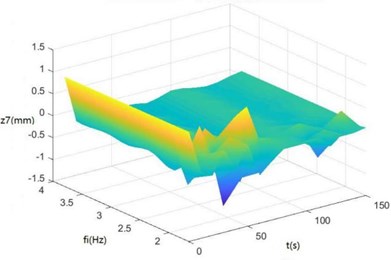
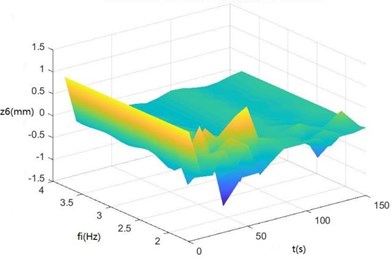
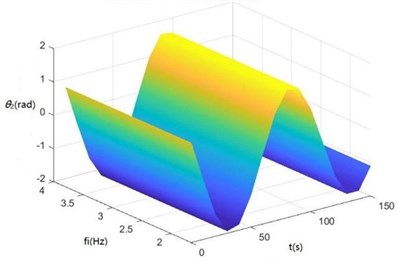
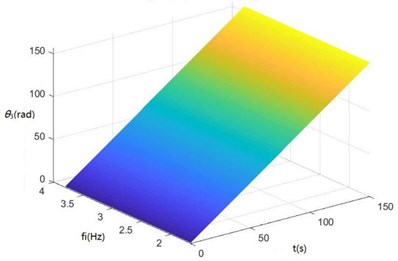
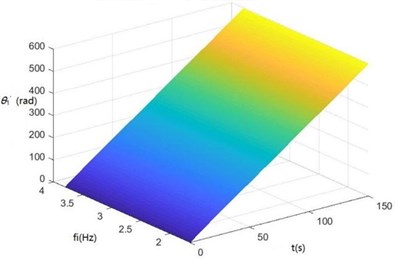
Surface diagrams of , , , , , , and changing with during continuous time drawn through MATLAB are shown in Fig. 8.
Fig. 8Surface diagrams of zq, z7, z6, θ1, θ2, θ3, θ1' and θ2' changing with fi during continuous time
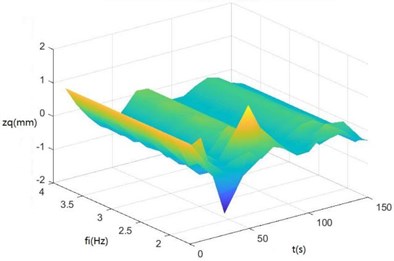
a) The surface diagram of changing with
b) The surface diagram of changing with
c) The surface diagram of changing with
d) The surface diagram of changing with
e) The surface diagram of changing with
d) The surface diagram of changing with
g) The surface diagram of changing with
h) The surface diagram of changing with
According to Fig. 8, The greater is, the greater , , , and will be. When is 2-3 Hz, in the excitation frequency band of sugarcane field roughness signals with the greatest contribution, 0.5-3.5 Hz, , and are the greatest, further showing the dynamics and the mathematical models of the SHEP are reasonable and the SHEP can simulate a sugarcane harvester working in a sugarcane field.
5. Materials and methods
5.1. Design on the SSFE and the SSFE II output frequency calibration experiments
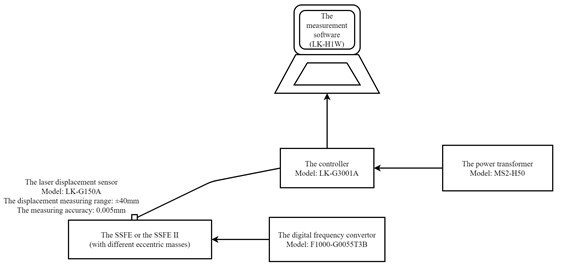
The SSFE and the SSFE II output frequency calibration experiments were done to obtain their output frequencies. The SSFE and the SSFE II input frequencies were controlled through a digital frequency convertor (Model: F1000-G0055T3B). Corresponding to every input frequencies of the SSFE and the SSFE II, a laser tachometer (Model: DT-2234B) was used to measure eccentric axis rotation velocities of the SSFE and the SSFE II which were used to calculate output frequencies corresponding to their input frequencies at this moment.
5.2. Design on dynamic characteristic experiments of the SSFE and the SSFE II
Dynamic characteristic experiments of the SSFE and the SSFE II were designed as vibration displacement measuring experiments to study their dynamic characteristics and verify whether they match characteristics of sugarcane field roughness and whether lateral-oscillation-limiting devices can limit lateral oscillations of the SSFE II. The block diagram of dynamic characteristic experiments of the SSFE and the SSFE II is shown in Fig. 9.
In Fig. 9, the laser displacement sensor was used to measure the SSFE and the SSFE II vibration displacements along the , the and the axes. The SSFE and the SSFE II vibration displacement measuring experiments were designed as complete cross grouping experiments. The SSFE and the SSFE II input frequencies and eccentric masses were two experimental factors. Levels of the SSFE and the SSFE II input frequencies were 5-15 Hz and 8-25 Hz (The step size is 1). Levels of the eccentric mass were 1-4 kg (The step size is 1).
Fig. 9The block diagram of dynamic characteristic experiments of the SSFE and the SSFE II
5.3. Design on the LMS modal test of the SHEP
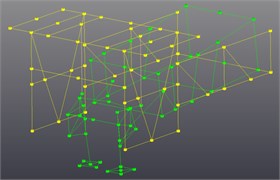
The LMS modal test of the SHEP was done to further study dynamic characteristics of the SSFE II. The LMS modal test system of the SHEP and its block diagram are shown in Figs. 10-11. The force hammer was used to knock on the SHEP to obtain its modal information. Three-axis acceleration sensors were pasted on the SHEP according to the paste point arrangement diagram drawn through Geometry of LMS Test.Lab, as is shown in Fig. 12.
Fig. 10The LMS modal test system of the SHEP
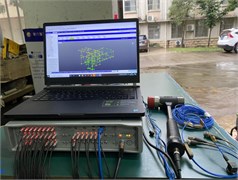
Fig. 11The block diagram of the LMS modal test system of the SHEP
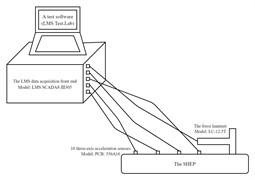
Fig. 12The paste point arrangement diagram
6. Analysis on experiment results
6.1. Analysis on the SSFE and the SSFE II output frequency calibration experiment results
The SSFE and the SSFE II output frequency calibration curves drawn through Excel are shown in Fig. 13.
According to Fig. 13, the SSFE output frequencies range from 1.3 Hz to 4.81 Hz and the SSFE II output frequencies range from 2.24 Hz to 7.35 Hz, approximately in the main excitation frequency band of sugarcane field roughness signals, 1-6 Hz, showing the SSFE and the SSFE II input frequencies were chosen reasonably.
Fig. 13The SSFE and the SSFE II output frequency calibration curves
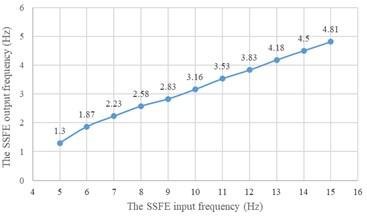
a) The SSFE output frequency calibration curve
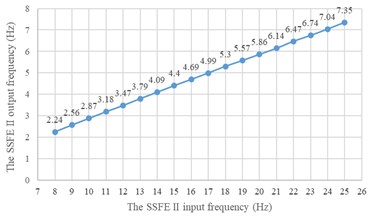
b) The SSFE II output frequency calibration curve
6.2. Analysis on the dynamic characteristic experiment result of the SSFE
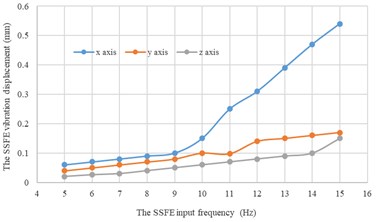
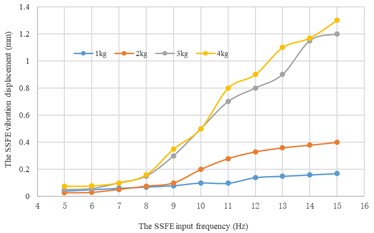
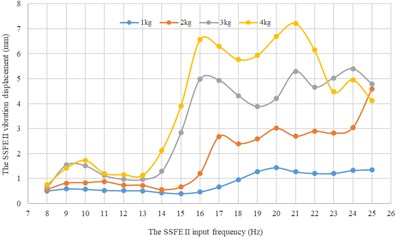
Under every eccentric mass, curves of the SSFE vibration displacements along the three directions changing with the SSFE input frequency drawn through Excel are shown in Fig. 14.
Fig. 14Under every eccentric mass, curves of the SSFE vibration displacements along the three directions changing with the SSFE input frequency
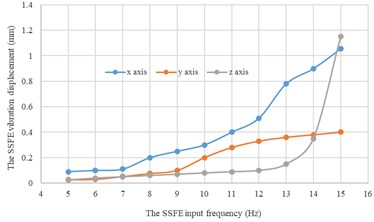
a) Under a 1 kg eccentric mass
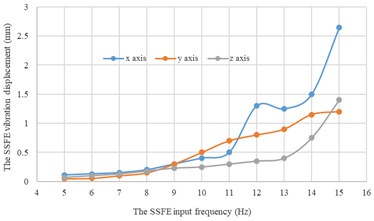
b) Under a 2 kg eccentric mass
c) Under a 3 kg eccentric mass
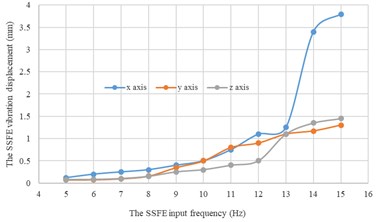
d) Under a 4 kg eccentric mass
According to Fig. 14, under the same eccentric mass, the SSFE vibration displacements along two lateral directions are greater than that along the vertical direction, so the SSFE may turn over laterally. Therefore, the SSFE needs improvement.
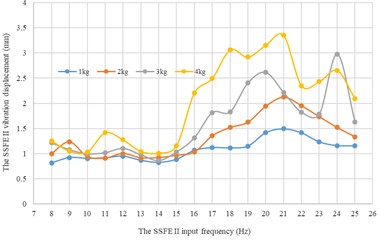
Along every direction, curves of the SSFE vibration displacements changing with the SSFE input frequency under different eccentric masses drawn through Excel are shown in Fig. 15.
According to Fig. 15, along the same direction, the greater the eccentric mass is, the greater the SSFE vibration displacement will be. According to Figs. 14-15, under the same eccentric mass or along the same direction, the greater the SSFE input frequency is, the greater the SSFE vibration displacement will be, verifying the discovery obtained through Fig. 8.
Moreover, according to Figs. 14-15, the SSFE vibration displacement has an obvious increasing trend when the SSFE input frequency is greater than 8 Hz. According to Fig. 13(a), the SSFE output frequencies corresponding to 8-10 Hz are 2.58-3.16 Hz, in the excitation frequency band of sugarcane field roughness signals with the greatest contribution, 0.5-3.5 Hz and the SSFE output frequencies corresponding to 11-15 Hz are 3.53-4.81 Hz, in the main excitation frequency band of sugarcane field roughness signals, 1-6 Hz, making the SSFE vibration displacement have an obvious increasing trend. Besides, the SSFE output frequencies are smaller than 10 Hz, so with low output frequencies, the SSFE generated vibrations along the three directions. Therefore, the SSFE can generate low-frequency vibration signals, matching characteristics of sugarcane field roughness.
Fig. 15Along every direction, curves of the SSFE vibration displacements changing with the SSFE input frequency under different eccentric masses
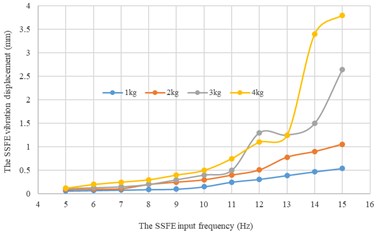
a) Along the axis
b) Along the axis
c) Along the axis
6.3. Analysis on the dynamic characteristic experiment result of the SSFE II
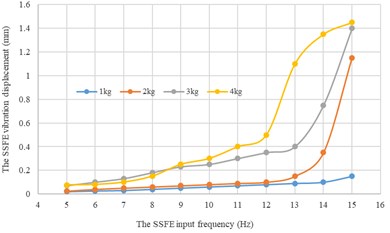
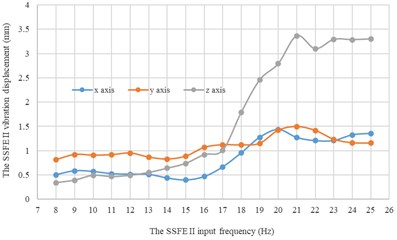
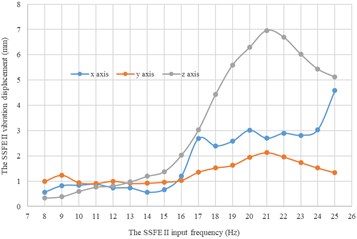
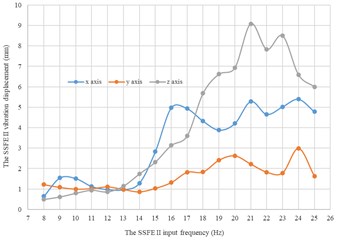
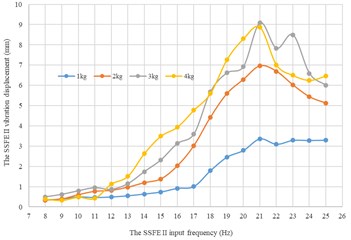
Under every eccentric mass, curves of the SSFE II vibration displacements along the three directions changing with the SSFE II input frequency drawn through Excel are shown in Fig. 16.
According to Fig. 16, under the same eccentric, the SSFE II vibration displacements along two lateral directions are smaller than that along the vertical direction, so lateral-oscillation-limiting devices can limit lateral oscillations of the SSFE II, that is, the SSFE was improved. Therefore, the SSFE II simulates the sugarcane field excitation much more accurately and makes the SHEP much more similar to a sugarcane harvester working in a sugarcane field.
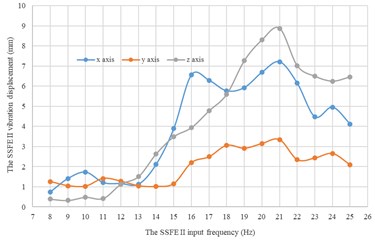
Along every direction, curves of the SSFE II vibration displacements changing with the SSFE II input frequency under different eccentric masses drawn through Excel are shown in Fig. 17.
According to Fig. 17, along the same direction, the greater the eccentric mass is, the greater the SSFE II vibration displacement will be. According to Figs. 16-17, under the same eccentric mass or along the same direction, the greater the SSFE II input frequency is, the greater the SSFE II vibration displacement will be, verifying the discovery obtained through Fig. 8.
Fig. 16Under every eccentric mass, curves of the SSFE II vibration displacements along the three directions changing with the SSFE II input frequency
a) Under a 1 kg eccentric mass
b) Under a 2 kg eccentric mass
c) Under a 3 kg eccentric mass
d) Under a 4 kg eccentric mass
Fig. 17Along every direction, curves of the SSFE II vibration displacements changing with the SSFE II input frequency under different eccentric masses
a) Along the axis
b) Along the axis
c) Along the axis
Moreover, according to Figs. 16-17, wave crests of the SSFE II vibration displacement appear when the SSFE II input frequencies are 16 Hz, 17 Hz, 20 Hz, 21 Hz, 23 Hz and 24 Hz and the SSFE II vibration displacement has an obvious increasing trend when the SSFE II input frequency is greater than 16 Hz. According to Fig. 13(b), the SSFE II output frequencies corresponding to these six input frequencies are 4.69-7.04 Hz, approximately in the main excitation frequency band of sugarcane field roughness signals, 1-6 Hz, making peak values of the SSFE II vibration displacement appear and the SSFE II vibration displacement have an obvious increasing trend. Besides, the SSFE II output frequencies are smaller than 10 Hz, so with low output frequencies, the SSFE II generated vibrations along the three directions. Therefore, the SSFE II can generate low-frequency vibration signals, matching characteristics of sugarcane field roughness.
6.4. Analysis on the LMS modal test result of the SHEP
Seven stages of natural frequencies and correlation coefficients of the SHEP obtained through Modal analysis of LMS Test.Lab are shown in Table 1.
Table 1Seven stages of natural frequencies and correlation coefficients (%) of the SHEP
Stage | Natural frequency (Hz) | 1 | 2 | 3 | 4 | 5 | 6 | 7 |
1 | 6.819 | 100 | 16.086 | 2.807 | 2.407 | 6.679 | 1.105 | 2.334 |
2 | 11.514 | 16.086 | 100 | 12.663 | 5.295 | 16.233 | 0.826 | 4.441 |
3 | 23.198 | 2.807 | 12.663 | 100 | 0.038 | 3.645 | 0.643 | 4.271 |
4 | 43.048 | 2.407 | 5.295 | 0.038 | 100 | 6.913 | 3.305 | 4.455 |
5 | 44.314 | 6.679 | 16.233 | 3.645 | 6.913 | 100 | 0.456 | 4.776 |
6 | 53.481 | 1.105 | 0.826 | 0.643 | 3.305 | 0.456 | 100 | 5.353 |
7 | 62.185 | 2.334 | 4.441 | 4.271 | 4.455 | 4.776 | 5.353 | 100 |
According to Table 1, low correlation coefficients exist between every two natural frequencies of the SHEP, showing these seven stages of natural frequencies have high accuracy and reliability. Besides, the first natural frequency of the SHEP is 6.819 Hz, making the sympathetic vibration of the SHEP appear when the SSFE II output frequencies were 5.86 Hz, 6.14 Hz, 6.74 Hz and 7.04 Hz close to 6-7 Hz, then making peak values of the SSFE vibration displacement appear according to Figs. 16-17.
7. Conclusions
1) Simulations of the mathematical model show the dynamics and the mathematical models of the SHEP are reasonable and the SHEP can simulate a sugarcane harvester working in a sugarcane field.
2) The dynamic characteristic experiment of the SSFE shows it matches characteristics of sugarcane field roughness, but great lateral oscillations existed when it worked, so it needed improvement. Then the SSFE II were developed.
3) The dynamic characteristic experiment of the SSFE II shows it matches characteristics of sugarcane field roughness and lateral-oscillation-limiting devices can limit lateral oscillations of the SSFE II, so the SSFE was improved.
4) The LMS modal test of the SHEP shows its first natural frequency is 6.819 Hz, making the sympathetic vibration of the SHEP appear when the SSFE II output frequencies were 5.86 Hz, 6.14 Hz, 6.74 Hz and 7.04 Hz close to 6-7 Hz, then making peak values of the SSFE vibration displacement appear.
With the SSFE II, simulated experiments of sugarcane harvesters under complete vibration causing conditions of the engine, cutting forces and sugarcane field roughness can be done in labs instead of sugarcane fields to avoid the low efficiency, poor security and bad reliability during experiments in sugarcane fields.
References
-
Fan Qiuju, Huang Qingling, and Wu Hebin, “Prospect and development of sugarcane mechanized harvest at home and abroad,” Sugarcane and Canesugar, Vol. 49, No. 6, pp. 1–11, 2020, https://doi.org/10.3969/j.issn.1005-9695.2020.06.001
-
S. Kroes and H. D. Harris, “Variation of cutting energies along a sugarcane internode,” Agricultural Engineering Australia, Vol. 25, No. 3, p. 55, Aug. 1996.
-
S. Kroes and H. D. Harris, “The specific splitting energy of sugarcane,” Proceedings of the 1998 Conference of the Australian Society of Sugar Cane Technologists held at Ballina, pp. 349–356, May 1998.
-
R. D. C. Mello and H. Harris, “Cane damage and mass losses for conventional and serrated basecutter blades,” Proceedings of the Australian Society of Sugar Cane Technologists, Vol. 22, pp. 84–91, 2000.
-
S. Kroes and H. Harris, “Effects of cane harvester basecutter parameters on the quality of cut,” Proceedings of the Australian Society of Sugar Cane Technologists, pp. 169–179, 1994.
-
R. D. C. Mello and H. Harris, “Desempenho de cortadores de base para colhedoras de cana-de-açúcar com lâminas serrilhadas e inclinadas,” Revista Brasileira de Engenharia Agrícola e Ambiental, Vol. 7, No. 2, pp. 355–358, Aug. 2003, https://doi.org/10.1590/s1415-43662003000200029
-
Liu Qingting, Ou Yinggang, Qing Shangle, and Song Chunhua, “Mechanics analysis on stubble damage of sugarcane stalk during cutting by smooth-edge blade,” Transactions of the Chinese Society for Agricultural Machinery, Vol. 38, No. 9, pp. 51–54, 2007, https://doi.org/10.3969/j.issn.1000-1298.2007.09.013
-
Liu Qingting, Ou Yinggang, and Qing Shangle, “Stubble damage of sugarcane stalks in cutting experiment by smooth-edge blade,” Transactions of the Chinese Society for Agricultural Machinery, Vol. 23, No. 3, pp. 103–107, 2007, https://doi.org/10.3321/j.issn:1002-6819.2007.03.021
-
Liu Qingting, Ou Yinggang, and Qing Shangle, “Study on the cutting mechanism of sugarcane stem,” Journal of Agricultural Mechanization Research, Vol. 2007, No. 1, pp. 21–24, 2007, https://doi.org/10.3969/j.issn.1003-188x.2007.01.006
-
Yang Jian and Chen Guojing, “Experimental study on influencing factors of broken biennial root rate for a single base cutter of sugarcane harvester,” Transactions of the Chinese Society for Agricultural Machinery, Vol. 38, No. 3, pp. 69–74, 2007, https://doi.org/10.3969/j.issn.1000-1298.2007.03.017
-
Yang Wang, Yang Jian, and Liu Zenghan, “Dynamic simulation experiment on effects of sugarcane cutting beneath surface soil,” Transactions of the Chinese society of Agriculture Engineering, Vol. 27, No. 8, pp. 150–156, 2011, https://doi.org/10.3969/j.issn.1002-6819.2011.08.025
-
S. Thanomputra and T. Kiatiwat, “Simulation study of cutting sugarcane using fine sand abrasive waterjet,” Agriculture and Natural Resources, Vol. 50, No. 2, pp. 146–153, Mar. 2016, https://doi.org/10.1016/j.anres.2015.10.001
-
R. C. Mello and H. D. Harris, “Angle and serrated blades reduce damage, force and energy for a harvester basecutter,” Proceedings of the Australian Society Sugar Stalk Technology, Vol. 23, pp. 212–218, 2001.
-
M. A. Momin, P. A. Wempe, T. E. Grift, and A. C. Hansen, “Effects of four base cutter blade designs on sugarcane stem cut quality,” Transactions of the ASABE, Vol. 60, No. 5, pp. 1551–1560, 2017, https://doi.org/10.13031/trans.12345
-
T. C. Ripoli, M. L. C. Ripoli, and M. Sc, “Agr. Eng. Effects of two different base cutters in green cane mechanical harvest,” in International Annual Meeting Sponsored by ASAE Riviera Hotel and Convention Center Las Vegas, 2003.
-
P. C. Johnson, C. L. Clementson, S. K. Mathanker, T. E. Grift, and A. C. Hansen, “Cutting energy characteristics of Miscanthus x giganteus stems with varying oblique angle and cutting speed,” Biosystems Engineering, Vol. 112, No. 1, pp. 42–48, May 2012, https://doi.org/10.1016/j.biosystemseng.2012.02.003
-
Sunil K. Mathanker, Tony E. Grift, and Alan C. Hansen, “Effect of blade oblique angle and cutting speed on cutting energy for energycane stems,” Biosystems Engineering, Vol. 133, pp. 64–70, 2015, https://doi.org/10.1016/j.biosystemseng.2015.03.003
-
S. Kroes and H. D. Harris, “A kinematic model of the dual base cutter of a sugar cane harvester,” Journal of Agricultural Engineering Research, Vol. 62, No. 3, pp. 163–172, Nov. 1995, https://doi.org/10.1006/jaer.1995.1074
-
Rouverson P. Da Silva et al., “Statistical control applied in the process of mechanical sugar cane harvest,” Engenharia Agrícola, Vol. 28, No. 2, pp. 292–304, Jan. 2008.
-
Lai Xiao, Li Shangping, and Ma Fanglan, “Effect of field excitation on cutting quality for sugarcane,” Transactions of the Chinese Society for Agricultural Machinery, Vol. 42, No. 12, pp. 97–101, 2011.
-
Xiao Lai et al., “Simulation and Experimental Study on Sugarcane Field Excitation to the Cutter,” in Advanced Manufacturing Technology, 2010.
-
Wang Peng and Wei Daogao, “Research on the influence of bearing clearance on vibration characteristics of sugarcane cutter,” Agricultural Equipment and Vehicle Engineering, Vol. 51, No. 7, pp. 6–9, 2013, https://doi.org/10.3969/j.issn.1673-3142.2013.07.002
-
Yang Jian, Liang Zhaoxin, and Mo Jianlin, “Experimental research on factors affecting the cutting quality of sugarcane cutter,” Transactions of the Chinese Society of Agricultural Engineering, Vol. 21, No. 5, pp. 60–64, 2005, https://doi.org/10.3321/j.issn:1002-6819.2005.05.014
-
M. F. Pelloso, B. F. Pelloso, A. A. de Lima, and A. H. T. Ortiz, “Influence of harvester and rotation of the primary extractor speed in the agroindustrial performance of sugarcane,” Sugar Tech, Vol. 23, No. 3, pp. 692–696, Jun. 2021, https://doi.org/10.1007/s12355-020-00944-6
Cited by
About this article

This paper with its relevant work is supported by a National Natural Science Foundation Project (China) called Research on critical technologies and mechanisms of continuous precise planting for transversal double-bud sugarcane planters (Grant Number: 52165009), 2021, a Middle-aged and Young Teachers' Basic Scientific Research Ability Promotion Project of Guangxi Universities (China) called Dynamic reverse design research on sugarcane harvesters for hilly areas based on dynamic characteristics of cutters (Project number: 2020KY17008), 2020, a Key University-level Scientific Research Project of Wuzhou University (China) called Reverse design method research on sugarcane harvesters for hilly areas based on dynamic characteristics of cutters (Project number: 2020B003), 2020, a Middle-aged and Young Teachers' Basic Scientific Research Ability Promotion Project of Guangxi Universities (China) called Study on vehicle bridge coupling dynamic characteristics of a truss arch bridge with multi-point elastic constraints (Project number: 2022KY0679), 2022, a National Natural Science Foundation Project (China) called Research on cutting system vibration characteristics of sugarcane harvesters under complicated excitations (Grant Number: 51465006), 2014.
