Abstract
Aiming at the small piston engine carbon deposition fault in the process of running, based on the cylinder pressure and cylinder head vibration signal of the engine, a fault diagnosis method combining variational mode decomposition and support vector machine is used to diagnose the engine carbon deposition fault. Firstly, particle swarm optimization algorithm is used to optimize the parameters of the variational mode decomposition. Then, the intrinsic mode function is obtained by processing the pressure signal and cylinder head vibration signal of the engine. Then, the singular spectrum entropy is calculated by singular value decomposition of the intrinsic mode function. Finally, the singular spectrum entropy is input into the support vector machine classifier as the feature data set for training and testing. The results show that this method can identify the carbon deposition fault of the starting motor well, and the accuracy of fault identification and classification of cylinder pressure and cylinder head vibration signal is 98.33 % and 99.17 % respectively, which verifies the effectiveness of this method.
Highlights
- Aiming at the small piston engine carbon deposition fault in the process of running, based on the cylinder pressure and cylinder head vibration signal of the engine, a fault diagnosis method combining VMD and SVM is used to diagnose the engine carbon deposition fault.
- As the cylinder pressure signal and cylinder head vibration signal belong to nonlinear and non-stationary signals, the accurate judgment of engine fault is realized by using the PSO-SVM to separate the characteristic signal and noise signal from the original data of engine fault.
- The classification accuracy of the SVM based on optimization is higher than that of the SVM without optimization for the fault diagnosis of cylinder pressure and cylinder head vibration.
- The program based on CS-SVM algorithm has shorter running time and higher accuracy, so the CS-SVM algorithm can be selected to be applied in the actual fault diagnosis of engine carbon deposition.
1. Introduction
Small piston engines, which have the advantages of high power per liter, short production cycle and low cost [1], have been widely used in military and aviation fields such as small military special vehicles and small multi-rotor aircraft [2]. As the “heart” of small special vehicles and small multi-rotor aircraft, its working environment is very harsh, which may cause engine parts damage, abnormal engine oil supply, ignition failure, crankshaft fracture [3, 4], engine carbon deposition and other problems [5], thus leading to engine efficiency reduction. However, the status of small piston engine directly affects the safety and reliability of small military special vehicles and small multi-rotor aircraft. If the engine problems are not found in time before starting, it may cause huge losses.
At present, there are relatively few faults diagnosis focus researches focus on small piston engines, common way of checking and monitoring including artificial of engine wiring harness test of electronic components, short circuit, open circuit inspection, etc., or monitoring the working condition of the engine at a constant under various parameters exceed the threshold value using all kinds of sensors [6]. However, only for the inspection of wire harness and the monitoring of working parameters, its fault monitoring function is not perfect, and today’s demand cannot be met. Therefore, in order to make the small piston engine run safely and stably, eliminate potential risks and improve the performance of the engine, it is urgent to strengthen the research on the small piston engine fault diagnosis technology [7].
In frequency domain, the signal processing methods mainly include Fourier transform (FT), wavelet transform (WT), empirical mode decomposition (EMD), etc. However, FT is not suitable for nonlinear and non-stationary signals, WT may have signal distortion, and EMD has mode aliasing and over decomposition. In 2014, Dragomiretskiy and Zosso proposed the Variational Mode Decomposition (VMD) algorithm, which has good applicability when decomposing signals, and the VMD algorithm is theoretically deduced [8]. It is similar in nature to the filter, can eliminate certain noise, and performs better in anti-noise interference, so the VMD algorithm is widely used to process complex signals. Therefore, introducing the VMD algorithm into the field of fault diagnosis of small piston engines, and combined with other algorithms, the extraction of engine characteristic signals and the suppression of noise signals can be achieved, thereby improving the accuracy of fault recognition [9].
Common fault identification methods include artificial neural network (ANN), decision tree (DT) and support vector machines (SVM). Ann is easy to fall into local extremum, and the convergence speed is slow. DT is easy to over fit, ignoring the correlation between attributes. Based on statistical theory, SVM is used to solve the situation of small sample, nonlinear and high-dimensional pattern recognition. It has been widely used in the field of fault diagnosis. For example, Zhang [10] accurately identifies various ship engine faults with support vector machine. At present, there is little research on the adaptability and optimal parameter selection of support vector machine for carbon deposition fault diagnosis of small aviation piston engine.
2. Variational mode decomposition
2.1. VMD algorithm
The variational modal problem first decomposes the signal into intrinsic mode function , and then uses Hilbert transform to obtain the corresponding analytical signal for each component, and then mixes it with the estimated center frequency . When the sum of each component is equal to the signal ’s under constraint conditions [11, 12], the variational problem is Eq. (1):
where is the modal component obtained by decomposition, is the center frequency of each modal component, is the unit impulse function, is the exponential adjustment term, andis the convolution integral.
2.2. Solution of variational mode problem
Using the Lagrange multiplication operator and the penalty factor , the constraint problem can be transformed into an unconstrained problem for solving. Eq. (2) can be obtained by introducing the Lagrange function:
Use the Alternate Direction Method of Multiplier (ADMM) to solve the nonlinear constraint problem of the above function [13], that is, continuously alternate with each other to update , and , so as to find the “saddle point” of Eq. (2) is the optimal solution of Eq. (1), where the expression of is as Eq. (3):
where , .
According to Parseval’s theorem and Fourier transform, Eq. (3) is transformed into the frequency domain, and the non-negative frequency domain interval is integrated, and finally the solution of the secondary optimization problem is obtained, that is, the frequency domain of each mode is updated according to Eq. (4):
Dealing with the value of the center frequency in the frequency domain, each component is updated according to Eq. (5):
where is the Wiener filter of the current remaining amount , is the center of gravity of the power spectrum of the current modal function, perform Fourier transform on , the real part of it is .
update according to Eq. (6):
The specific steps of VMD decomposition are: initialization , , and , execute loop , for all > 0, continuously update , and , repeat the intermediate steps until the accuracy requirements of iterative decomposition are met, and , IMF components are obtained.
3. Particle swarm optimization variational modal decomposition
When using the PSO algorithm (Particle Swarm Optimization, PSO [14]) to optimize the parameters of the VMD algorithm, the parameter combination is first required to determine the evaluation criteria, that is, how to choose the fitness function of the PSO algorithm. Information entropy is a quantifiable indicator. The entropy value corresponds to the sparse characteristic one-to-one [15]. The smaller the value, the stronger the sparse characteristic, and the more obvious the signal characteristics [16]. Therefore, this paper uses the envelope entropy of the signal as the fitness function of the PSO algorithm to optimize the parameters of the VMD algorithm, that is, when the fitness function value is the smallest, the effect of the parameter combination is the best, and the characteristics of the signal are the most obvious [17].
The original signal becomes the envelope signal through Hilbert transform, and the envelope signal can be expressed in the form of probability distribution . Then the envelope entropy of the signal is [18], as in Eq. (7):
where is the envelope signal, and is the normalization of .
Take the in-cylinder pressure signal and cylinder head vibration signal of a small piston engine as an example [19, 20]. After the engine’s in-cylinder pressure signal and cylinder head vibration are decomposed by the VMD algorithm, modal components can be obtained. If the value of is large, then the modal components are mixed with more noise interference. Relatively speaking, when the engine fails, the fault characteristic information contained is less, and the sparse characteristic of the component signal is relatively weak. Conversely, if the value of is small, the noise contained in the modal component is less. Relatively speaking, the more fault characteristic information is included when the engine fails, the more prominent the fault characteristic will be, and the component signal will be displayed a strong sparsity characteristic.
When the VMD algorithm decomposes the engine’s cylinder pressure and cylinder head vibration fault signals, take the parameter combination corresponding to the th particle as the VMD parameter input to decompose the cylinder pressure signal and the cylinder head vibration signal, and modal components can be obtained , calculate the of each modal component, where the smallest is the local minimum entropy value, and the component signals of the corresponding in-cylinder pressure and cylinder head vibration contain the most obvious features of engine carbon deposition faults, but this is only an iteration The local best component of the result. In order to obtain the global minimum entropy value, the local minimum entropy value is used as the fitness value, the particles are updated again to obtain a new parameter combination, and the cylinder pressure and cylinder head vibration signals are re-decomposed to obtain a new component signal. Calculate its entropy value, and select the smallest entropy value from all the entropy values as the global minimum entropy value, and the parameter combination of VMD corresponding to the global minimum entropy value is the optimal parameter combination.
The steps of PSO to optimize VMD are summarized as follows [21]:
(1) Initialize the PSO algorithm parameters and determine the fitness function as ;
(2) Use as the position of the particle, initialize the velocity of the particle;
(3) Update iteration, set and decompose the parameter combinations corresponding to particles in different positions as the parameters of VMD decomposition, and calculate the local minimum entropy of modal components under different parameter combinations;
(4) Compare the fitness value, update the speed and position of the particle, and update the individual extreme value and the group extreme value;
(5) If the iteration termination condition is met, stop updating the iteration. If not, return to step (3), continue to update the velocity and position of the particles, continue to perform VMD decomposition on the cylinder pressure signal and cylinder head vibration signal, and calculate the envelope Entropy value, until the iteration termination condition is met.
4. Data collection and analysis
The method of carbon accumulation is used to collect the data of engine carbon accumulation, namely: reducing the temperature of the first and the second cylinder heads of the engine, increasing the fuel injection pulse width of the engine to increase the fuel injection volume, and making the engine fuel mist at low temperatures to achieve the effect of carbon deposit, using an endoscope to observe the carbon deposit in the engine cylinder every 2h, after 8h, the engine starts to deposit slightly, and after 16h, there is serious carbon deposit in the cylinder. At this time, three sets of data with the excess air coefficient of 0.85, 1.0, and 1.1 in the case of engine carbon deposits are collected respectively [22]. Dismantling the engine, the soot cleaning, using the same method of operation, the data in the normal functioning of the engine acquisition.
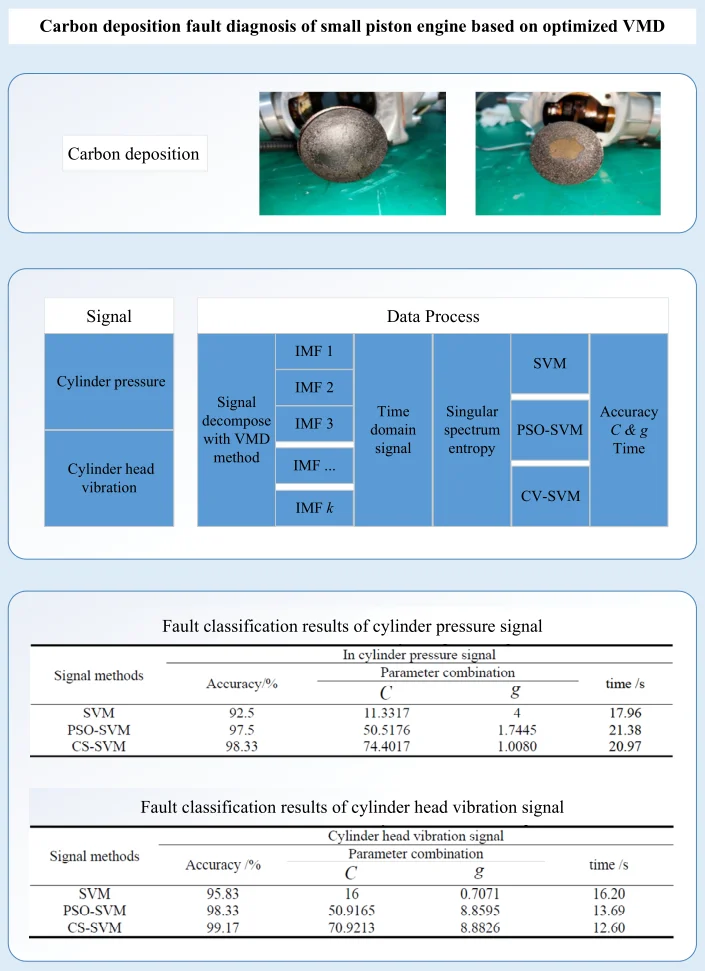
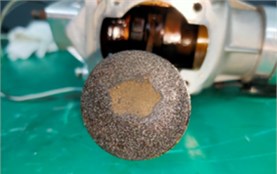
Fig. 1Carbon deposition on engine piston head
4.1. Cylinder pressure data
The carbon deposits produced by piston engines are mainly attached to the piston head and combustion chamber of the engine. Since the size of the combustor is fixed, when carbon deposits are generated in the combustor and the piston head, the combustor space is relatively smaller, and the mixture takes up less space at TDC. So, when the piston of the engine runs to TDC, the cylinder pressure of the engine with carbon deposition is greater than that without carbon deposition.
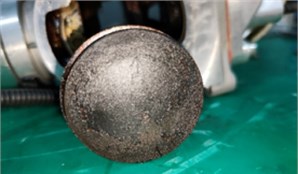
Fig. 2Pressure signal in cylinder of engine without carbon deposition at 5000 rpm
Fig. 3Cylinder pressure signal of engine with carbon deposition at 5000 rpm
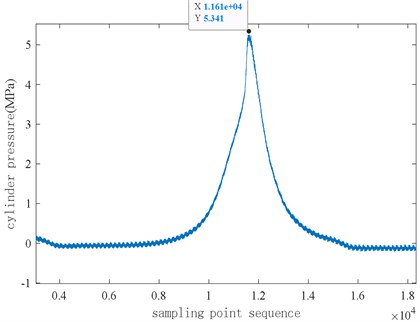
Fig. 2 and Fig. 3 respectively show the distribution of in-cylinder pressure signal with and without carbon deposition when the engine is at 5000 rpm and the excess air coefficient is 1. When there is no carbon deposition in the engine cylinder, the maximum pressure in the cylinder is about 4.886 MPa, when the engine has carbon deposition, the maximum pressure in the cylinder is about 5.341 MPa. When there is carbon accumulation, the cylinder pressure rises faster, that is, the cylinder pressure rise rate is larger, and there is a fluctuating peak near the pressure peak. Under two different working conditions, the maximum pressure in the cylinder is obviously different, so it can be concluded that when the pressure in the cylinder increases significantly and there is a pulse at the peak time, the engine may produce carbon deposition fault.
4.2. Cylinder head vibration
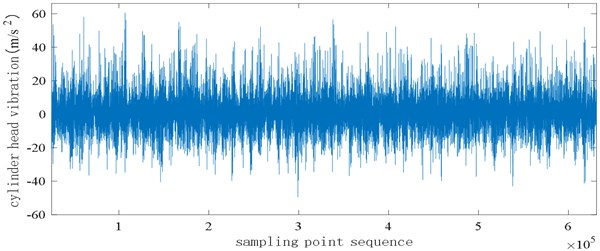
Fig. 4 and Fig. 5 respectively show the time-domain diagram of the cylinder head vibration signal when the engine is at 5000 rpm and the excess air coefficient is 1, when the engine has no carbon deposits and when the engine has carbon deposits. It can be seen from the figure that when the engine has no carbon deposits, the maximum value of the cylinder head vibration signal is about 40 m/s2, and when carbon deposits occur in the engine cylinder, the maximum value of the cylinder head vibration signal is about 60 m/s2. The main reason is that when the engine produces carbon deposits, the high temperature of the carbon deposits continuously heats the mixed gas, increasing the temperature of the mixed gas, and the carbon deposits have their own volume and accumulate in the combustion chamber and piston head. The compression ratio is increased in disguised form. The combustion of the mixed gas leads to an increase in the pressure in the cylinder and the vibration of the cylinder head.
Fig. 4Cylinder head vibration signal at 5000 rpm without carbon deposition
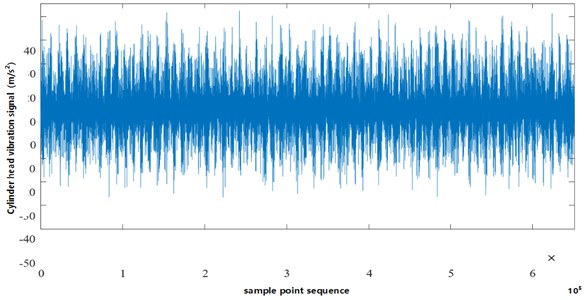
Fig. 5Cylinder head vibration signal at 5000 rpm with carbon deposition
4.3. Signal decomposition based on VMD
There are three sets of in-cylinder pressure and engine cylinder head vibration data under different excess air coefficients, from which the data with the fuel injection correction coefficient excess air coefficient of 1 is selected for comparative analysis, and the two operating conditions with and without carbon deposition are respectively analyzed, the speed is 5000 rpm and the excess air coefficient is 1.0 data for decomposition.
First, the in-cylinder pressure and cylinder head vibration data under the condition that the engine speed is 5000 rpm, no carbon deposits, and 1 are subjected to variational modal decomposition. The optimal parameter combination of the in-cylinder pressure signal after particle swarm optimization variational modal decomposition is [5, 2351], and the smallest envelope entropy value is 5.6213. Similarly, the particle swarm optimization algorithm is performed on the parameter combination of the cylinder head vibration signal to obtain the optimum. The optimal parameter combination of it is [6, 2348], the minimum envelope entropy value is 4.9438, the number of modes of the pressure signal in the cylinder is set to 5, the penalty factor is 2351, and the number of modes of the cylinder head vibration signal is set to 6, and the penalty factor is 2248, perform VMD decomposition respectively, and the results of decomposition are shown in Fig. 6 and Fig. 7 [23, 24].
Fig. 6VMD decomposition of ƛ is 1.0, cylinder pressure without carbon deposition
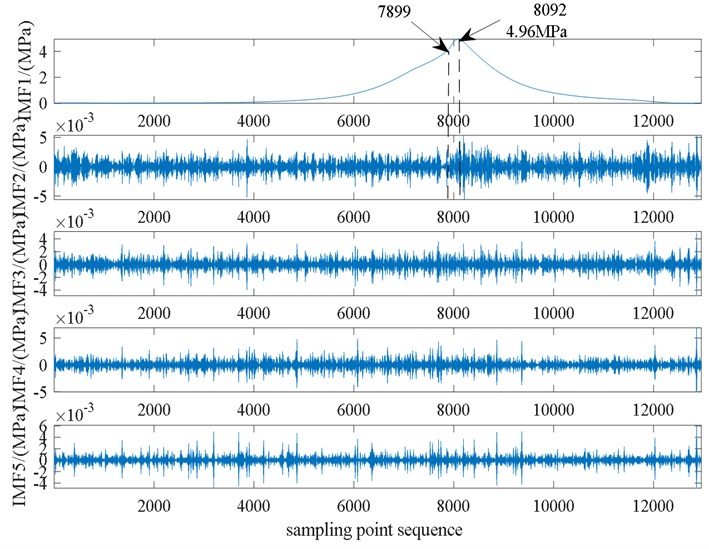
It can be found from Fig. 6 and Fig. 7 that the first-order IMF1 component of the cylinder pressure signal and the cylinder head vibration signal are both reconstructions of the original signal. Combining the first-order modal component and the second-order modal component of the in-cylinder pressure signal, it can be found that the engine enters the rapid ignition period at the sampling point of 7899. From this point, the in-cylinder pressure begins to rise rapidly, and at the sampling point when it is 8092, the pressure in the cylinder reaches the maximum value of 4.96 MPa. Comparing the VMD decomposition diagram of the cylinder head vibration signal, it can be found that starting from the sampling point 7899, the vibration signal fluctuates greatly. When the engine enters the rapid combustion period, the combustion speed accelerates rapidly and produces a strong impact, which causes the pressure in the cylinder and the cylinder head vibration signal begins to change rapidly, so the decomposition result of the cylinder head pressure and cylinder head vibration that is 1 in the absence of carbon deposits can better characterize the combustion process of the engine.
Fig. 7VMD decomposition of ƛ is 1.0, cylinder head vibration without carbon deposition
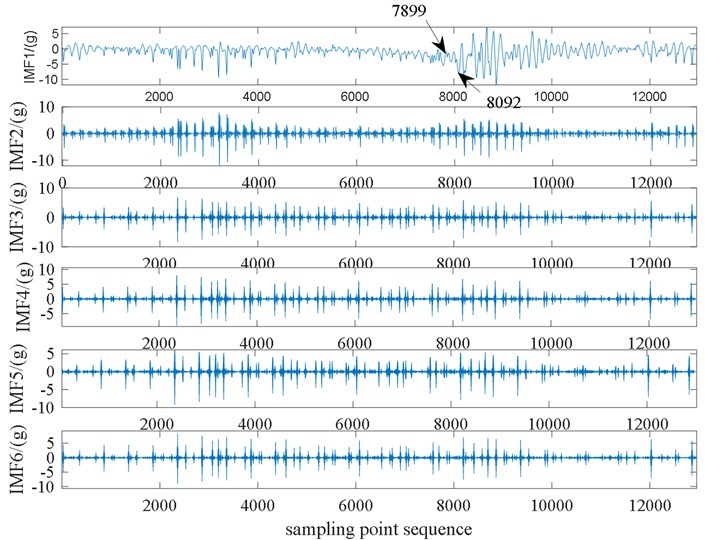
Fig. 8VMD decomposition of ƛ is 1.0, cylinder pressure with carbon deposition
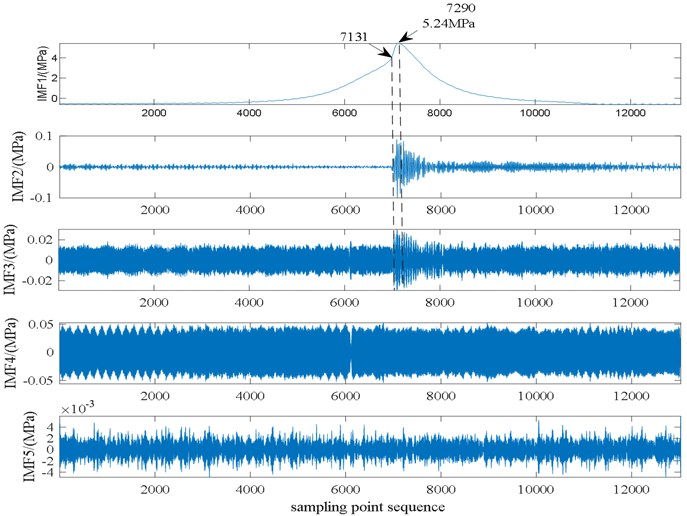
Similarly, the variational modal decomposition of the cylinder pressure and cylinder head vibration data when the engine speed is 5000 rpm and the carbon deposit is 1. The optimal combination of pressure parameters in the cylinder after particle swarm optimization and variational modal decomposition is [5, 2386], and the minimum envelope entropy value is 6.3562. Particle swarm optimization is performed on the parameter combination of the cylinder head vibration signal to obtain the optimal parameters. The combination is [6, 2138], the smallest envelope entropy value is 5.0143, and the in-cylinder pressure signal and the cylinder head vibration signal are respectively decomposed by VMD. The results of the decomposition are shown in Fig. 8 and Fig. 9.
From the first three-order modal components of the in-cylinder pressure signal, it can be found that the engine enters the rapid burning period at the sampling point 7131. Compared with the case of no carbon deposits, it can be found that the energy density in this area is relatively concentrated in the case of carbon deposits, and the cylinder pressure began to rise rapidly from this point, and the cylinder pressure reached the maximum value of 5.28 MPa when the sampling point was 7290. This is mainly because carbon deposits are generated in the engine cylinder. The carbon deposits themselves have a certain volume and accumulate on the cylinder head and piston head, which is equivalent to reducing the volume of the combustion chamber, increasing the compression ratio, and the carbon deposits have high temperatures, the preheating of the mixed gas increases the temperature of the mixed gas and intensifies the combustion, thereby increasing the maximum pressure in the cylinder.
Fig. 9VMD decomposition of ƛ is 1.0, cylinder head vibration with carbon deposition
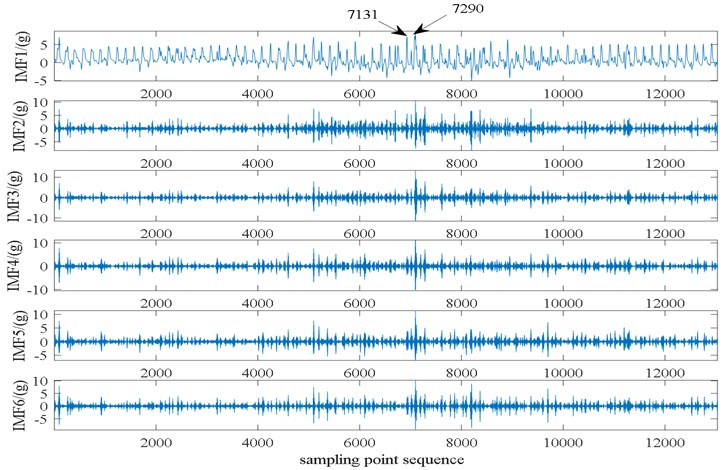
Comparing the VMD decomposition diagram of the cylinder head vibration signal, we can find that starting from the sampling point 7131, the vibration signal fluctuations of each modal component are relatively large, and the amplitude of each modal component is slightly increased compared to the case of no carbon deposits, which indicates that the cylinder head vibration increases when the engine produces carbon deposits. Combined with the minimum envelope entropy value of the engine cylinder pressure and the cylinder head vibration signal, it can be found that the envelope entropy value in the case of carbon deposition is greater than that in the case of no carbon deposition, which indicates that the engine burns more intensely in the case of carbon deposition.
5. Engine carbon deposit fault diagnosis
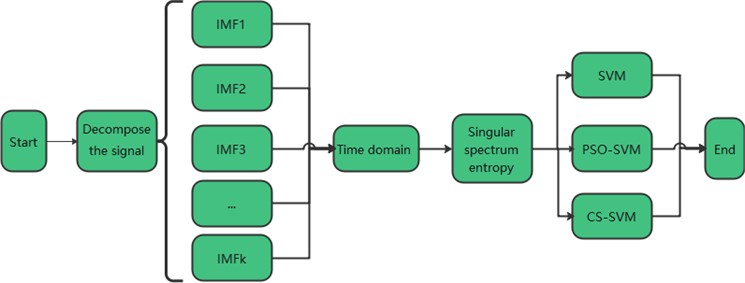
In the previous article, the engine fault data has been collected, and the data has been preprocessed, a large quantitative analysis in the time domain has been done. Then, the in-cylinder pressure signal and the cylinder head vibration signal under different working conditions have been decomposed by VMD, and the differences between different working conditions have been analyzed. In order to further diagnose and identify the carbon deposit fault of the engine, the singular spectrum entropy is used as the feature vector as the input of the support vector machine classifier to perform the engine fault diagnosis and identification. The fault diagnosis process is roughly shown in Fig. 10.
Fig. 10Flow chart of engine fault diagnosis
5.1. Fault type mark
In the previous article, the in-cylinder pressure data and the cylinder head vibration data under the working conditions of a of 0.85, 1.0 and 1.1 have been collected for the engine in two states with and without carbon deposits. In order to facilitate the identification of the engine's carbon deposit fault, it is now necessary to label and classify a total of 6 sets of data in two different states. The first is the three sets of data under the condition of no carbon deposits, which represent the normal state. They are respectively recorded as is 1.0 corresponding to category label 1, is 1.1 corresponding to category label 2, and is 0.85 corresponding to category label 3. And then there is accumulation the three sets of data in the case of carbon indicate the fault state. Among them, the category label corresponding to is 1.0 under carbon accumulation is 4, the category label corresponding to is 1.1 under carbon accumulation is 5, and the category label corresponding to is 0.85 under carbon accumulation is 6. The category label of the engine fault type is shown in Table 1.
Table 1Engine fault category label
No carbon deposit | Carbon deposit | |||||
1.0 | 1.1 | 0.85 | 1.0 | 1.1 | 0.85 | |
Fault category | normal | Carbon deposit | ||||
Category label | 1 | 2 | 3 | 4 | 5 | 6 |
5.2. Fault diagnosis of engine carbon deposit
The purpose of Support Vector Machine [25] is to solve classification problems, which has efficient pattern recognition capabilities, and has been well applied in the field of fault diagnosis [26]. Therefore, it can be introduced into the field of small piston engine fault diagnosis to realize accurate identification of engine carbon deposit faults.
5.2.1. Based on SVM
Use the SVMcgForClass function attached to the Libsvm toolkit to perform a grid search on the penalty parameter and the kernel function parameter , and get the bestC and bestg according to the accuracy of the training set classification. Use the best and for SVM model training. During training, set to 0 to select the C-SVC model, and set the kernel function type t to the RBF kernel function. After the training of the SVM model, the test set is used to verify the generalization classification performance of the model.
First, the 6 sets of data are divided into the training set and the test set according to the ratio of 100:20 into the characteristic data of 120 working cycles in each group, and input into the SVM model. The in-cylinder pressure data and the engine cylinder head vibration data are respectively compared for fault diagnosis.
The actual classification and prediction classification of the cylinder head vibration test set are shown in Fig. 11.
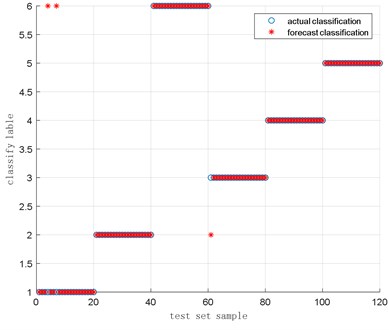
It can be found from Fig. 11 that in the 120 sets of data under 6 different working conditions in the cylinder head vibration test set, there are 5 misclassified samples in the actual classification compared with prediction classification, among them one prediction sample with a category label of 2 is classified into the category label of 5, that is, a sample with no carbon deposits and is 1.1 is classified into a sample with carbon deposits and is 1.1; 2 predicted samples with a category label of 5 are classified into samples with a category label of 6, that is, 2 samples with carbon deposit and is 1.1 are classified into samples with carbon deposit and is 0.85; 2 predicted samples with category label of 6 are classified into samples with a category label of 5, that is, 2 samples with carbon deposit and is 0.85 are classified into the samples with carbon deposit and is 1.1; the classification accuracy of the overall test set is about 95.83 % (115/120). The optimal parameters are respectively 0.7071, 16. The running time of the program is 16.20 s.
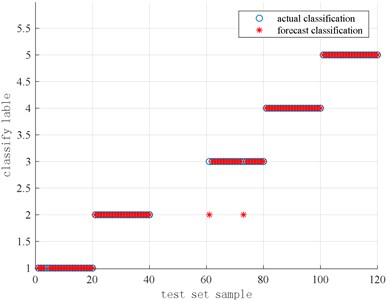
Using SVM to identify and classify the pressure signal in the cylinder, the classification result is shown in Fig. 12.
Fig. 11Results of actual classification and predicted classification of cylinder head vibration data based on SVM
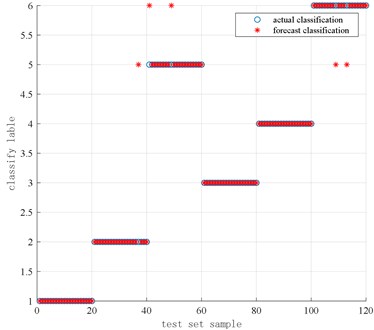
Fig. 12Results of actual classification and predicted classification of cylinder pressure data based on SVM
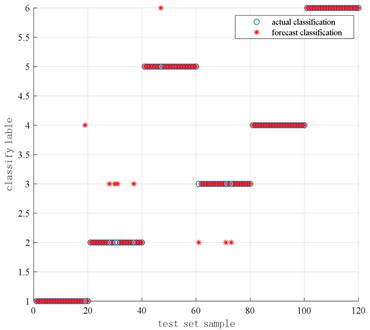
It can be found from Fig. 12 that in the 120 sets of data under 6 different working conditions in the cylinder pressure test set, there are 9 misclassified samples in the actual classification compared with prediction classification, of which 1 prediction sample with the category label of 1 is classified into the category label of 4, that is, 1 sample with no carbon deposit of 1.0 is classified into a sample with carbon deposit of 1.0; 4 predicted samples with a category label of 2 are classified into samples with a category label of 3. That is, 4 samples with no carbon deposit of 1.1 are classified into samples with no carbon deposit of 0.85; 3 predicted samples with a category label of 3 are classified into samples with a category label of 2, that is, no carbon deposit is 0.85 3 samples of are classified into samples with no carbon deposit of 1.1; 1 predicted sample with a category label of 5 is classified into samples with a category label of 6, that is, 1 sample with carbon deposit of 1.1 is classified into There is a sample with a carbon deposit of 0.85; the classification accuracy of the overall test set is about 92.5 % (111/120). The optimal parameters are respectively 11.3137, 4 and the running time of the program is 17.96 s.
5.2.2. Based on PSO-SVM
For the selection of penalty parameters and kernel function parameters of SVM, the cross-validation method is used to optimize the parameter and , that is, the first limit the parameter and to a certain range, and then divide the original data proportionally to obtain the training set and the test set. To verify the training set, take the parameter and of the training set corresponding to the highest accuracy rate, and input this parameter and as the parameter of the test set.
PSO optimizes the SVM parameters. According to the cross-validation method, the highest classification accuracy of the training set is used as the fitness function, and the PSO-SVM classifier is established to identify the carbon deposit fault of the engine.
Similarly, a total of 6 sets of data with and without carbon deposits in the engine are selected. Each set of data contains 120 cycles of work cycles, which are input into the optimized SVM model to diagnose the carbon deposit faults of the engine, that is, use the PSO algorithm to optimize SVM recognizes and classifies the vibration signal of the cylinder head, and the result of the classification is shown in Fig. 13.
It can be found from Fig. 13 that in the 120 sets of data in the cylinder head vibration test set of 6 different working conditions after the particle swarm optimization SVM, there are 2 misclassified samples in the actual classification compared with predicted classification, and 1 of them has a category label of 1. A predicted sample is classified into the sample with the category label of 3, that is, a sample with no carbon deposit and is 1.0 is classified into the sample with no carbon deposit and is 0.85; a predicted sample with the category label of 2 is classified into the category label of 3, that is, 1 sample with no carbon deposit and is 1.1 is classified into the sample with no carbon deposit and is 0.85, the classification accuracy rate of the overall test set is about 98.33 % (118/120). Compared with the unoptimized SVM classifier, the accuracy rate of 95.83 % is increased by 2.5 %, and the classification effect is better. Among them, the optimal parameters are respectively 50.9165, 8.8595 and the running time of the program is 13.69 s.
Fig. 13Results of actual classification and predicted classification of cylinder head vibration data based on PSO-SVM
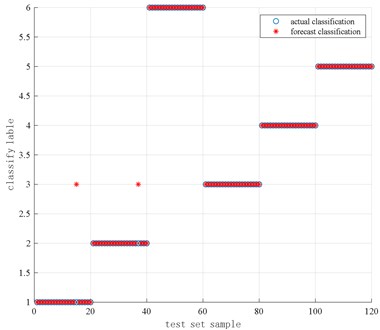
Fig. 14Results of actual classification and predicted classification of cylinder pressure data based on PSO-SVM
Use PSO algorithm to optimize SVM to identify and classify the in-cylinder pressure signal. The result of classification is shown in Fig. 14.
It can be found from Fig. 14 that after the particle swarm optimization SVM in-cylinder pressure test set of 120 sets of data under 6 different working conditions, there are 3 misclassified samples in the actual classification compared with prediction classification, among which the 2 prediction samples with the category label of 1 is classified into the samples with a category label of 6, that is, two samples with no carbon deposit and is 1.0 are classified into a sample with carbon deposit and is 0.85; a predicted sample with a category label of 3 is classified into a category label of 2, that is, 1 sample without carbon deposit and is 0.85 is classified into the sample without carbon deposit and is 1.1; the classification accuracy rate of the overall test set is about 97.5 % (117/120), Compared with the SVM classifier without optimization, the accuracy rate is increased by 5 %, the optimal parameters are respectively 50.5176, 1.7445 and the running time of the program is 21.38 s.
5.2.3. Based on CS-SVM
The Cuckoo Search algorithm (CS) proposed by Yang and Deb [27] has the characteristics of random search path optimization and strong optimization ability. The algorithm is based on levy flight and uses a random walk search method to achieve fast and efficient optimization.
Similar to the particle swarm optimization algorithm, the CS algorithm also uses the training set for training to obtain the highest classification accuracy, and uses the parameter combinations and at the highest accuracy as the parameter combination and of the engine carbon deposition fault test set to classify carbon deposit faults [28].
Also select 3 sets of data with and without carbon deposits in the engine, a total of 6 sets of data, each set of data contains 120 cycles of work cycles, input to the optimized SVM classifier to diagnose the carbon deposit fault of the engine. The result of the diagnosis is shown in Fig. 15 below.
Fig. 15Results of actual classification and prediction classification of cylinder head vibration data based on CS-SVM
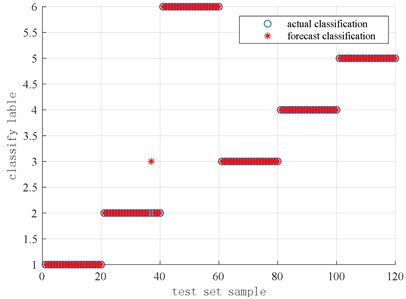
Fig. 16Results of actual classification and predicted classification of cylinder pressure data based on CS-SVM
It can be seen from Fig. 15 that the CS algorithm is used to optimize the SVM to identify and classify the cylinder head vibration signal. The cylinder head vibration test set by the Cuckoo search algorithm to optimize the SVM has 120 sets of data under 6 different working conditions, there are 1 misclassified sample in the actual classification compared with prediction classification, where a predicted sample with a category label of 2 is classified into a sample with a category label of 3, that is, 1 sample with no carbon deposits and is 1.1 is classified into a sample with no carbon deposits and is 0.85 Among them, the classification accuracy of the overall test set is about 99.17 % (119/120). Compared with the unoptimized SVM classifier, the accuracy rate of 95.83 % is increased by 3.34 %, and the classification effect is better. Among them, the best parameters are respectively 70.9213, 8.8826, and the running time of the program is 12.60 s.
Use the CS algorithm to optimize the SVM to identify and classify the in-cylinder pressure signal, and the classification result is shown in Fig. 16.
It can be found from Fig. 16 that in the 120 sets of data in the 6 different working conditions in the cylinder pressure test set of the SVM optimized by the cuckoo search algorithm, there are 2 misclassified samples in the actual classification compared is predicted classification, among which two prediction samples with the category label of 3 are classified into the samples with the category label of 2, that is, the two samples with no carbon deposit and is 0.85 are classified into the sample with no carbon deposit and is 1.1; the classification accuracy rate of the overall test set is about 98.33 % (118/120). Compared with the unoptimized SVM classifier, the accuracy rate of 92.50 % is increased by 5.83 %. The best parameters are 74.4017 and 1.0080 the running time of the program is 20.97 s.
5.3. Results
The classification results of the above three methods based on the cylinder head vibration signal and the cylinder pressure signal are shown in Table 2 and Table 3.
Table 2Fault classification results of cylinder pressure signal
Signal methods | In cylinder pressure signal | |||
Accuracy / % | Parameter combination | Time /s | ||
SVM | 92.5 | 11.3317 | 4 | 17.96 |
PSO-SVM | 97.5 | 50.5176 | 1.7445 | 21.38 |
CS-SVM | 98.33 | 74.4017 | 1.0080 | 20.97 |
It can be seen from Table 2 and Table 3 that the classification accuracy of the engine carbon deposition fault diagnosis based on the cylinder head vibration signal is slightly higher than that of the in-cylinder signal, which indicates that the cylinder head vibration sensor is more adaptable to the engine carbon deposition fault diagnosis. Compared with the cylinder pressure sensor, the cylinder head vibration sensor is low in price, easy to install, and has a better classification effect on the carbon deposit fault diagnosis of small piston engines. Therefore, the cylinder head vibration sensor can be used in the actual commissioning process of the engine.
Table 3Fault classification results of cylinder head vibration signal
Signal methods | Cylinder head vibration signal | |||
Accuracy / % | Parameter combination | Time /s | ||
SVM | 95.83 | 16 | 0.7071 | 16.20 |
PSO-SVM | 98.33 | 50.9165 | 8.8595 | 13.69 |
CS-SVM | 99.17 | 70.9213 | 8.8826 | 12.60 |
In addition, the diagnosis result of engine carbon accumulation fault based on SVM can be found by comparing with the diagnosis result based on PSO-SVM and CS-SVM that the diagnosis results of optimized SVM classifier have improved to varying degrees. The classification accuracy rate has reached 99.17 %, which means the effect is very good. Compared with PSO-SVM, the program running time of CS-SVM algorithm is shorter and has higher accuracy. Therefore, the CS-SVM algorithm can be applied to the fault diagnosis of engine carbon deposition.
6. Conclusions
1) As the cylinder pressure signal and cylinder head vibration signal belong to nonlinear and non-stationary signals, the accurate judgment of engine fault is realized by using the particle swarm optimization (PSO) variational mode decomposition method to separate the characteristic signal and noise signal from the original data of engine fault.
2) The classification accuracy of the SVM based on optimization is higher than that of the SVM without optimization for the fault diagnosis of cylinder pressure and cylinder head vibration.
3) The program based on CS-SVM algorithm has shorter running time and higher accuracy, so the CS-SVM algorithm can be selected to be applied in the actual fault diagnosis of engine carbon deposition.
References
-
J. C. Guo, “Dynamics analysis and nonlinear control of model-scale unmanned helicopters,” Tianjin University, Tianjin, 2014.
-
J. G. Mao, L. Ma, and M. H. Chen, “Study on simulation and control strategy of small air piston engine hybrid power system,” Journal of Chongqing University of Technology (Natural Science), Vol. 32, No. 3, pp. 68–78, 2018.
-
L. Lin, “Analysis and elimination of common faults of diesel engine crank connecting rod mechanism,” Agricultural Machinery Using and Maintenance, No. 7, p. 61, 2018, https://doi.org/10.14031/j.cnki.njwx.2018.07.051
-
Y. Jia, “Simulation and monitoring of typical faults of diesel engine gear train and crank connecting rod mechanism,” Beijing University of Chemical Technology, Beijing, 2018.
-
Z. Y. Yao, “Research and application of typical faults mechanisms and monitoring and diagnosis method for Priston engine,” Beijing University of chemical technology, Beijing, 2017.
-
G. Li, Y. Li, H. Chen, and W. Deng, “Fractional-order controller for course-keeping of underactuated surface vessels based on frequency domain specification and improved particle swarm optimization algorithm,” Applied Sciences, Vol. 12, No. 6, p. 3139, Mar. 2022, https://doi.org/10.3390/app12063139
-
W. Deng, Z. Li, X. Li, H. Chen, and H. Zhao, “Compound fault diagnosis using optimized MCKD and sparse representation for rolling bearings,” IEEE Transactions on Instrumentation and Measurement, Vol. 71, pp. 1–9, 2022, https://doi.org/10.1109/tim.2022.3159005
-
K. Dragomiretskiy and D. Zosso, “Variational mode decomposition,” IEEE Transactions on Signal Processing, Vol. 62, No. 3, pp. 531–544, Feb. 2014, https://doi.org/10.1109/tsp.2013.2288675
-
X. X. Jiang, “Research on the nonstationary vibration signal of key parts of gearbox and its fault diagnosis method,” Nanjing University of Aeronautics and Astronautics, Nanjing, 2016.
-
Y. Zhang., “Fault diagnosis of ship engine based on support vector machine,” Ship Science and Technology, Vol. 41, No. 22, pp. 106–108, 2019.
-
C. H. Qu, W. S. Xu, L. F. Guo, and W. B. Lin, “Research on weak fault diagnosis of rolling bearing based on parameter optimization variational mode decomposition,” Machine Tools and Hydraulics, Vol. 48, No. 9, pp. 162–167, 2020.
-
Y. J. Wu, “Research on fault diagnosis of wind turbine transmission system based on variational mode decomposition,” North China Electric Power University, Beijing, 2016.
-
Y. Luo, “Vibration fault diagnosis of wind turbines based on variational mode decomposition and firefly optimized probabilistic neural network,” Xi’an University of Technology, 2019.
-
J. Kennedy and R. Eberhart, “Particle swarm optimization,” in Proceedings of ICNN’95 – International Conference on Neural Networks, 1995, https://doi.org/10.1109/icnn.1995.488968
-
L. Ding, R. L. Zeng, H. Shen, H. M. Zhao, and R. Zeng, “Engine fault diagnosis method based on Shannon entropy,” Journal of Vibration and Shock, Vol. 37, No. 21, pp. 233–239, 2018, https://doi.org/10.13465/j.cnki.jvs.2018.21.033
-
Y. H. Jiang, B. P. Tang, W. Y. Liu, and S. J. Dong, “Fault feature extraction method based on parameter optimized Morlet wavelet transform,” Chinese Journal of Scientific Instrument, Vol. 31, No. 1, pp. 56–60, 2010, https://doi.org/10.19650/j.cnki.cjsi.2010.01.010
-
G. J. Tang and X. L. Wang, “Parameter optimized variational mode decomposition method with application to incipient fault diagnosis of rolling bearing,” Journal of Xi’an Jiaotong University, Vol. 49, No. 5, pp. 73–81, 2015.
-
E. Q. Song, “Application of VMD in GPR data processing based on parameter optimization and kurtosis comparison,” Jilin University, 2019.
-
B. Y. Sun, “Crankshaft fault diagnosis and research based on vibration signal,” Shandong University, Jinan, 2019.
-
L. Y. Peng, “Research on fault diagnosis and state identification of rolling bearing based on vibration signal,” China University of Mining and Technology, Xuzhou, 2019.
-
W. L. Wang, “Research on leakage protection method of underground frequency conversion system based on PSO-VMD,” Henan University of Technology, 2018.
-
X. Zhang et al., “Custom-molded offloading footwear effectively prevents recurrence and amputation, and lowers mortality rates in high-risk diabetic foot patients: a multicenter, prospective observational study,” Diabetes, Metabolic Syndrome and Obesity: Targets and Therapy, Vol. 15, pp. 103–109, Jan. 2022, https://doi.org/10.2147/dmso.s341364
-
W. Deng et al., “An enhanced fast non-dominated solution sorting genetic algorithm for multi-objective problems,” Information Sciences, Vol. 585, pp. 441–453, Mar. 2022, https://doi.org/10.1016/j.ins.2021.11.052
-
H. Cui, Y. Guan, and H. Chen, “Rolling element fault diagnosis based on VMD and sensitivity MCKD,” IEEE Access, Vol. 9, pp. 120297–120308, 2021, https://doi.org/10.1109/access.2021.3108972
-
V. N. Vapnik, “An overview of statistical learning theory,” IEEE Transactions on Neural Networks, Vol. 10, No. 5, pp. 988–999, 1999, https://doi.org/10.1109/72.788640
-
H. Y. Wang, J. H. Li, and F. L. Yang, “Overview of support vector machine analysis and algorithm,” Application Research of Computers, Vol. 31, No. 5, pp. 1281–1286, 2014.
-
X.-S. Yang and Suash Deb, “Cuckoo Search via Lévy flights,” in 2009 World Congress on Nature and Biologically Inspired Computing (NaBIC), pp. 210–214, 2009, https://doi.org/10.1109/nabic.2009.5393690
-
Z. H. Liang, J. T. Cao, and X. F. Ji, “Fault diagnosis of rolling bearing based on EEMD and Cs-SVM,” Journal of Mechanical and Electrical Engineering, Vol. 36, No. 6, pp. 622–627, 2019.
About this article

This work was supported in part by the project named which is sponsored by National Natural Science Foundation of China (Grant Number 51775269), and the Natural Science Foundation of Jiangsu Province Higher Education Institutions of China (Grant Number 13KJB510005).
