Abstract
By introducing much stricter criteria into VMD, the successive VMD (SVMD) originating from VMD is proposed, which is more suitable for extracting fault feature of faulty rolling bearing than VMD, especially the inner race failure or cage failure, because the frequency spectrum structure of the above two kinds of failures take on the compact frequency spectrum distribution characteristic of the center frequency with sidebands, which is compliant with the criteria of SVMD. In addition, the optimal number of modes does not need to be determined in advance for SVMD, and SVMD could decompose and extract the optimal modes adaptively. So SVMD is used in the paper for modes extraction of the faulty signal of rolling bearing. Unfortunately, the impulse characteristic components might be distributed in each mode more or less in the decomposition processes of SVMD, and the fault features is impossible to be extracted effectively only based on a single mode. Accordingly, a mode regrouping strategy based on sparsity index is proposed to regroup the modes containing useful fault information. At last, the regrouped signal is analyzed by using envelope spectral and satisfactory fault features are extracted. Through the verification of simulation, SVMD has better comprehensive performance compared with other time-frequency analysis methods such as VMD, VME and EEDD. Effectiveness of the proposed method is verified by one experimental and one engineering vibration data respectively. Besides, the advantage of the proposed method compared with the advanced analysis method, that is, Mkurtogram is also verified through comparison.
Highlights
- SVMD is used in feature extraction of bearing' weak fault to decompose the multi-component and non-stationary vibration signal of faulty bearing into several modes adaptively, and some interferences could be eliminated initially.
- A signal reconstruction method based on sparsity index is proposed to reconstruct the obtained series of modes of the rolling bearing' original vibration signal by using SVMD, and the optimal reconstructed signal containing the main fault characteristics is obtained and used for further envelope spectral analysis.
- Advantages of both SVMD and the sparsity index based signal reconstruction strategy are used comprehensively in the extraction of weak fault features of rolling bearing.
1. Introduction
As the most widely used key rotating component in modern machinery, the safe operating state of rolling bearing often influences the whole unit. Due to the ease of acquisition, reliability and containing rich equipment status information of vibration signals, fault diagnosis method based on vibration characteristics has been becoming one of the mainstream methods. Due to the interferences of other rotating components such as rotor and the problem of signal attenuation caused by the signal acquisition path, the collected vibration signal of rolling bearing often takes on the characteristic of multi-component, resulting in the problem that the fault feature of faulty bearing often takes on very weak. Besides, the vibration signal of rolling bearing also shows non-stationary characteristic due to the speed fluctuations. Therefore, the traditional analysis methods such as envelope spectrum [1], autoregressive model [2] and singular value spectrum [3],etc. are on longer suitable for analyzing the multi-component and non-stationary characteristics vibration signal of faulty bearing. With the rapid evolvement of artificial intelligence, fault diagnosis methods utilizing deep learning have been achieved remarkable results [4-8]. However, the real-time performance of deep learning in engineering application is difficult to be guaranteed. Kinds of new fault diagnosis technologies based on signal processing have also been emerging. Among them, the time-frequency analysis methods could reflect the characteristics of the analyzed signal in time and frequency domains simultaneously, and has been received extensive attention and application in the area of fault diagnosis. Wavelet transform derived from Fourier transform has good multi-resolution analysis ability, which has been applied widely in the fault diagnosis field of rolling bearing in recent years [9-11]. As a self-adaptive time-frequency analysis method, EMD could decompose a non-stationary, nonlinear and multi-component signal into several intrinsic mode functions (IMFs) adaptively based on the local characteristics of the analyzed signal, and kinds of literatures relating to EMD have been arising [12-14]. However, some inherent defects exist in wavelet transform and EMD which are difficult to overcome: proper wavelet basis should be preselected and the selection of wavelet basis has great influence on the decomposition effect of wavelet transform. Over-envelope, under-envelope and mode aliasing problem coexist in EMD. Besides, the mathematical theory of EMD is relatively weak. Although the subsequent EMD improved methods such as EEMD [15-16] and CEEMD [17] have solved the above defects of EMD to a certain extent, there are disadvantages such as large amount of calculation being difficult to overcome.
Fortunately, a completely non-recursive method named as variational mode decomposition (VMD) [18] proposed by Konstantin et al. could be used as an alternative time-frequency analysis method for wavelet transform and EMD to decompose the non-stationary and multi-component vibration signal of faulty bearing. The fractal features of the vibration signal of faulty bearing was studied by the proposed novel fractal dimension estimation method based on VMD, and analyzed results indicated that the fractal characteristics of vibration signals could be expressed by the proposed method effectively [19]. VMD was used to extract the weak fault transients for realizing the fault diagnosis of gearbox under varying speed successfully [20]. VMD was integrated with the convolutional neural networks (CNNs) for fault diagnosis of rotating machinery, and the integrated method had a good extrapolation performance under different scenarios [21]. The energy entropy of each mode obtained by VMD was calculated and used as fault features to classify the different types of bearing vibration signals of wind turbines [22], and its advantage over the other related methods was verified.
However, one of the dilemmas of VMD being confronted in application is the determination of the optimal number of decomposition modes: selection of the number of modes often depends on experience which might result in great contingency of the decomposition results. Up to now, kinds of methods have been arising to solve the above dilemma. A coarse-to-fine decomposing strategy of VMD was proposed to avoid controlling the decomposition parameters simultaneously and used for extracting of repetitive transients [23]. The mode number of VMD was determined approximately by a novel fault information-guided VMD using the fault cyclic frequency and the statistical threshold at a specific significance level [24]. A sparsity index was introduced to determine the number of modes of VMD and a sparsity-oriented VMD method was proposed for gearbox fault diagnosis based on built-in encoder information. Besides, the de-noising ability of the proposed sparsity-oriented VMD was improved significantly compared with traditional VMD [25]. An improved adaptive VMD was proposed and combined with an adaptive sparse code shrinkage to extract periodic impulses effectively [26]. A parameter optimization VMD method was proposed to extract the energy entropy of each decomposed modes, then the extracted feature vectors are used as input of deep learning to realize fault diagnosis of flywheel bearing [27]. The impulse sensitive index-Gini was used in sailfish algorithm as a fitness function to optimize VMD parameters, and the proposed method could optimize the parameters of VMD with high quality [28]. Although appropriate parameter values could be obtained by the above VMD improved methods, a larger number of iterative trials are needed by most of them compared with traditional VMD, resulting in a lower computational efficiency [26]. SVMD proposed by Mojtaba Nazari [29] could extract the modes successively, which is contrary to VMD, because the modes are extracted concurrently by VMD. Besides, with a lower computational complexity, SVMD has a relative higher computation efficiency being compared with most of the above VMD improved methods, and the number of modes also does not need to be predefined by SVMD. SVMD has been applied for ECG-Derived-Respiration signal [29], but its application in fault diagnosis has not been reported up to now, whose potential remains to be tapped, so the paper attempts to use SVMD in feature extraction of faulty bearing. Due to the wideband property of the impulse characteristic components of faulty bearing’ vibration signal, SVMD might suffer from the over-decomposition issue, i.e., the impulse components might be split into different modes, which is same as the other related methods such as EMD, VMD and so on. So it is impossible to extract fault features effectively based only on a single mode. To solve the problem, a mode regrouping scheme based on sparsity index is proposed to regroup the modes containing useful fault information. At last, envelope spectral is applied on the regrouped signal and satisfactory feature extraction result is obtained. Main contributions of the paper are as follows: 1) SVMD is used in feature extraction of bearing’ weak fault, which could decompose the multi-component and non-stationary vibration signal of faulty bearing into several modes adaptively, and some interferences could be eliminated initially. 2) A signal reconstruction method based on sparsity index is proposed to reconstruct the obtained series of modes of the rolling bearing’ original vibration signal by using SVMD, and the optimal reconstructed signal containing the main fault characteristics is obtained and used for further envelope spectral analysis. 3) Advantages of both SVMD and the sparsity index based signal reconstruction strategy are comprehensively used in the extraction of weak fault features of rolling bearing.
The rest of the paper is organized as follows. Section 2 and section 3 are dedicated to the theories of the proposed SVMD and the signal reconstruction strategy based on sparsity index respectively. Flow chart of the proposed method and its details are presented in Section 4. Experiment and engineering verification of the proposed method are also given in Section 4. Comparison is carried out in Section 5. At last, conclusions are drawn in Section 6.
2. Successive variational mode decomposition (SVMD)
The essence of SVMD is to perform VME [30] on the analyzed signal successively, and the termination condition is that all the modes contained in the analyzed signal are extracted or the error between the sum of all the extracted modes and the analyzed signal is smaller than the set threshold. Some constraints are added in the extraction processes of VME to avoid it from converging to the previous extracted mode. That is to say, suppose that modes have been extracted and the next mode is needed to be determined. In order to achieve this goal, an optimization problem needs to be resolved for finding a signal with the most compact spectrum (that is, the th mode). The reconstruction error could be reduced after themode is added to the sum of the previous extracted modes. In order to describe SVMD mathematically, it is assumed that the analyzed signal is decomposed into two parts: the th mode and the residual signal , which could be expressed as following:
where the residual signal is used as the new analyzed signal to be extracted in the next step, which is also consisted of two components: the sum of the extracted modes and the unprocessed component , that is:
SVMD is based on the following four standards, and three of them are identical to VME:
(1) The distribution of each mode should be around its center frequency tightly. Therefore, the following criteria should be minimized for the th mode:
where is the center frequency of the th mode, and * represents the convolution symbol.
(2) It should minimize the energy of the residual signal at the frequency where has the most effective component [18], and this constraint could be achieved by using a filter with the following frequency response same as the ideology of VME:
Therefore, in order to minimize the phenomenon of spectral overlap existing between and , it should minimize the energy of the signal being filtered by , and the following criteria is used to minimize the phenomenon of spectral overlap existed between the residual signal and the th mode:
where represents the impulse response of the filter as shown in Eq. (4).
(3) The extracted th mode might be one of the obtained modes by minimizing and , and this problem could be avoided more effectively if has less energy at the center frequency of the obtained modes, which could be achieved by using the method similar to , that is, using a filter with the following frequency response:
So, the following equation is used to represent the new added criteria :
where represents the impulse response of the filter as shown in Eq. (6).
(4) The fourth constraint is to ensure the complete reconstruction of the analyzed signal using the obtained modes and the unprocessed component of the analyzed signal:
Therefore, the extraction problem of the th mode could be transformed into the combined minimization problem of , and when the modes are known, that is:
where is the parameter to balance , and , and it could be solved by Lagrange Multiplier algorithm. To ensure the better convergence and the fidelity of reconstruction under noise interference, the enhanced Lagrangian function based on the combination of the quadratic penalty term with the Lagrangian multiplier is constructed:
where is the Lagrange multiplier. After using the Parseval equation and changing the variables in the first term, Eq. (10) could be rewritten as following:
Same as VMD and VME, the alternate direction method of multipliers algorithm (ADMM) [18] is used to solve Eq. (11), and the details could be referred to related references [18, 30].
3. SVMD with sparsity index regrouping scheme
Due to the broadband characteristics of the impulse vibration signal of faulty rolling bearing, the impulse characteristic component of faulty bearing might be decomposed into multiple modes by SVMD. In addition, lack or omission of useful fault information might be caused by selecting only one mode obtained by SVMD for further envelope spectral analysis. Therefore, it is necessary to regroup the series of modes obtained by SVMD, and then envelope spectral analysis is further performed on the selected optimal reconstructed signal. To solve this problem, a mode signal sorting and regrouping scheme based on a sparsity index, naming Gini index (GI) is proposed in the paper, and GI has stronger resistance to noise and random shock than the other impulse sensitive indexes such as kurtosis and negative entropy [31]:
The five signals shown in Eq. (21) are used to verify the reliability of GI in measuring the impulse characteristics of faulty bearing’ vibration signal. The five types of signals as shown in Fig. 1(a) are the time domain addition of two sinusoidal signals (Sig1), random noise (Sig2), random noise with one single shock (Sig3), random noise with three shocks (Sig4) and random noise with continuous shocks (Sig5). The GI, Hoyer measure [32], L2/L1 [33] norm and kurtosis indexes of the five signals are calculated respectively, and their normalized values are shown in Fig. 1(b): it could be seen that GI increases with a gradual increasing trend with the increasing amount of repetitive impulse components through comparison. However, the other three indicators do not have the characteristic same as GI. This simulation further verifies that GI has stronger immunity to random shocks and random noises, and also has advantage in reflecting the repetitive impulse characteristic of faulty bearing’ vibration signal.
Fig. 1Five signals with their four indexes
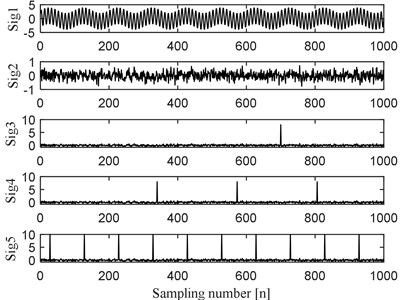
a) Five signals
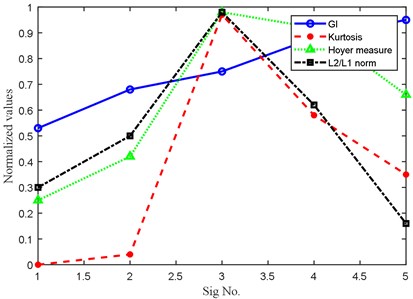
b) Four indexes corresponding to the five signals as shown in Fig. 1(a)
The calculation formula of GI is as following:
where represents the norm, SE is the discrete squared envelope form of the analyzed signal, is the ascending order form of SE, i.e., . The calculation formula of SE is as following:
where is the analytical signal of , represents Hilbert transform, and .
Supposing the analyzed signal is decomposed into modes (including the decomposition residual) by SVMD, then the GI values of each mode are calculated separately and the modes are sorted in descending order according to their calculated GI values, i.e., , in which is the obtained modes and represents their corresponding calculated GI values. The signal regrouping scheme basing on GI could be described simply as follows:
, where
let ;
remove from the mode signal set
end.
4. Flow chart of the proposed method and the verifications
4.1. Flow chart of the proposed method
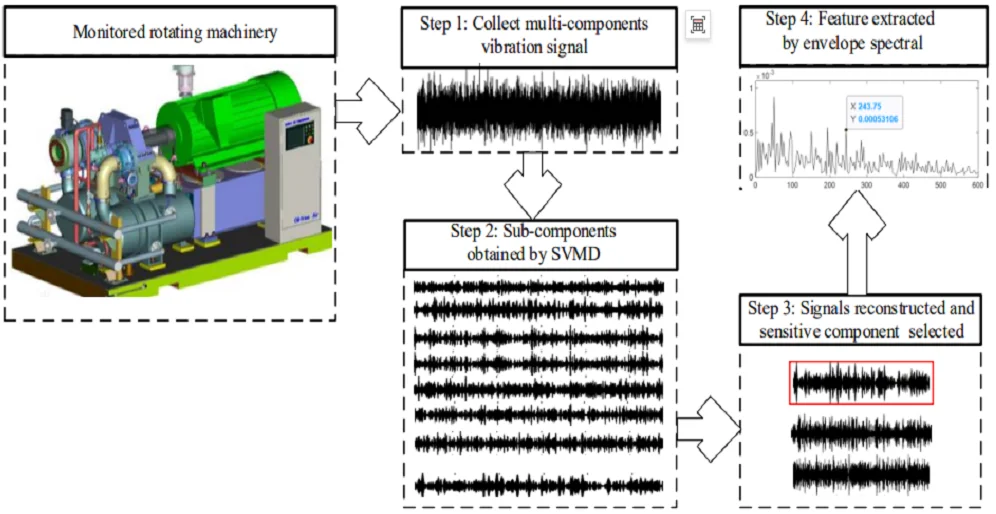
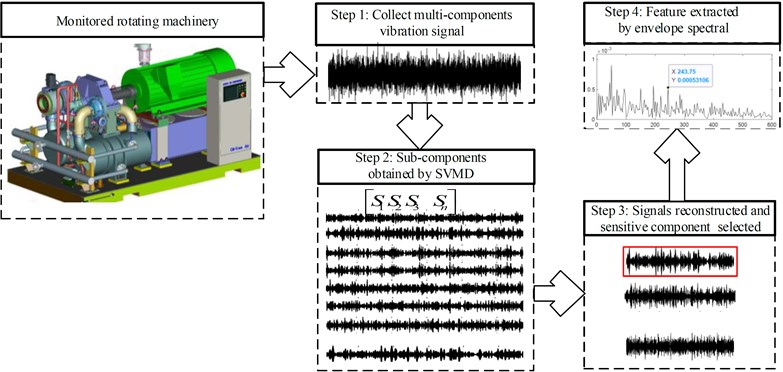
The overall flow chart of the proposed method is shown in Fig. 2. The vibration signal of faulty bearing not only contains the impulse characteristic components, but also contains the rotating frequency and its harmonic frequency components of the supported rotor. Besides, it is also affected by the interference of background noise and the signal attenuation caused by signal acquisition path, so that the features of faulty bearing are often very weak. The above phenomenon is much more evident especially in case of when early weak failure occurs in rolling bearing, and it is difficult to obtain good effect by applying time domain or frequency domain methods on the multi-component and non-stationary vibration signal of faulty bearing directly. According to the proposed method as described in Fig. 2, the vibration signal of the faulty bearing is collected firstly. Subsequently, apply SVMD on the collected vibration signal containing multi-component and decompose it into a series of modes containing single component. As mentioned in the previous section, the impulse characteristic component of faulty bearing takes on broadband feature, and it is very likely to decompose the impulse characteristic component into multiple modes, that is, the problem of over-decomposition arising. The over-decomposition problem will result in the dispersion of signal features, so satisfactory fault feature might not be obtained only based on a single mode. Then the proposed signal sorting and regrouping frame based on the sparsity index (SI) is used to regroup the obtained series of modes and fault information sensitive signal is reconstructed and selected for further envelope spectral analysis. At last, envelope spectral analysis is applied on the reconstructed signal and satisfactory fault features are extracted.
Fig. 2Flow chart of the proposed method
4.2. Experiment verification
The accelerated life test of rolling bearing is carried out on the test rig as shown in Fig. 3, which is composed of a test head, a test head base, a transmission system, a loading system, a lubrication system, a computer control system and a data acquisition system. Specific details of the experiment could be referred to Ref [34]. One of the test bearings named as B12 is used as an example in this section to verify the effectiveness of the proposed method, and it takes 2469 minutes from the installation and operation of B12 to its complete failure. Type of the accelerator collecting the vibration signal is PCB-348A. The kurtosis index curve over B12’ life cycle is given in Fig. 4(a), based on which it could be observed that the kurtosis index is stable until the 2297th minute, and it indicates that the 2297th minute is the critical moment of the complete failure of B12. It will be more convincing to take the vibration data collected at the 2297th minute as the vibration data of B12’ early weak fault to verify the effectiveness of the proposed method. Since the energy of the impact characteristic signal component of rolling bearing’ early failure stage is very weaker compared with the energy of background noise, time domain waveform of the vibration data at the 2297th minute as presented in Fig. 4(b) could not reflect the failure effectively. Apply envelope spectral analysis on the signal as presented in Fig. 4(b) and the result is given in Fig. 4(c), which also could not extract the fault characteristic frequency due to the irregularity distribution of the spectral lines. Apply the proposed method on the signal as shown in Fig. 4(b), and decompose it firstly using SVMD and the decomposed series of modes are shown in Fig. 5(a).
Fig. 3Test rig for the REB lifecycle degradation evaluation
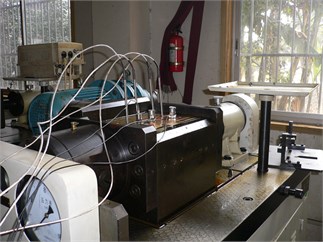
Fig. 4Vibration signal of the test bearing at its early weak fault stage
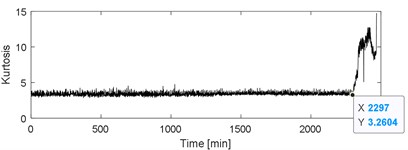
a) Kurtosis index of the test bearing over its whole life
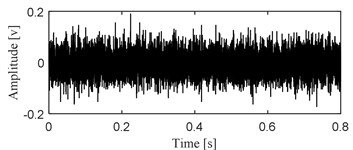
b) Time domain waveform of the vibration data at 2297th minute
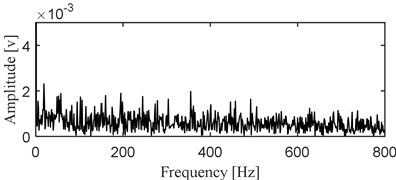
c) Envelope spectral result of the signal as shown in Fig. 4(b)
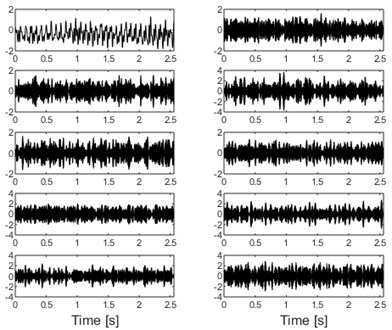
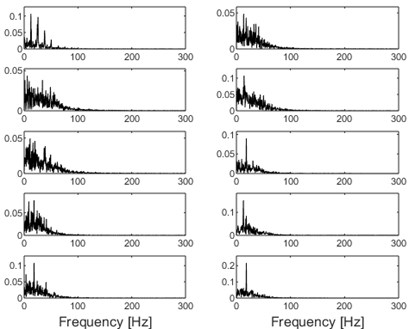
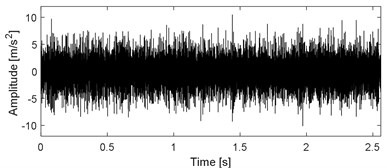
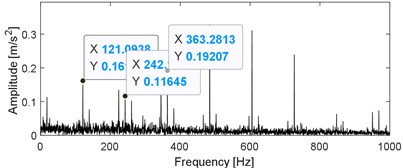
The conventional method is to decompose the multi-component vibration signal of faulty bearing to obtain a series of modes by using SVMD, and then the kurtosis index of each mode is calculated in view of the sensitivity of the impulse characteristic signal component to the kurtosis index. Subsequently, the mode with the largest kurtosis index is selected for envelope spectral analysis and the fault features are extracted. In the paper, envelope spectral analysis is performed on all the modes shown in Fig. 5(a) and the results are shown in Fig. 5(b), based on which the fault features could not be identified. The reason is that although SVMD could decompose the original complex signal into a series of relatively single modes, due to the broadband characteristics of the impulse characteristic components when fails arises in rolling bearing, the impulse characteristic components may still be decomposed into multiple modes more or less during the decomposition process., that is, the over-decomposition problem occurring. Besides, as verified in Fig. 1, the optimal mode is very likely to be mis-selected and the problem of subsequent misdiagnosis due to the sensitivity of kurtosis index to the accidental shocks caused. The series of modes shown Fig. 5(a) are reconstructed based on the sparsity index regrouping scheme proposed in the paper, and time domain waveform of the final reconstructed signal is presented in Fig. 6(a). Apply envelope spectral analysis on the signal as shown in Fig. 6(a) and the result is given in Fig. 6(b), based on which the inner race fault characteristic frequency of the faulty bearing is extracted effectively, and the fault diagnosis conclusion is verified by Fig. 7 after the disassembly of the faulty bearing.
Fig. 5Decomposition results of the signal as shown in Fig. 4(b) using SVMD
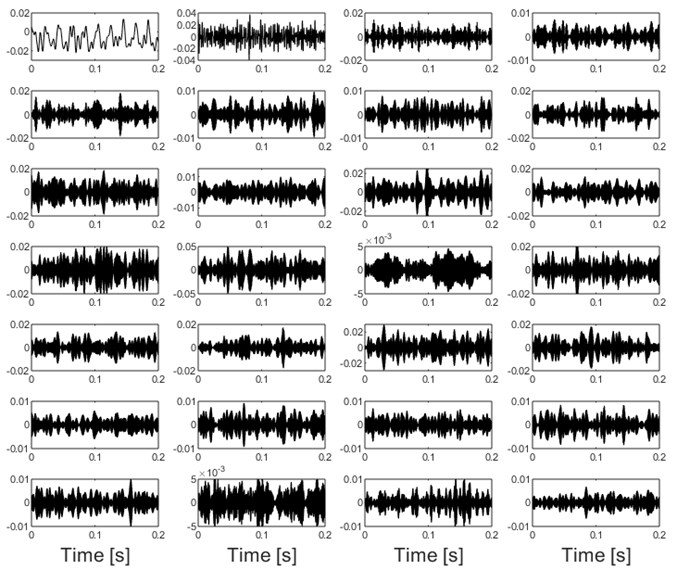
a) Decomposition results of the signal as shown in Fig. 4(b) by using SVMD
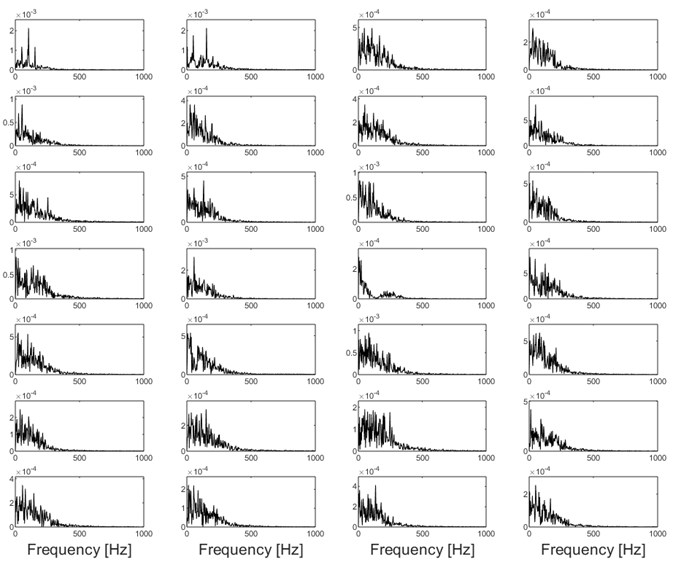
b) Envelope spectral analysis results of the modes as shown in Fig. 5(a)
Fig. 6The reconstructed signal of test bearing with its envelope spectral analysis result
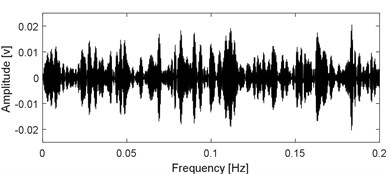
a) Reconstructed signal using the modes as shown in Fig. 5(a) based on sparsity index regrouping scheme
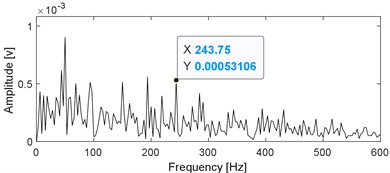
b) Envelope spectral of the signal as shown in Fig. 6(a)
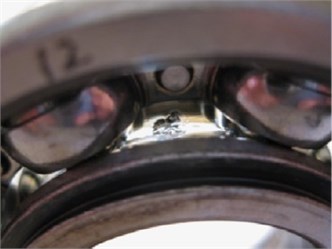
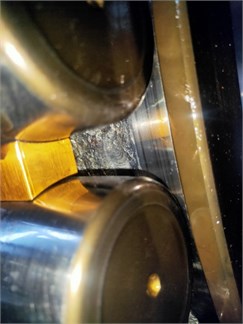
Fig. 7The inner race fault occurs in B12
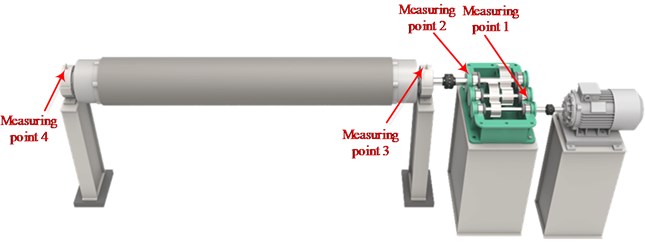
4.3. Engineering verification
The monitored object is the overpressure roll of a paper mill, whose three-dimensional schematic diagram and the layout of the measuring points are shown in Fig. 8: the work roll is driven by motor through a gearbox. The rated power and speed of the driving motor is 710 kW and 1490 RPM respectively, and the output shaft speed of the gearbox is 475 RPM. Vibration signals were collected from the monitored object on January 20, 2022 and January 21, 2022 respectively, and the measured values of the four measuring points in Fig. 8 are shown in Table 1. The signal acquisition equipment adapts the equipment status detection and safety evaluation system produced by Zhengzhou expert technology., Ltd. The sensor is an accelerator, whose type is EAG01-100, and its sensitivity is 100 mv/g.
Fig. 8Three-dimensional schematic of the engineering object with the layout of measuring points
It could be observed from Table 1 that the vibration amplitude of measuring point 4 on January 21 increased significantly compared with that on January 20, while the vibration amplitudes of the other measuring points are relatively stable. The type of the monitored rolling element bearing corresponding to measuring point 4 is given in Table.2, and its fault characteristic frequencies are also presented in Table.2. Time domain waveform of the collected vibration signals corresponding to measuring point 4 is presented in Fig. 9(a) based on which the impulse characteristic of the vibration signal of faulty bearing could not be observed, and its envelope spectral analysis result is given in Fig. 9(b). Though some relatively clear spectral line structures could be obtained based on Fig. 9(b), the inner race fault characteristic frequency could not be identified. Apply SVMD on the original engineering signal and the decomposition results are shown in Fig. 10(a). Compare the series of modes shown in Fig. 10(a) with the original signal and the impulse characteristics of each mode are enhanced intuitively, but their corresponding envelope spectral analysis results as shown in Fig. 10(b) still could not extract the fault features. Apply the sparsity index reconstruction strategy on the series of modes and time domain waveform of the reconstructed signal is given in Fig. 11(a), and its corresponding envelope spectral result is shown in Fig. 11(b): the inner race fault characteristic frequency with it harmonics are extracted evidently, so it is concluded that failure arises on the inner race of the engineering bearing, and the accuracy of fault diagnosis result is verified after shutdown of the machine and disassembly of the engineering bearing (as shown in Fig. 12).
Table 1Measured amplitudes of the four measuring points
Measuring points | Measuring directions | Vibration amplitudes of January 20 (mm/s2) | Vibration amplitudes of January 21 (mm/s2) |
1 | Horizontal | 5.72 | 6.17 |
2 | Horizontal | 9.68 | 9.01 |
3 | Vertical | 1.49 | 1.91 |
4 | Vertical | 4.02 | 10.37 |
Fig. 9Vibration signal of the engineering bearing with its envelope spectral analysis result
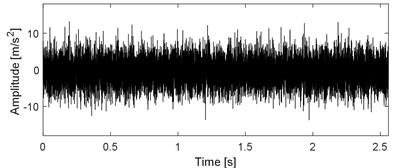
a) Time domain waveform of the vibration signal of engineering bearing
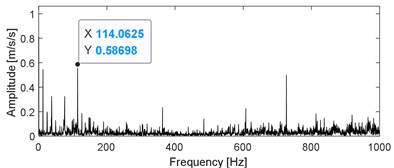
b) Envelope spectral analysis result of the signal as shown in Fig. 9(a)
Fig. 10Decomposition results of the signal as shown in Fig. 9(a) using SVMD
a) Decomposition results of the signal as shown in Fig. 9(a) by using SVMD
b) Envelope spectral analysis results of the modes as shown in Fig. 10(a)
Table 2Fault characteristic frequencies of the engineering bearing
Bearing type | ||||
230/560 CA/W33 | 121 | 100.5 | 3.6 | 42.2 |
Fig. 11The reconstructed signal of the engineering bearing with its envelope spectral analysis result
a) Reconstructed signal using the modes as shown in Fig. 10(a) based on sparsity index regrouping scheme
b) Envelope spectral analysis result of the signal as shown in Fig. 11(a)
Fig. 12The fault occurring on the inner race of the engineering bearing
5. Comparison
In order to verify the advantages and disadvantages of SVMD for multi-component signal decomposition of early weak fault of rolling bearing, it is compared with the other three relatively advanced time-frequency analysis methods (VMD, VME and EEMD). The three indexes for comparison are as follows:
(1) RMSE: The calculation equation is given in Eq. (15), and the higher accuracy of decomposition and reconstruction with the smaller value of RMSE:
where is the original signal, and represents the reconstructed signal using the obtained series of modes.
(2) Iteration number: The total sifting iteration number of sifting process. The higher efficiency of decomposition will be with the smaller value of iteration number. Ideally, it is much better with the smaller value of iteration number without affecting the decomposition accuracy.
(3) CPU time: The total time consumed by the time-frequency decomposition methods. The higher efficiency of the time-frequency decomposition methods with the less CPU time. The CPU time was collected by Matlab2019a installed on a computer with an Inter (R) Core (TM) i5-3470 CPU, 16.00 GB RAM, and an operation system of Windows 10 Professional.
Analyze the above three index’ calculated results of the four methods as shown in Table 3 comprehensively, and the superiority of SVMD over the other three methods could be identified: the RMSE of SVMD is the smallest and it calculation time is also the least. Besides, the iteration number of SVMD is relatively small.
Table 3Indexes comparison of the four time-frequency methods for signal decomposition
Method | RMSE | Iteration number | CPU time |
SVMD | 0.625 | 308 (28×11) | 1.482 |
VMD | 1.232 | 280 (28×10) | 2.425 |
VME | 1.114 | 324 (27×12) | 3.253 |
EEMD | 2.326 | 338 (26×13) | 4.589 |
Then, the Mkurtogram method proposed by Liao et al. is also used for comparison [35]. The analyzing results of the original experimental signal using fast Mkurtogram are presented in Fig. 13. Though the calculation efficiency of Mkurtogram is higher than the proposed method and the FCF of the experimental bearing’ inner race is extracted as presented in Fig. 13(c), the harmonics of FCF are not extracted, and the reason is due to the effect of low sampling frequency when resampling is required using the Mkurtogram method.
Fig. 13The experimental signal shown in Fig. 4(b) using fast Mkurtogram
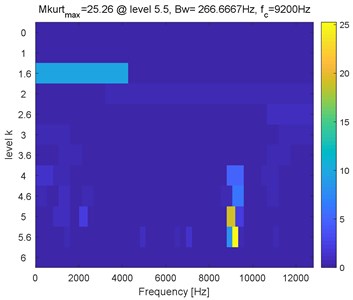
a) FDMK
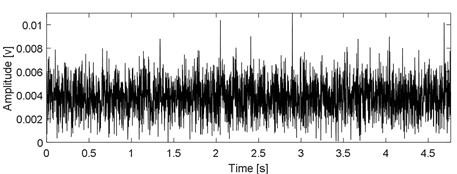
b) Waveform of the filtered signal
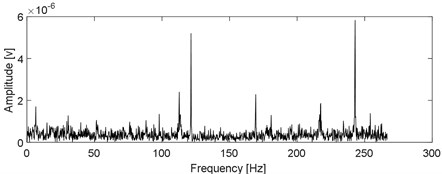
c) The envelope spectral of (b)
6. Conclusions
A rolling bearing weak fault diagnosis utilizing successive variational mode decomposition with sparsity index reconstructing strategy is proposed in the paper. Firstly, SVMD is used instead of VMD and other time-frequency analysis methods such as EMD, wavelet transform to decompose the multi-component complex vibration signal of rolling bearing’ early weak fault into a series of modes. The comparison of relevant parameters shows that SVMD has better comprehensive performance compared with other advanced time-frequency analysis methods. Then the obtained series of modes are reconstructed based on the sparsity index reconstruction strategy. Simulation shows that the proposed sparsity index has stronger robustness in evaluating the impulse characteristic signal of faulty bearing compared with kurtosis and other advanced indexes. In addition, due to the broadband characteristic of the impulse characteristic fault signal of faulty bearing, the signal reconstruction strategy based on the sparsity index could avoid the over-decomposition phenomenon caused by SVMD effectively while decomposing the original fault signal. Finally, the envelope spectral analysis is applied on the reconstructed signal and fault features of faulty bearing could be extracted successfully.
The proposed method is mainly solving at weak fault diagnosis of rolling bearing under stable working conditions. However, variable load and speed fluctuation are the common working condition of rolling, and concurrent faults, that is, composite faults are more common. The further research will carry out the fault diagnosis of rolling bearing under variable working conditions and the composite fault diagnosis of rolling bearing on the basis of the proposed method.
References
-
F. Jiang, Y. Chang, Z. Zhu, and W. Li, “Fault diagnosis of rotating machinery based on time-frequency decomposition and envelope spectrum analysis,” Journal of Vibroengineering, Vol. 19, No. 2, pp. 943–954, Mar. 2017, https://doi.org/10.21595/jve.2017.17232
-
J. S. Cheng, D. J. Yu, and Y. Yang, “A fault diagnosis approach for roller bearings based on EMD method and AR model,” Mechanical Systems and Signal Processing, Vol. 20, pp. 350–362, 2006, https://doi.org/10.1016/j.ymssp.2004.11.002
-
J. Wang et al., “Modified singular spectrum decomposition and its application to composite fault diagnosis of gearboxes,” Sensors, Vol. 19, No. 1, p. 62, Dec. 2018, https://doi.org/10.3390/s19010062
-
K. N. Ravikumar, A. Yadav, H. Kumar, K. V. Gangadharan, and A. V. Narasimhadhan, “Gearbox fault diagnosis based on multi-scale deep residual learning and stacked LSTM model,” Measurement, Vol. 186, p. 110099, Dec. 2021, https://doi.org/10.1016/j.measurement.2021.110099
-
Z. Ye and J. Yu, “Deep morphological convolutional network for feature learning of vibration signals and its applications to gearbox fault diagnosis,” Mechanical Systems and Signal Processing, Vol. 161, p. 107984, Dec. 2021, https://doi.org/10.1016/j.ymssp.2021.107984
-
X. Li, H. Jiang, M. Niu, and R. Wang, “An enhanced selective ensemble deep learning method for rolling bearing fault diagnosis with beetle antennae search algorithm,” Mechanical Systems and Signal Processing, Vol. 142, p. 106752, Aug. 2020, https://doi.org/10.1016/j.ymssp.2020.106752
-
Z. Chen, A. Mauricio, W. Li, and K. Gryllias, “A deep learning method for bearing fault diagnosis based on cyclic spectral coherence and convolutional neural networks,” Mechanical Systems and Signal Processing, Vol. 140, p. 106683, Jun. 2020, https://doi.org/10.1016/j.ymssp.2020.106683
-
M. Demetgul, K. Yildiz, S. Taskin, I. N. Tansel, and O. Yazicioglu, “Fault diagnosis on material handling system using feature selection and data mining techniques,” Measurement, Vol. 55, pp. 15–24, Sep. 2014, https://doi.org/10.1016/j.measurement.2014.04.037
-
S. H. Syed and V. Muralidharan, “Feature extraction using discrete wavelet transform for fault classification of planetary gearbox – a comparative study,” Applied Acoustics, Vol. 188, p. 108572, Jan. 2022, https://doi.org/10.1016/j.apacoust.2021.108572
-
Q. Liu, J. Yang, and K. Zhang, “An improved empirical wavelet transform and sensitive components selecting method for bearing fault,” Measurement, Vol. 187, p. 110348, Jan. 2022, https://doi.org/10.1016/j.measurement.2021.110348
-
Y. Cheng, M. Lin, J. Wu, H. Zhu, and X. Shao, “Intelligent fault diagnosis of rotating machinery based on continuous wavelet transform-local binary convolutional neural network,” Knowledge-Based Systems, Vol. 216, p. 106796, Mar. 2021, https://doi.org/10.1016/j.knosys.2021.106796
-
X. Zhang, Z. Liu, Q. Miao, and L. Wang, “An optimized time varying filtering based empirical mode decomposition method with grey wolf optimizer for machinery fault diagnosis,” Journal of Sound and Vibration, Vol. 418, pp. 55–78, Mar. 2018, https://doi.org/10.1016/j.jsv.2017.12.028
-
Y. Sun, S. Li, and X. Wang, “Bearing fault diagnosis based on EMD and improved Chebyshev distance in SDP image,” Measurement, Vol. 176, p. 109100, May 2021, https://doi.org/10.1016/j.measurement.2021.109100
-
J. Wang, G. Du, Z. Zhu, C. Shen, and Q. He, “Fault diagnosis of rotating machines based on the EMD manifold,” Mechanical Systems and Signal Processing, Vol. 135, p. 106443, Jan. 2020, https://doi.org/10.1016/j.ymssp.2019.106443
-
Y. Amirat, V. Choqueuse, and M. Benbouzid, “EEMD-based wind turbine bearing failure detection using the generator stator current homopolar component,” Mechanical Systems and Signal Processing, Vol. 41, No. 1-2, pp. 667–678, Dec. 2013, https://doi.org/10.1016/j.ymssp.2013.06.012
-
Z. Gao, Y. Liu, Q. Wang, J. Wang, and Y. Luo, “Ensemble empirical mode decomposition energy moment entropy and enhanced long short-term memory for early fault prediction of bearing,” Measurement, Vol. 188, p. 110417, Jan. 2022, https://doi.org/10.1016/j.measurement.2021.110417
-
T. Han, Q. Liu, L. Zhang, and A. C. C. Tan, “Fault feature extraction of low speed roller bearing based on Teager energy operator and CEEMD,” Measurement, Vol. 138, pp. 400–408, May 2019, https://doi.org/10.1016/j.measurement.2019.02.053
-
K. Dragomiretskiy and D. Zosso, “Variational mode decomposition,” IEEE Transactions on Signal Processing, Vol. 62, No. 3, pp. 531–544, Feb. 2014, https://doi.org/10.1109/tsp.2013.2288675
-
Y. Zhang, G. Ren, D. Wu, and H. Wang, “Rolling bearing fault diagnosis utilizing variational mode decomposition based fractal dimension estimation method,” Measurement, Vol. 181, p. 109614, Aug. 2021, https://doi.org/10.1016/j.measurement.2021.109614
-
V. Sharma and A. Parey, “Extraction of weak fault transients using variational mode decomposition for fault diagnosis of gearbox under varying speed,” Engineering Failure Analysis, Vol. 107, p. 104204, Jan. 2020, https://doi.org/10.1016/j.engfailanal.2019.104204
-
Z. Xu, C. Li, and Y. Yang, “Fault diagnosis of rolling bearing of wind turbines based on the variational mode decomposition and deep convolutional neural networks,” Applied Soft Computing, Vol. 95, p. 106515, Oct. 2020, https://doi.org/10.1016/j.asoc.2020.106515
-
X. Chen, Y. Yang, Z. Cui, and J. Shen, “Vibration fault diagnosis of wind turbines based on variational mode decomposition and energy entropy,” Energy, Vol. 174, pp. 1100–1109, May 2019, https://doi.org/10.1016/j.energy.2019.03.057
-
X. Jiang, J. Wang, J. Shi, C. Shen, W. Huang, and Z. Zhu, “A coarse-to-fine decomposing strategy of VMD for extraction of weak repetitive transients in fault diagnosis of rotating machines,” Mechanical Systems and Signal Processing, Vol. 116, pp. 668–692, Feb. 2019, https://doi.org/10.1016/j.ymssp.2018.07.014
-
Q. Ni, J. C. Ji, K. Feng, and B. Halkon, “A fault information-guided variational mode decomposition (FIVMD) method for rolling element bearings diagnosis,” Mechanical Systems and Signal Processing, Vol. 164, p. 108216, Feb. 2022, https://doi.org/10.1016/j.ymssp.2021.108216
-
Y. Miao, M. Zhao, Y. Yi, and J. Lin, “Application of sparsity-oriented VMD for gearbox fault diagnosis based on built-in encoder information,” ISA Transactions, Vol. 99, pp. 496–504, Apr. 2020, https://doi.org/10.1016/j.isatra.2019.10.005
-
J. Li, X. Yao, H. Wang, and J. Zhang, “Periodic impulses extraction based on improved adaptive VMD and sparse code shrinkage denoising and its application in rotating machinery fault diagnosis,” Mechanical Systems and Signal Processing, Vol. 126, pp. 568–589, Jul. 2019, https://doi.org/10.1016/j.ymssp.2019.02.056
-
D. He, C. Liu, Z. Jin, R. Ma, Y. Chen, and S. Shan, “Fault diagnosis of flywheel bearing based on parameter optimization variational mode decomposition energy entropy and deep learning,” Energy, Vol. 239, p. 122108, Jan. 2022, https://doi.org/10.1016/j.energy.2021.122108
-
M. G. A. Nassef, T. M. Hussein, and O. Mokhiamar, “An adaptive variational mode decomposition based on sailfish optimization algorithm and Gini index for fault identification in rolling bearings,” Measurement, Vol. 173, p. 108514, Mar. 2021, https://doi.org/10.1016/j.measurement.2020.108514
-
M. Nazari and S. M. Sakhaei, “Successive variational mode decomposition,” Signal Processing, Vol. 174, p. 107610, Sep. 2020, https://doi.org/10.1016/j.sigpro.2020.107610
-
M. Nazari and S. M. Sakhaei, “Variational Mode Extraction: A New Efficient Method to Derive Respiratory Signals from ECG,” IEEE Journal of Biomedical and Health Informatics, Vol. 22, No. 4, pp. 1059–1067, Jul. 2018, https://doi.org/10.1109/jbhi.2017.2734074
-
Y. Miao, J. Wang, B. Zhang, and H. Li, “Practical framework of Gini index in the application of machinery fault feature extraction,” Mechanical Systems and Signal Processing, Vol. 165, p. 108333, Feb. 2022, https://doi.org/10.1016/j.ymssp.2021.108333
-
M. Zhao, J. Lin, Y. Miao, and X. Xu, “Feature Mining and Health Assessment for Gearboxes Using Run-Up/Coast-Down Signals,” Sensors, Vol. 16, No. 11, p. 1837, Nov. 2016, https://doi.org/10.3390/s16111837
-
D. Wang, “Some further thoughts about spectral kurtosis, spectral L2/L1 norm, spectral smoothness index and spectral Gini index for characterizing repetitive transients,” Mechanical Systems and Signal Processing, Vol. 108, pp. 360–368, Aug. 2018, https://doi.org/10.1016/j.ymssp.2018.02.034
-
H. Wang, J. Chen, and G. Dong, “Feature extraction of rolling bearing’s early weak fault based on EEMD and tunable Q-factor wavelet transform,” Mechanical Systems and Signal Processing, Vol. 48, No. 1-2, pp. 103–119, Oct. 2014, https://doi.org/10.1016/j.ymssp.2014.04.006
-
Y. Liao, P. Sun, B. Wang, and L. Qu, “Extraction of repetitive transients with frequency domain multipoint kurtosis for bearing fault diagnosis,” Measurement Science and Technology, Vol. 29, No. 5, p. 055012, May 2018, https://doi.org/10.1088/1361-6501/aaae99
About this article

The research is supported by the National Key R&D Program of China (approved grant: 2020YFB2007200), the National Natural Science Foundation (approved grant: U1804141) and the Key Science and Technology Research Project of the Henan Province (approved grant: 222102220111).
The datasets generated during and/or analyzed during the current study are available from the corresponding author on reasonable request.
The authors declare that they have no conflict of interest.
