Abstract
Traditional feature selection algorithms rarely consider the dynamic misalignment between different time series, and have poor fault tolerance and robustness. In this paper, a fault feature selection method for rolling bearings based on Dynamic Time Warped Related Searches (DTWRS) is proposed. Firstly, the bearing fault feature set is constructed, and the dynamic time warping algorithm is used to calculate the shortest cumulative distance between feature of different faults, and this distance is used as the correlation evaluation standard. Then, two new search rules, dynamic time warping difference and dynamic time warping entropy, are proposed based on the minimum redundancy between bearing fault features and the maximum correlation between fault features and feature categories, use these two search rules to judge the ability of the feature to express the fault, define the quality of the fault feature and sort from good to bad according to the level of ability. Finally, in this order, the number of features is gradually increased and input to the fault classifier, and the sensitive fault feature set is obtained based on the principle of the highest recognition rate and the least number of features. The experimental results show that the fault feature selection method of rolling bearing based on DTWRS can increase the accuracy of fault diagnosis while minimizing the number of features, and improve the efficiency and effect of fault diagnosis.
Highlights
- The bearing fault feature set is constructed, and the dynamic time warping algorithm is used to calculate the shortest cumulative distance between feature of different faults, and this distance is used as the correlation evaluation standard.
- Two new search rules, dynamic time warping difference and dynamic time warping entropy, are proposed based on the minimum redundancy between bearing fault features and the maximum correlation between fault features and feature categories, use these two search rules to judge the ability of the feature to express the fault, define the quality of the fault feature and sort from good to bad according to the level of ability.
- The experimental results show that the fault feature selection method of rolling bearing based on DTWRS can increase the accuracy of fault diagnosis while minimizing the number of features, and improve the efficiency and effect of fault diagnosis.
1. Introduction
Bearings are one of the most common and critical components in rotating machinery, often working in the harsh environment of alternating load, high temperature and heavy load, high temperatures and heavy loads. Bearings experience various forms of damage as operating hours increase, such as fatigue spalling, plastic deformation, cracks and fractures, and pitting corrosion, making bearings also one of the most vulnerable components in rotating machinery [1]. Bearing failure can result in equipment damage, financial loss, and personal injury [2-4]. Therefore, in order to ensure the stable operation of the machine and detect bearing faults early, it is particularly critical to effectively select the best features.
The feature selection is to find the best feature subset in the fault signal feature, which provides guarantee for the stability and reliability of the subsequent processing algorithm [5]. Sensitive feature selection is mainly used in data preparation and data preprocessing, which brings many benefits to many machine learning algorithms. For example, it can improve the running speed and learning accuracy of related algorithms [6], and can reduce their storage space and algorithm training. The cost of testing. The above advantages of feature preference have enabled the rapid development and application of related algorithms [7-10]. Xie Lirong [11] combined genetic algorithm (GA) and Elman neural network to select features and parameters for doubly-fed wind turbine bearings, and then perform the fault identification. The results of application case analysis verified the effectiveness and accuracy of the method. Xue Rui [12] proposed a fault feature selection method combining the Relief-F algorithm and the quantum particle swarm optimization algorithm. The typical fault simulation signal of the rotor system was used as the test signal. A small and low-dimensional fault data set with high fault mode identification can improve the identification accuracy of the fault classifier. Zhang Li [5] and others improved the correlation fast filtering feature selection algorithm (FCBF) based on the maximum correlation coefficient. Through comparative experimental analysis, the improved algorithm feature selection algorithm was found to be more effective. The traditional feature selection algorithm [13-14] only uses the mutual information algorithm to calculate the correlation between variables, and does not consider the dynamic changes of the detection signals of different sensors and the operating state of the equipment, especially the misalignment of the multi-sensor monitoring signals. The sensors are arranged in different positions on the equipment, and the distance from the fault source is also far and near. There is also a certain deviation between the equipment states that can be represented by the signals collected by the sensors at the measuring points. Under the influence of noise and interference, the deviation will be amplified or distorted, and then it affects the correlation judgment of features between different sensors, resulting in a decrease in the accuracy of fault diagnosis. In order to solve the above problems, this paper proposes a fault feature selection method for rolling bearings based on DTWRS. Using the shortest cumulative distance obtained by the dynamic time warping algorithm as the correlation evaluation standard, a new time entropy and time difference are constructed. Search rules to obtain best features and improve the accuracy of bearing fault diagnosis.
2. Dynamic time warping algorithm
Dynamic Time Warping (DTW) [15] is a nonlinear warping technique that combines time warping and distance measure calculation based on the idea of dynamic programming. The algorithm finds the similarity of different sequences by finding the matching path between data in two arbitrarily long correlated time series. The algorithm can effectively deal with the time misalignment between sequences, and has strong fault tolerance and robustness.
Assuming that the corresponding lengths of the two time series and are and respectively, then:
Let the distance between time sequence and be , as shown in Eq. (2):
According to the characteristics of and , a matrix grid is constructed, then the smaller the value of , the higher the similarity of time series and . Assuming that the regular route is , as shown in Fig. 1, DTW is to find a perfect route to construct the mapping of time series and , let , where , be its th unit. needs to satisfy , and the following boundary conditions, continuity and monotonicity conditions. Constraining the continuity and monotonicity of , then the route of any point in actually has only three directions to choose from. Assuming that the route passes through point , the next point is very likely to be one of the three coordinates of , , and . In order to obtain the points that satisfy the above constraints, the regular and perfect route can be calculated through :
Scaling the time series and can get the shortest distance between the time series and . We need to find a route to make the total distance between the time series and the shortest. In this regard, we set an accumulated distance, and the total distance is obtained by accumulating the distances of all points in the grid, as shown in Eq. (4):
Finally, the DTW algorithm is used to obtain the cumulative distance of the route. If the distance is the minimum value, the route is a perfect route, and the corresponding global cumulative distance is the similarity distance between sequences.
3. Dynamic time warping related search rules
The maximal relevance and minimal redundancy (MRMR) algorithm are a common feature selection algorithm based on mutual information theory. Assuming two random variables and , their probability density and joint probability density are , , and respectively, then the equation of mutual information between the two variables is defined as:
If represents the feature set, represents the number of features, represents the -th feature, and represents the category to which the feature belongs, then the mutual information between features and categories is , and the mutual information between features and features is , then MRMR The algorithm is to maximize the correlation between the feature and the category , while minimizing the correlation between the feature and the feature , that is, the search rule for the best feature is:
The two-way search optimization problem of the above formula can be transformed into a maximization problem through mutual information difference or mutual information quotient , and the search rules become MID rules and MIQ rules.
MID rules:
MIQ rules:
Mutual information is used to represent the correlation between numerical sequences, and it has achieved good results in the featured selection of text and images. However, for mechanical vibration state monitoring and real-time diagnosis, since the sensor detection signal is dynamic, the operating state of the equipment is constantly changing, and the positions of different sensors are different, and the route from the fault source to the measuring point is also different, which will cause deviation between the monitoring signal and the equipment fault status, noise and interference distort and amplify this offset. The correlation analysis of multi-sensor signals of mechanical state based on mutual information has poor fault tolerance and robustness, and is easily affected by noise.
Here, the DTW algorithm is used to obtain the minimum cumulative distance between different dynamic sequences, and this distance is used to represent the correlation between different sequences, and the dynamic time warping related search rules DTWRS is proposed. Assuming that the bearing state feature subset is , represents the number of features, represents the -th feature of the bearing, and represents the state category contained in the bearing feature, then the bearing fault feature and state category, fault feature and feature are between the dynamic time-warping cumulative distances of respectively defined and become:
Since the smaller the cumulative distance of the two series of dynamic time warping, the greater the correlation, so the maximum relevance between the bearing fault feature and the fault category can be represented by the minimum cumulative distance of dynamic time warping between the two. Similarly, the minimum redundancy between the fault feature and the feature can be expressed by the maximum dynamic time warping cumulative distance between the two, namely:
By analogy with mutual information difference and mutual information quotient, the Dynamic Time Warping Search (DTWS) operator is defined as dynamic time warping difference (Dynamic Time Warping Difference, DTWD) and Dynamic Time Warping Quotient (DTWQ), as follows:
Then the best feature search rule for bearing faults is as follows.
DTWD rules:
DTWQ rules:
4. Bearing fault feature selection algorithm based on DTWRS
Based on the DTWD and DTWQ rules, the basic steps of the bearing fault feature selection algorithm based on DTWRS can be summarized:
(1) Collect the multi-sensor signals of bearing operating states of different fault types under multiple working conditions, and after preprocessing and normalization, extract the physical quantity features such as time domain, frequency domain, and entropy value, and construct a bearing fault feature set , where represents the number of features. The fault category corresponding to each data sample is represented by the data labels 1, 2, 3..., and the fault category label vector is constructed.
(2) Calculate the dynamic warping cumulative distance between the fault feature vector in the feature set and the fault category vector , and then calculate the dynamic warping cumulative distance between and other fault vectors .
(3) According to the DTWD of Eq. (12) and the DTWQ feature selection search rule of Eq. (13), obtain the best eigenvector of the feature set according to the principle of maximal relevance and minimal redundancy, and set it as .
(4) The feature set is the best feature subset and feature complement , where , .
(5) Based on the feature subset and the category label vector , perform feature selection according to the DTWD and DTWQ search rules, repeat steps 2 and 3, obtain the second best feature vector , and update the best feature subset and Complement .
(6) Repeat step (5), perform DTWD and DTWQ searches on the features in the feature complement set , until all the features in the feature set are traversed, output the pros and cons of all features, and construct the features arranged in the best order set .
(7) According to the rules of feature ranking, the first feature is input into the appropriate classifier to obtain the bearing fault diagnosis accuracy, and the number of features is increased in turn, then the number of feature sets with the highest accuracy is the best feature subset , where . In this paper, SVM is used as the bearing fault diagnosis classifier.
5. Experiments and analysis
5.1. Rolling bearing fault simulation experiment platform
The rolling bearing fault simulation test bench is shown in Fig. 1. The motor 9 drives the main shaft 2 and the wheel disc 3 on the main shaft to rotate through the coupling 1, and is placed at the driving end. The motor speed can be adjusted by the frequency converter 10. In the experiment, the vibration sensors were arranged on the bearing seat and the casing respectively. The temperature sensors 7 and 8 are respectively fixed on the bottom of the casing and the outer ring of the bearing to measure the temperature of Fe magnetic particles and the bearing, and used to collect temperature data. The performance of Fe magnetic particles is mainly monitored online by the electromagnetic magnetic particle abrasive particle sensor. The experimental bearing is a 6010Z deep groove ball bearing with an inner diameter of 50 mm, an outer diameter of 80 mm, and the number of rolling elements is 13. The faulty bearing is produced by the prefabrication method, and the inner ring rupture bearing, the outer ring rupture bearing and the cage rupture bearing are mainly produced, as shown in Fig. 2.
Fig. 1Rolling bearing fault simulation test bench: 1 – coupling; 2 – drive end bearing; 3 – roulette; 4 –spindle; 5 – free end bearing; 6 – vibration sensor; 7 – Fe magnetic particle sensor; 8 – temperature sensor; 9 – motor; 10 – inverter; 11 – base; 12 – vibration sensor; 13 – fuel injector
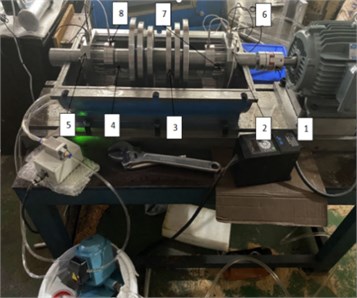
a) Test bench after removing the casing
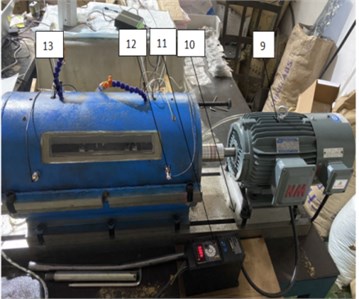
b) Test bench with the casing
Fig. 2Ruptured bearings in different locations
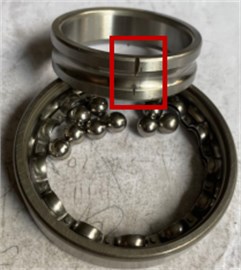
a) Inner ring ruptured bearing
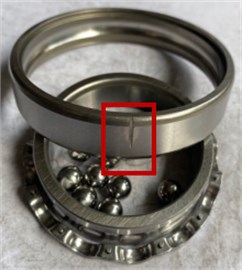
b) Outer ring ruptured bearing
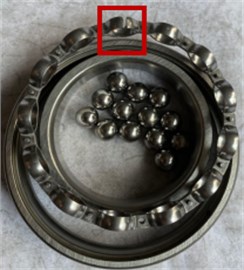
c) Cage ruptured bearing
In the experiment, three types of physical signals, such as the vibration, temperature, Fe magnetic particle number, were collected for four fault bearings at two speeds. Four types of faults include normal, inner ring fault, outer ring fault, cage fault. Two speeds are 2200 r/min and 2580 r/min. The vibration sampling frequency is 5120 Hz, and the temperature sampling frequency is 1 Hz. The Fe magnetic particle data mainly collects the number of Fe magnetic particles larger than 70 μm, and the sampling frequency is 12 Hz. For each physical quantity, the vibration, temperature and Fe magnetic particle number collected in the same time period within 1 minute were taken as the analysis data.
5.2. Feature extraction of multi-physical quantity signals of rolling bearings
The multi-physical quantity signal of rolling bearing include vibration, temperature and Fe magnetic particle number. Vibration is a fast-changing signal and is very sensitive to faults. Temperature and Fe magnetic particle number are relatively slow-changing signals, which can improve the accuracy of fault type diagnosis. The vibration characteristics of the bearing have the average value, root mean square, root square amplitude, skewness, rectified average value, kurtosis, variance, standard deviation, peak-to-peak value, waveform index, peak index, and pulse index are extracted, margin index and kurtosis index and other 14 time domain characteristics, Fig. 3 is the distribution curve of 14 characteristic quantities of normal bearing, inner ring, outer ring and cage fault bearing when the speed is 2220 rpm.
Fig. 3Time domain characteristics of bearings in four states
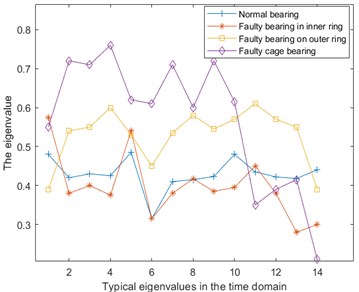
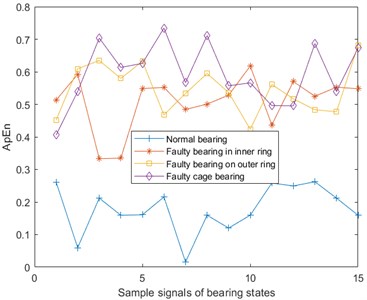
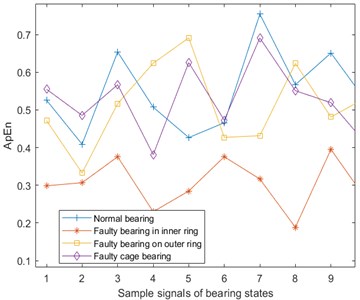
Fig. 4Approximate entropy of vibration, temperature and Fe magnetic particle signals
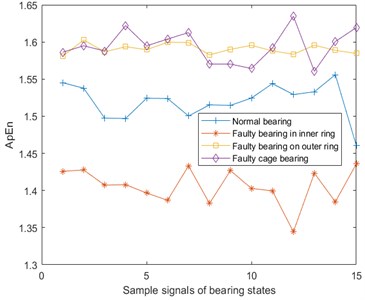
a) Approximate entropy of vibration signal
b) Approximate entropy of temperature signal
c) Approximate entropy of Fe magnetic particle signal
Entropy is often used to characterize the chaotic degree of a system, and predict the next state of the system through the current system state [16-17]. The entropy value can be used to describe both the fast-changing signal and the slow-changing signal. Therefore, the vibration, temperature, and the number of Fe magnetic particles all take the entropy value as the bearing fault feature. In fault diagnosis, the commonly used entropy are approximate entropy, sample entropy, fuzzy entropy and permutation entropy.
Approximate entropy (ApEn) [18-20] is a nonlinear dynamic parameter used to quantify the regularity and unpredictability of time series fluctuations. The more complex the time series, the larger the approximate entropy. From the vibration, temperature, and Fe magnetic particle signals of the four bearing states, 15 pieces of data are taken for each signal and the approximate entropy is calculated. The results are shown in Fig. 4. Here, the phase space dimension and similarity tolerance .
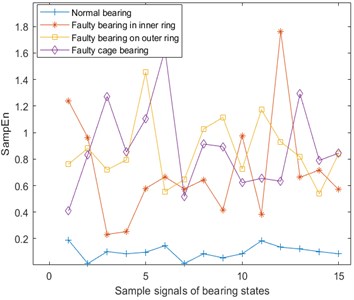
The sample entropy (SampEn) [21] is an improvement of the approximate entropy, but because the sample entropy is the exact value of the negative average natural logarithm of the conditional probability, it does not contain the comparison of its own data segments. So the entropy value calculation does not depend on the length of the time series, and it has better consistency, which is usually used to represent complexity of time series. Sample entropy of the vibration, temperature, and Fe magnetic particle signal are shown in Fig. 5. Here, and .
Fig. 5Sample entropy of vibration, temperature and Fe magnetic particle signals
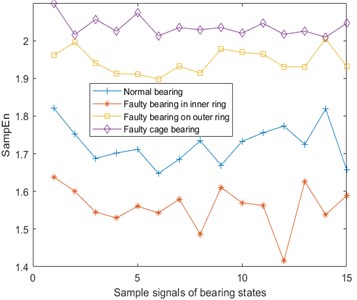
a) Sample entropy of vibration signal
b) Sample entropy of temperature signal
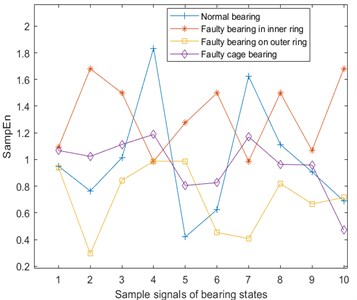
c) Sample entropy of Fe magnetic particle signal
Fuzzy Entropy (FuzzyEn) [22] is based on the sample entropy, by introducing a fuzzy membership function to replace the similarity determination value, and then more accurately describe the information contained in the time series samples. Fuzzy entropy of the vibration, temperature, and Fe magnetic particle signal are shown in Fig. 6. Here, and .
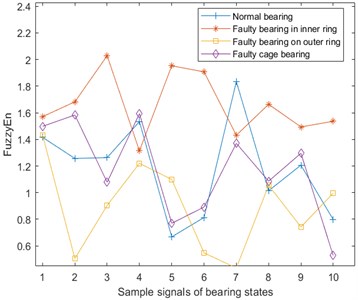
Permutation entropy (PE) [23] is a dynamic mutation detection method, which can conveniently and accurately locate the moment when a system mutation occurs, and can amplify the small changes of the signal. The size of the permutation entropy indicates the randomness of the time series: the smaller the entropy value, the simpler the time series; on the contrary, the larger the entropy value, the more complex the time series. Permutation entropy of the vibration, temperature, and Fe magnetic particle signal are shown in Fig. 7. Here, and .
Fig. 6Fuzzy entropy of vibration, temperature and Fe magnetic particle signals
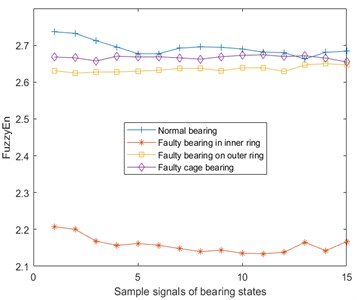
a) Fuzzy entropy of vibration signal
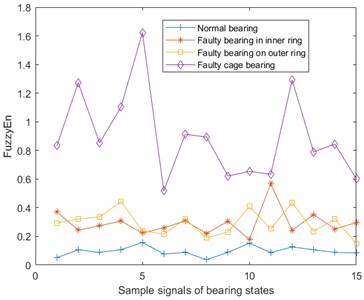
b) Fuzzy entropy of temperature signal
c) Fuzzy entropy of Fe magnetic particle signal
Table 1Rolling bearing fault feature set
S/N | Feature name | S/N | Feature name | S/N | Feature name |
1 | Vibration mean | 10 | Vibration waveform index | 19 | Temperature approximate entropy |
2 | Vibration rms | 11 | Vibration peak indicator | 20 | Temperature sample entropy |
3 | vibration root amplitude | 12 | Vibration pulse indicator | 21 | Temperature fuzzy entropy |
4 | Vibration rectification average | 13 | Vibration margin index | 22 | Temperature permutation entropy |
5 | Vibration skewness | 14 | Vibrational kurtosis index | 23 | Fe magnetic particle approximate entropy |
6 | Vibrational kurtosis | 15 | Vibrational approximate entropy | 24 | Fe magnetic particle sample entropy |
7 | Vibration variance | 16 | Vibration sample entropy | 25 | Fe magnetic particle fuzzy entropy |
8 | Vibration peak-to-peak | 17 | Vibrational fuzzy entropy | 26 | Fe magnetic particle permutation entropy |
9 | Vibration standard deviation | 18 | Vibrational permutation entropy |
The collected bearing state signal is preprocessed for feature extraction. Here, 14 time domain features and 4 entropy features of the bearing vibration signal, 4 entropy features of temperature and Fe magnetic particles are extracted, and a fault feature set is constructed. And the feature numbering is shown in Table 1.
Fig. 7Permutation entropy of vibration, temperature and Fe magnetic particle signals
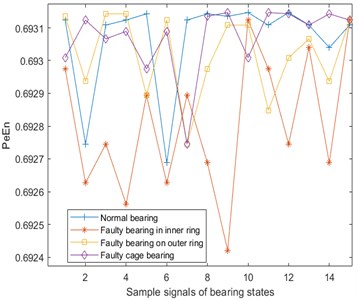
a) Permutation entropy of vibration signal
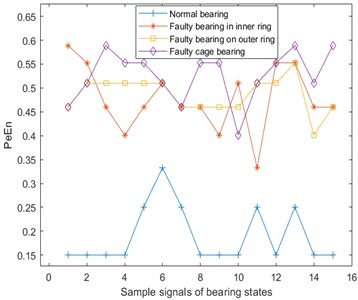
b) Permutation entropy of temperature signal
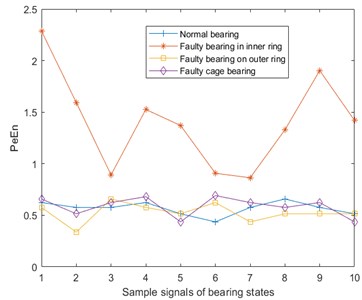
c) Permutation entropy of Fe magnetic particle signal
5.3. Optimizing the fault characteristics of rolling bearings
From the bearing fault experiment, 40 sets of monitoring data for normal, inner ring fault, outer ring fault, and cage fault bearing monitoring data (20 operating periods of the bearing under each speed condition) are taken, a total of 160 sets of data. Due to the different sampling frequencies of each physical quantity, the amount of data in 1 minute is also different, with 307,200 data for vibration, 60 data for temperature, and 720 data for Fe magnetic particles. Due to inconsistency of sampling frequency, different arrangement positions of measuring points and different detection methods, there is a problem of dynamic misalignment between different physical parameters collected.
Table 2Ranking results of bearing fault features under different search rules
Search rules | Feature quantity ranking |
No sorted | 1 2 3 4 5 6 7 8 9 10 11 12 13 14 15 16 17 18 19 20 21 22 23 24 25 26 |
MIQ | 22 26 18 24 19 4 21 17 3 20 13 7 12 2 23 10 25 1 11 16 8 6 5 9 15 14 |
MID | 22 26 24 18 17 3 7 19 12 20 4 13 21 2 10 25 23 11 16 1 6 8 5 9 15 14 |
DTWQ | 18 24 22 15 26 19 4 10 16 9 2 8 7 25 17 3 6 14 11 20 23 5 12 13 21 1 |
DTWD | 18 24 15 19 26 4 22 10 9 2 8 16 7 3 25 5 17 23 11 6 1 12 13 21 20 14 |
Here, features are first extracted from 40 groups of normal bearing monitoring signals, 18 features are extracted from each group of vibration signals, and 4 features are extracted from each of the temperature and Fe magnetic particle number signals to construct a 40×26 normal bearing state feature matrix; Feature extraction is carried out on the monitoring data of the inner ring, outer ring and cage fault bearing, and then three 40×26 feature matrices are constructed. That is, there are 160 sets of data at the end, each set of data has 26 dimensions, that is, 26 feature quantities.
The 160 sets of features are optimized by four search rules (MID, MIQ, DTWD, DTWQ) of the MRMR and DTWRS algorithms, and the best feature ranking obtained is shown in Table 2.
5.4. Analysis of fault diagnosis effect of selected features
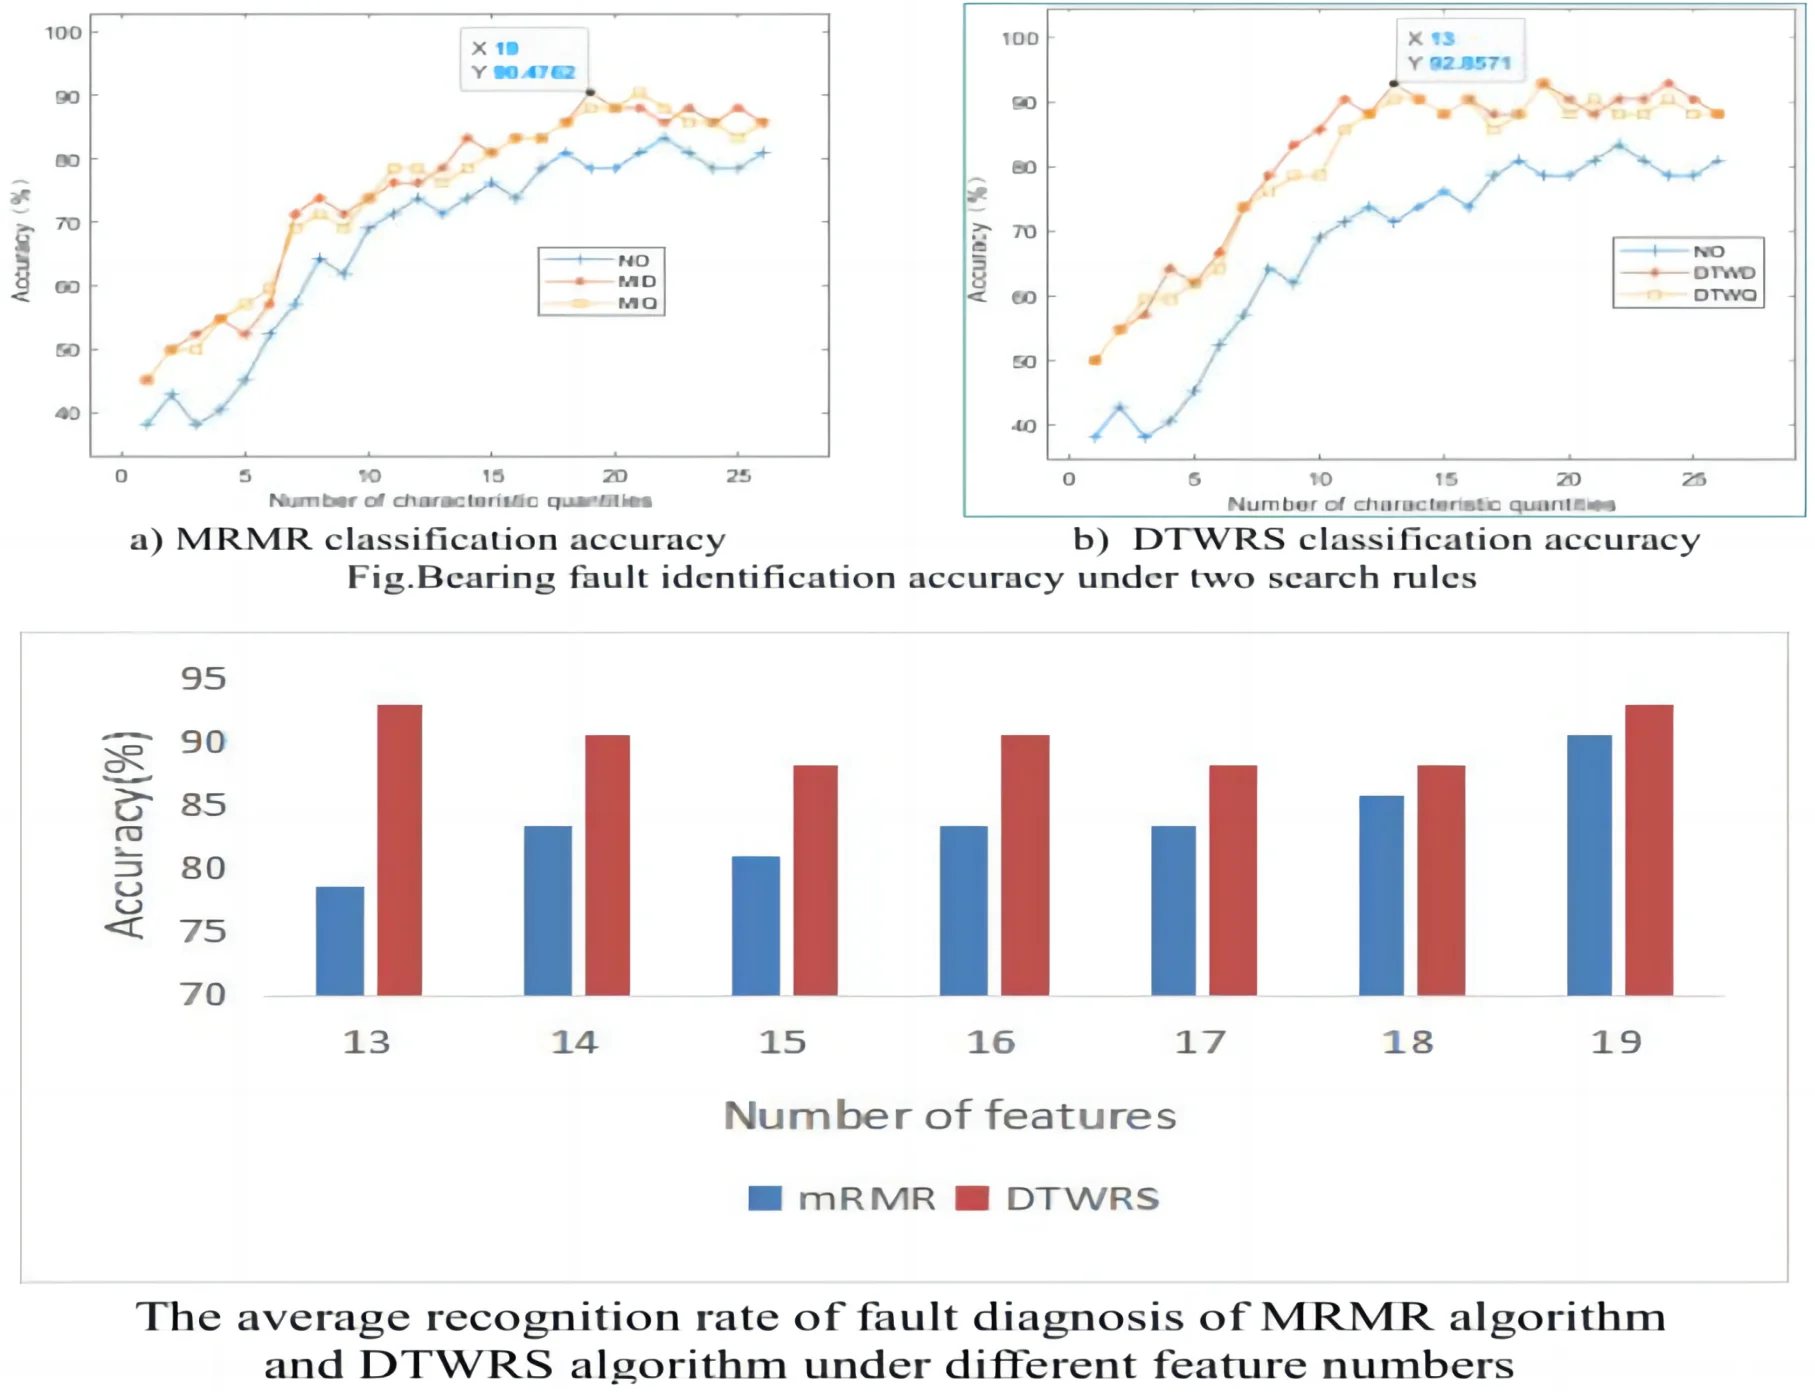
The 40 sets of fault state data for each bearing are divided into 28 sets of training data and 12 sets of test data, which are input into the SVM classifier, and the training data is used to train the best SVM model, and then the test data is used to judge the best SVM. Under the model, according to the feature sorting under the search rules in Table 2, the total number of features is increased in turn, and the diagnostic accuracy of the test data composed of the first 1, 2, 3 ... features is obtained, and the diagnostic results of the test data are obtained. As shown in Fig. 8.
Fig. 8Bearing fault identification accuracy under two search rules
a) MRMR classification accuracy
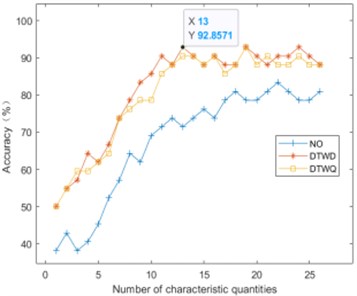
b) DTWRS classification accuracy
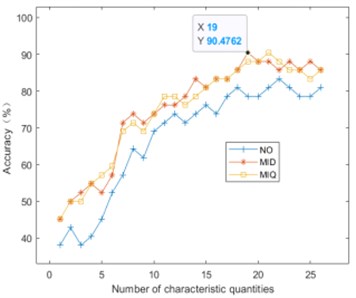
It can be seen from Fig. 9 that as the number of fault features increases one by one, the bearing fault diagnosis rate gradually increases. When the highest recognition rate is reached, and the fault features are added, the accuracy rate starts to fluctuate, and even has a downward trend, indicating that there are redundant features in the full feature set, and these redundant features will interfere with the classifier and reduce the recognition accuracy. Table 3 shows the best number of features and the corresponding diagnostic accuracy under the four search rules. It can be seen that the two search rules of DTWRS proposed in this paper can achieve higher fault diagnosis accuracy when the number of features is small.
Fig. 9The average recognition rate of fault diagnosis of MRMR algorithm and DTWRS algorithm under different feature numbers
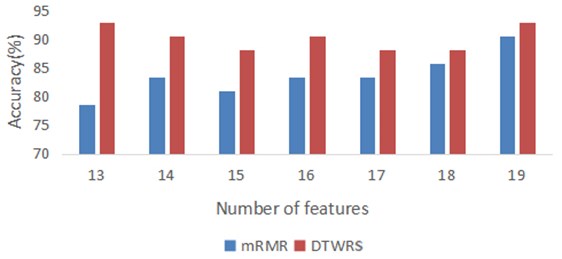
Table 3The number of features and the corresponding fault diagnosis accuracy under the four search rules
Search rule | Best number of features | Corresponding diagnostic accuracy |
MIQ | 21 | 90.48 % |
MID | 19 | 90.48 % |
DTWQ | 19 | 92.86 % |
DTWD | 13 | 92.86 % |
Since in the four rules of the two search algorithms, the best number of features is concentrated between 13 and 19 features, Fig. 9 lists the average accuracy of MRMR and DTWRS algorithm when the number of features increases from 13 to 19. It can be seen from Table 3 and Fig.9 that the fault diagnosis accuracy of the DTWRS algorithm is greater than that of the MRMR algorithm, and the DTWRS algorithm only uses the first 13 preferred features to exceed the effect of the first 19 features of the MRMR algorithm. Compared with the original 26 features, the amount of features is reduced by half. This fully shows that the best fault features obtained by the DTWRS algorithm can better represent the fault, and the redundant features are the least. Therefore, the DTWRS algorithm proposed in this paper can characterize the fault type with the fewest features, which not only improves the accuracy of fault diagnosis, but also greatly reduces the number of features and improves the efficiency of the fault diagnosis algorithm.
6. Conclusions
Aiming at the problem of dynamic misalignment between multi-sensor time series in the optimization of multi-physical quantity features of bearing faults, a feature selection method based on dynamic time warping related searches is proposed. The distance is used as the correlation evaluation to define two new search rules, DTWD and DTWQ, which are the best features. The fault state representation ability of all the features in the feature set is sorted, and the fault classifier SVM has the highest recognition rate and the highest recognition rate. The minimum number of features is the principle to obtain the best fault feature set.
1) Based on the correlation evaluation of dynamic time warping and the idea of maximum correlation and minimum redundancy, a new bearing fault feature selection algorithm is proposed based on DTWRS, which can effectively deal with the dynamic misalignment problem of multi-physical quantity signals in time, and better balance Maximum correlation between features and fault types and minimum redundancy between features.
2) The DTWRS feature selection algorithm can use the least features to express the fault types. For the fault feature set composed of 26 features, the MRMR algorithm needs at least 19 features to effectively characterize the fault and get more than 90 % of the diagnostic accuracy. However, the DTWRS algorithm only needs 13 features to obtain and exceed the highest fault diagnosis accuracy of the MRMR algorithm. The feature quantity is reduced by half, which means that the computational efficiency of the algorithm is increased, and the hardware requirements for data processing are reduced.
3) The reasonable selection of feature number is related to the quality of fault diagnosis. If there are too few features, the fault features cannot be fully characterized. Too many features will reduce the accuracy of fault diagnosis. The correlation search based on dynamic time regularization proposed in this paper The method for optimizing the fault characteristics of rolling bearings can reduce the number of fault characteristics and improve the diagnosis accuracy.
References
-
R. B. Randall and J. Antoni, “Rolling element bearing diagnostics-A tutorial,” Mechanical Systems and Signal Processing, Vol. 25, No. 2, pp. 485–520, Feb. 2011, https://doi.org/10.1016/j.ymssp.2010.07.017
-
Wu Qianhui and Huang Biqing, “Remaining life prediction method based on support vector data description,” Computer Integrated Manufacturing Systems, Vol. 24, No. 11, pp. 2725–2733, 2018.
-
Shenkun Zhao, Chao Jiang, and Xiangyun Long, “A data-driven and Bayesian theory-based residual life prediction method for mechanical systems,” Chinese Journal of Mechanical Engineering, Vol. 54, No. 12, pp. 115–124, 2018.
-
J. Zhu, N. Chen, and C. Shen, “A new data-driven transferable remaining useful life prediction approach for bearing under different working conditions,” Mechanical Systems and Signal Processing, Vol. 139, p. 106602, May 2020, https://doi.org/10.1016/j.ymssp.2019.106602
-
Zhang Li, Yuan Yu-Yu, and Wang Cong, “FCBF feature selection algorithm based on maximum information coefficient,” Journal of Beijing University of Posts and Telecommunications, Vol. 41, No. 4, p. 86, Oct. 2018, https://doi.org/10.13190/j.jbupt.2017-229
-
M. Bennasar, Y. Hicks, and R. Setchi, “Feature selection using Joint Mutual Information Maximisation,” Expert Systems with Applications, Vol. 42, No. 22, pp. 8520–8532, Dec. 2015, https://doi.org/10.1016/j.eswa.2015.07.007
-
Y. Zhang, C. Yang, A. Yang, C. Xiong, X. Zhou, and Z. Zhang, “Feature selection for classification with class-separability strategy and data envelopment analysis,” Neurocomputing, Vol. 166, pp. 172–184, Oct. 2015, https://doi.org/10.1016/j.neucom.2015.03.081
-
J. Martínez Sotoca and F. Pla, “Supervised feature selection by clustering using conditional mutual information-based distances,” Pattern Recognition, Vol. 43, No. 6, pp. 2068–2081, Jun. 2010, https://doi.org/10.1016/j.patcog.2009.12.013
-
D. N. Reshef et al., “Detecting novel associations in large data sets,” Science, Vol. 334, No. 6062, pp. 1518–1524, Dec. 2011, https://doi.org/10.1126/science.1205438
-
J. Novakovic, P. Strbac, and Dušan Bulatović, “Toward optimal feature selection using ranking methods and classification algorithms,” Yugoslav Journal of Operations Research, Vol. 21, No. 1, pp. 119–135, 2011.
-
Xie Lirong et al., “Bearing fault diagnosis of DFIG based on GA-ENN feature selection and parameter optimization,” Chinese Journal of Solar Energy, Vol. 42, No. 1, pp. 149–156, 2021.
-
Rui Xue and Rongzhen Zhao, “Fault feature selection algorithm combining ReliefF and QPSO,” Vibration and Shock, Vol. 39, No. 11, pp. 171–176, 2020.
-
Gu Yingkui, Kong Junting, and Zhu Fantaki, “Gearbox fault feature selection method based on the importance of neighborhood attributes,” Chinese Journal of Coal, Vol. 40, pp. 560–567, 2015.
-
Haomin Dai et al., “Feature selection method in mixed domain of rolling bearing based on WMRMR,” Vibration and Shock, Vol. 34, No. 19, pp. 57–61, 2015.
-
E. Keogh and C. A. Ratanamahatana, “Exact indexing of dynamic time warping,” Knowledge and Information Systems, Vol. 7, No. 3, pp. 358–386, Mar. 2005, https://doi.org/10.1007/s10115-004-0154-9
-
Xiang Dan and Cen Jian, “Rolling bearing fault diagnosis method based on EMD entropy feature fusion,” Journal of Aerodynamics, Vol. 30, No. 5, pp. 1149–1155, 2015.
-
Long Zhang, Wenyi Huang, and Guoliang Xiong, “Evaluation of rolling bearing fault degree based on multi-scale entropy,” Vibration and Shock, Vol. 33, No. 9, pp. 185–189, 2014.
-
Zengshou Dong, Xue-Min Tian, and J. Zeng, “Mechanical fault diagnosis based on LMD-approximate entropy and LSSVM,” Chinese Journal of Instrumentation, Vol. 3, No. 34, pp. 714–720, 2013.
-
Ling Xiang et al., “Fault diagnosis of rolling bearings based on IITD and FCM clustering,” Journal of Aerodynamics, Vol. 33, No. 10, pp. 2553–2560, 2018.
-
Xuejun Li et al., “Cylindrical roller bearing diagnosis based on wavelet packet approximate entropy and SVM,” Vibration. Test and Diagnosis, Vol. 35, No. 6, pp. 1031–1036, 1197.
-
Chunjing Wang et al., “Fault diagnosis of rolling bearings based on VMD sample entropy and CS-ELM,” Chemical Automation and Instrumentation, Vol. 48, No. 5, pp. 469–475, 2021.
-
Xu Fan and Xie Weida, “Rolling bearing fault diagnosis based on fine composite multi-scale fuzzy entropy and particle swarm optimization support vector machine,” Journal of Central South University, Vol. 26, No. 9, pp. 2404–2417, 2019.
-
Zhang Miao et al., “Bearing fault diagnosis based on multi-scale mean permutation entropy and parameter optimization support vector machine,” Vibration and Shock, Vol. 41, No. 1, pp. 221–228, 2022.
About this article

Financial support from the National Key R&D Program of China (Grant Nos. 2020YFB2007800), Special Research Project on the Key Fields in General Universities of Guangdong Province (Grant Nos. 2020ZDZX2033) are appreciated.
The datasets generated during and/or analyzed during the current study are available from the corresponding author on reasonable request.
The authors declare that they have no conflict of interest.
