Abstract
This study evaluates the fatigue properties of corroded weathering steels to assess their long-term structural safety, durability, and economic feasibility. The fatigue life of two groups of weathering steel is measured by experiment. The first group consists of non-corroded specimens, while the second group is subjected to atmospheric corrosion for a duration of one year. The fatigue life of weathering steel is predicted by numerical calculation. It is found that the fatigue life of numerical simulation can accurately predict the fatigue life of butt weld specimens and provide a certain safety margin. The difference between the two is 2.5 %, which is a strong validation of the method. Then, Utilizing the ABAQUS and FRANC3D interactive platforms, the study achieves numerical computations for initial crack insertion and crack propagation under fatigue loading, and the influence of stress amplitude, initial crack size, initial crack shape, initial crack position, and welding dislocation on fatigue life is analyzed. Nine different stress amplitudes are simulated, and the fatigue life difference between the stress amplitudes of 117 MPa and 189 MPa being 31.72 %. Six different initial crack sizes are simulated. The initial crack sizes are 0.075 and 0.5 mm, and the difference in fatigue life between the two is 48.58 %. Four different initial crack shapes are simulated, and the fatigue life difference between the short axis and the long axis ratio of 1/4 and 1/1 of the initial crack is 30.70 %. Three initial crack positions are simulated, and the difference in fatigue life at different positions is less than 10 %. The effects of four different sets of angular dislocations on fatigue life are simulated. Angular misalignment in butt weld specimens has a minimal effect on fatigue performance, approximately 1 %, provided that the flatness requirements of the specifications are met. However, when the flatness requirements exceeded the specification, the effect on the specimen was greater than 30 %, and its effect cannot be ignored. Based on fatigue detail tests of corroded weathering steel, this paper proposes and validates a method for evaluating the fatigue life of weathering steel after corrosion, and clarifies the factors influencing the fatigue life of weathering steel structures, the proposed method can provide support for the design of fatigue details of weathering steel bridges.
Highlights
- Fatigue life of weathering steel was tested in uncorroded and one-year atmospherically corroded conditions.
- Numerical simulation accurately predicted welded joint fatigue life with 2.5% error and safety margin.
- Using ABAQUS and FRANC3D, crack propagation was simulated to analyze the effects of stress amplitude, initial crack size/shape/location, and weld misalignment on fatigue life.
1. Introduction
Weathering steel is an alloy material formed by incorporating trace corrosion-resistant elements into conventional carbon steel. During the service process, a dense layer of corrosion products will be produced on the surface to prevent further corrosion of steel. Compared with ordinary carbon steel, its corrosion resistance can be improved by 2 to 8 times, and it can be further improved after coating. In addition, in the whole life cycle of the bridge, the weathering steel bridge has better economic benefits than the ordinary carbon steel bridge. However, in the process of applying weathering steel to bridge construction, the understanding of fatigue performance before and after corrosion and the prediction of fatigue life are still insufficient. Therefore, this paper studies the fatigue life and prediction of weathering steel before and after corrosion by comparing the numerical simulation with the test before and after corrosion of weathering steel [1-3]. At present, scholars have carried out various studies on the fatigue fracture behavior of weathering steel. Current research on the fatigue fracture behavior of weathering steel has predominantly focused on 3D crack propagation. Scholars have investigated the influence of the crack tip stress field on crack propagation. Among them, Han et al. [4] studied the initiation and propagation of a single internal 3D crack in brittle materials under dynamic load. The theoretical analysis of the circumferential stress field at the pre-crack tip reveals the formation mechanism of crack-dominated initiation and favorable direction. Wang et al. [5] numerically modeled through-thickness crack growth in welded joints, demonstrating that multi-crack configurations amplify stress intensity factors (SIFs) at crack tips. Studies have shown that compared with the single-crack model, the multi-crack model significantly improves the SIF at the crack tip. The multi-crack model focuses on the relationship between the coupling zone, crack spacing, and crack size. Some scholars have also conducted in-depth research on the propagation characteristics of multiple cracks in steel bridge joints. Based on the theory of fracture mechanics, ABAQUS and FRANC3D node simulation technology are used to simulate the propagation behavior of coplanar and non-planar cracks in joints, analyze their morphological characteristics, study the interaction mechanism between different crack spacings, and quantitatively characterize the relative position of crack enhancement or inhibition. The results show that the fusion of coplanar cracks significantly reduces the fatigue life, while the mutual inhibition between heterogeneous cracks improves the fatigue life [6]. Zhang et al. [7, 8] validated non-proportional mixed-mode crack trajectory predictions against phase-shifted tensile-torsion experiments. The results of the numerical simulation are verified by the experimental data of the tensile torsion test with phase shift and without phase shift. Some scholars have combined deep learning to study the machine learning alternative model based on fracture mechanics. Machine learning (ML) approaches, integrated with fracture mechanics, have leveraged ABAQUS-FRANC3D datasets to develop surrogate models. Through dimensionality reduction techniques like PCA, MLP neural networks now enable efficient and accurate fatigue life predictions for steel bridges [9], the combination of FRANC3D and ABAQUS is used to calculate the fracture mechanics, and the three-dimensional crack propagation of engineering structures under complex geometric shapes and arbitrary load conditions is carried out [10]. Yang et al. [11-13] studied the fatigue crack propagation behavior under different loads. Many scholars focused on the path and rate of crack propagation. Among them, Yao et al. [14] studied the support vector regression-assisted finite element method for predicting the fatigue crack propagation path. He et al. [5] systematically studied the experimental and numerical studies on the growth of penetrating cracks. Wang et al. [15] studied the application of fracture mechanics and crack propagation. Zhang et al. [16] elucidated penetrating crack dynamics, fracture mechanics applications, and variable-amplitude load effects on high-strength steels, respectively. Tang et al. [17] have carried out in-depth research on the mechanism of corrosion fatigue crack propagation in various environments. Guo et al. [18] have studied the effect of low temperature on steel and its effect on weld fatigue crack propagation rate. Some scholars have studied the coupling propagation behavior of multiple fatigue cracks [19], and the fatigue performance of welded joints considering initial defects [20].
However, there are few studies on the comparison of fatigue life tests and numerical simulation of weathering steel and the analysis of the influence of multiple variables on fatigue life. In this paper, the fatigue properties of uncorroded weathering steel and corroded weathering steel butt weld specimens are studied by experiments. Finally, the numerical analysis is carried out to discuss the influence of stress amplitude, initial crack position, initial crack size, crack shape, crack position, and welding dislocation on the fatigue life of butt weld specimens. The fatigue life prediction method proposed in this paper can provide support for the design of fatigue details of weathering steel bridges.
2. Experimental investigation
2.1. Material and sample design
The weathering steel Q345qDNH is used as the test sample, and the nominal thickness of the steel plate is 16 mm, which is commonly used in actual steel bridge manufacturing. The fatigue life of two groups of weathering steel was experimentally measured: one uncorroded and the other exposed to atmospheric conditions for one year.
The chemical composition of weathering steel grade Q345qDNH was verified through spectroscopic analysis, confirming full compliance with the compositional thresholds specified in GB/T 714-2015 Structural Steel for Bridges for weathering steel alloys [21].
The butt weld samples were fabricated via gas metal arc welding (GMAW) with carbon dioxide shielding, utilizing Atlantic CHT71 NHQ filler wire (1.2 mm diameter). The welding current is 240±20 A and the voltage is 30±2 V. After the welding is completed, the weld is evaluated according to the provisions of GB/T 11345-2013 “Non-destructive testing of welds-Ultrasonic testing-Techniques testing levels and assessment” [22]. The weld meets the requirements of the second-level weld in GB 50205-2001 “Standard for acceptance of construction quality of steel structures” [23].
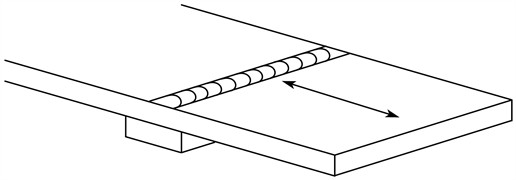
The selected fatigue-critical detail corresponds to standard butt welds prevalent in bridge engineering, classified under fatigue strength Category 70 MPa as per JTG D64-2015 Technical Specifications for Highway Bridge and Culvert Construction [24], as shown in Fig. 1.
Fig. 1Selection of fatigue details
The geometric design of the butt weld is shown in Fig. 2. The welding process is carbon dioxide gas shielded welding, the welding current is 240±20 A, and the voltage is 30±2 V. A representative fabricated specimen is illustrated in Fig. 3. To make the butt weld specimen meet the requirement that the flatness is not more than 1 mm/m, the butt weld specimen is corrected according to the provisions of JTG/T F50-2011 “Technical Specification for Construction of Highway Bridge and Culvert” after the welding is completed [24].
Fig. 2Geometric design of fatigue details (unit: mm)
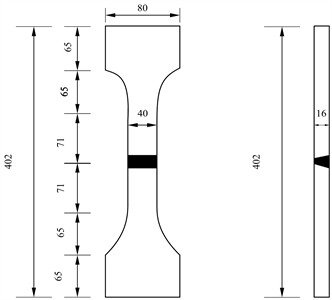
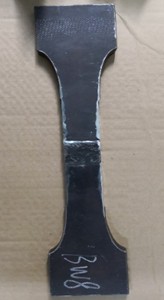
Fig. 3Sample finished product
Before the fatigue performance test, the characteristic values of each specimen before corrosion of the butt weld specimen were measured and averaged. The average size will be used for finite element model modeling. The characteristic value of the butt weld sample is shown in Fig. 4. Table 1 lists the average size of the characteristic values of the butt weld specimens.
Fig. 4Geometric characteristics of specimen
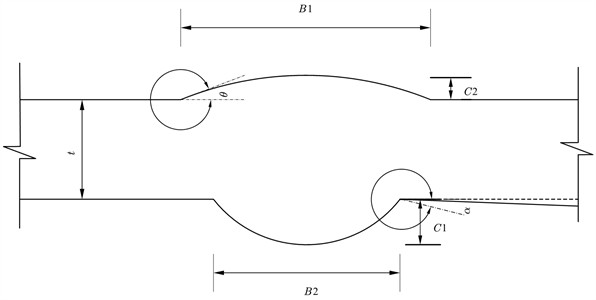
Table 1Average geometric measurement results of butt welds
(mm) | B1 (mm) | C1 (mm) | B2 (mm) | C2 (mm) | (°) | (°) | |
Mean value | 16.00 | 30.00 | 2.65 | 14.00 | 1.32 | 0.01 | 20.36 |
2.2. Experimental process
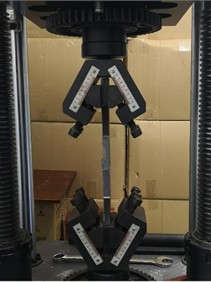
Fatigue testing was conducted using a QBG-250 high-frequency servo-hydraulic fatigue testing machine with a load capacity of ±250 kN (±25 tons). The lower end of the specimen is fixed by the fixture and the fatigue testing machine, and the constant amplitude fatigue load is applied to the specimen by the upper fixture, as shown in Fig. 5. The test was carried out at room temperature with a stress ratio of 0.1. The initial loading frequency of this batch of butt weld samples is about 100 Hz.
China’s JTG D64-2015 “Specifications for Design of Highway Steel Bridge” stipulates that the fatigue strength corresponding to the butt weld is 70 MPa [25]. When the fatigue loading test is carried out, the initial maximum loading stress is 100 MPa, and the corresponding effective stress amplitude is 90 MPa. The upper limit of the loading times of the specimen is set to 5 million times. When the specimen is destroyed within 5 million times of loading, the loading stress of the next specimen increases by 10 MPa. When the sample is loaded 5 million times and still not destroyed, the loading is stopped, and the loading stress of the next sample increases by 20 MPa [26].
Fig. 5Test device
2.3. Experimental phenomena
By observing the crack propagation form in the fatigue performance test of butt weld specimens, it is found that the failure of this batch of specimens is caused by the initial crack at the junction of weld and base metal. The fatigue failure of the specimens is dominated by a single initial defect, and the fatigue crack propagates in the base metal along the direction perpendicular to the load loading. After the fatigue performance test is completed, the static load is applied to fracture the sample to observe the critical crack depth. It is found that the critical crack depth accounts for about half of the plate thickness. To draw a more conservative conclusion, the critical crack depth is specified as the plate thickness in the numerical simulation, which is 16 mm[27].
2.4. Test results and discussion
The data obtained from the test include the fatigue properties of 9 uncorroded butt weld samples and 8 atmospherically exposed butt weld samples. The corresponding data points of 9 uncorroded butt weld samples and the fatigue life of 8 atmospherically exposed butt weld samples were obtained, as listed in Table 2 and Table 3, respectively.
Table 2Fatigue performance test results of uncorroded butt weld
Sample number | Stress amplitude (MPa) | Fatigue life (Loading times) |
A-1 | 99 | 1762200 |
A-2 | 117 | 2778700 |
A-3 | 126 | 1805500 |
A-4 | 135 | 1452600 |
A-5 | 144 | 1021800 |
A-6 | 153 | 4826400 |
A-7 | 153 | 947600 |
A-8 | 162 | 1238100 |
A-9 | 171 | 1421000 |
Table 3Fatigue performance test results of corroded butt weld
Sample number | Stress amplitude (MPa) | Fatigue life (Loading times) |
B-1 | 117 | 892200 |
B-2 | 126 | 2854600 |
B-3 | 135 | 662500 |
B-4 | 144 | 2226400 |
B-5 | 153 | 691900 |
B-6 | 162 | 487600 |
B-7 | 171 | 653400 |
B-8 | 180 | 338400 |
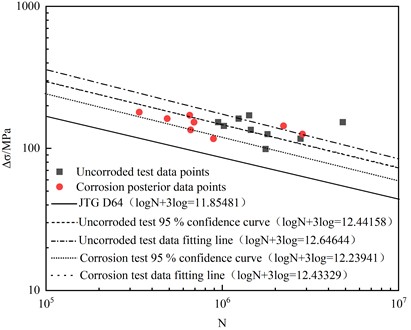
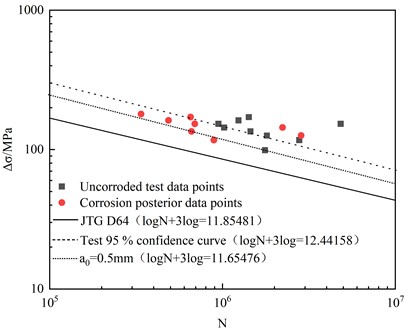
The data points obtained from the butt weld test, the fitted S-N curve, the S-N curve with 95 % confidence level , the test results of the uncorroded butt weld sample and the fitted S-N curve, the test results of the butt weld sample after atmospheric corrosion and its corresponding fitted S-N curve, as well as the design S-N curve of the butt weld in JTG D64-2015 Code for Design of Highway Steel Structure Bridges are depicted Fig.7 [27]. It can be seen from Fig. 6 that the data points of atmospherically exposed butt weld samples are located above the design S-N curve. The fatigue strength obtained from the 95 % confidence S-N curve of the uncorroded sample is 111.4 MPa, and the fatigue strength obtained from the 95 % confidence S-N curve of the corroded sample is 95.4 MPa. The fatigue strength of the butt weld sample decreased by 14.4 % after one year of atmospheric corrosion. However, the fatigue strength of this batch of butt weld samples after 1 year of exposure is still 25.6 % higher than the design fatigue strength of butt weld 70 MPa. It can be seen that the fatigue performance of this batch of atmospheric exposure corrosion butt welds still meets the requirements of the specification, and the designed S-N curve can safely predict the fatigue life of this batch of samples.
Fig. 6S-N curve of fatigue performance of butt weld specimens exposed to atmospheric corrosion
3. Numerical simulation
3.1. Fatigue life evaluation method of weathering steel
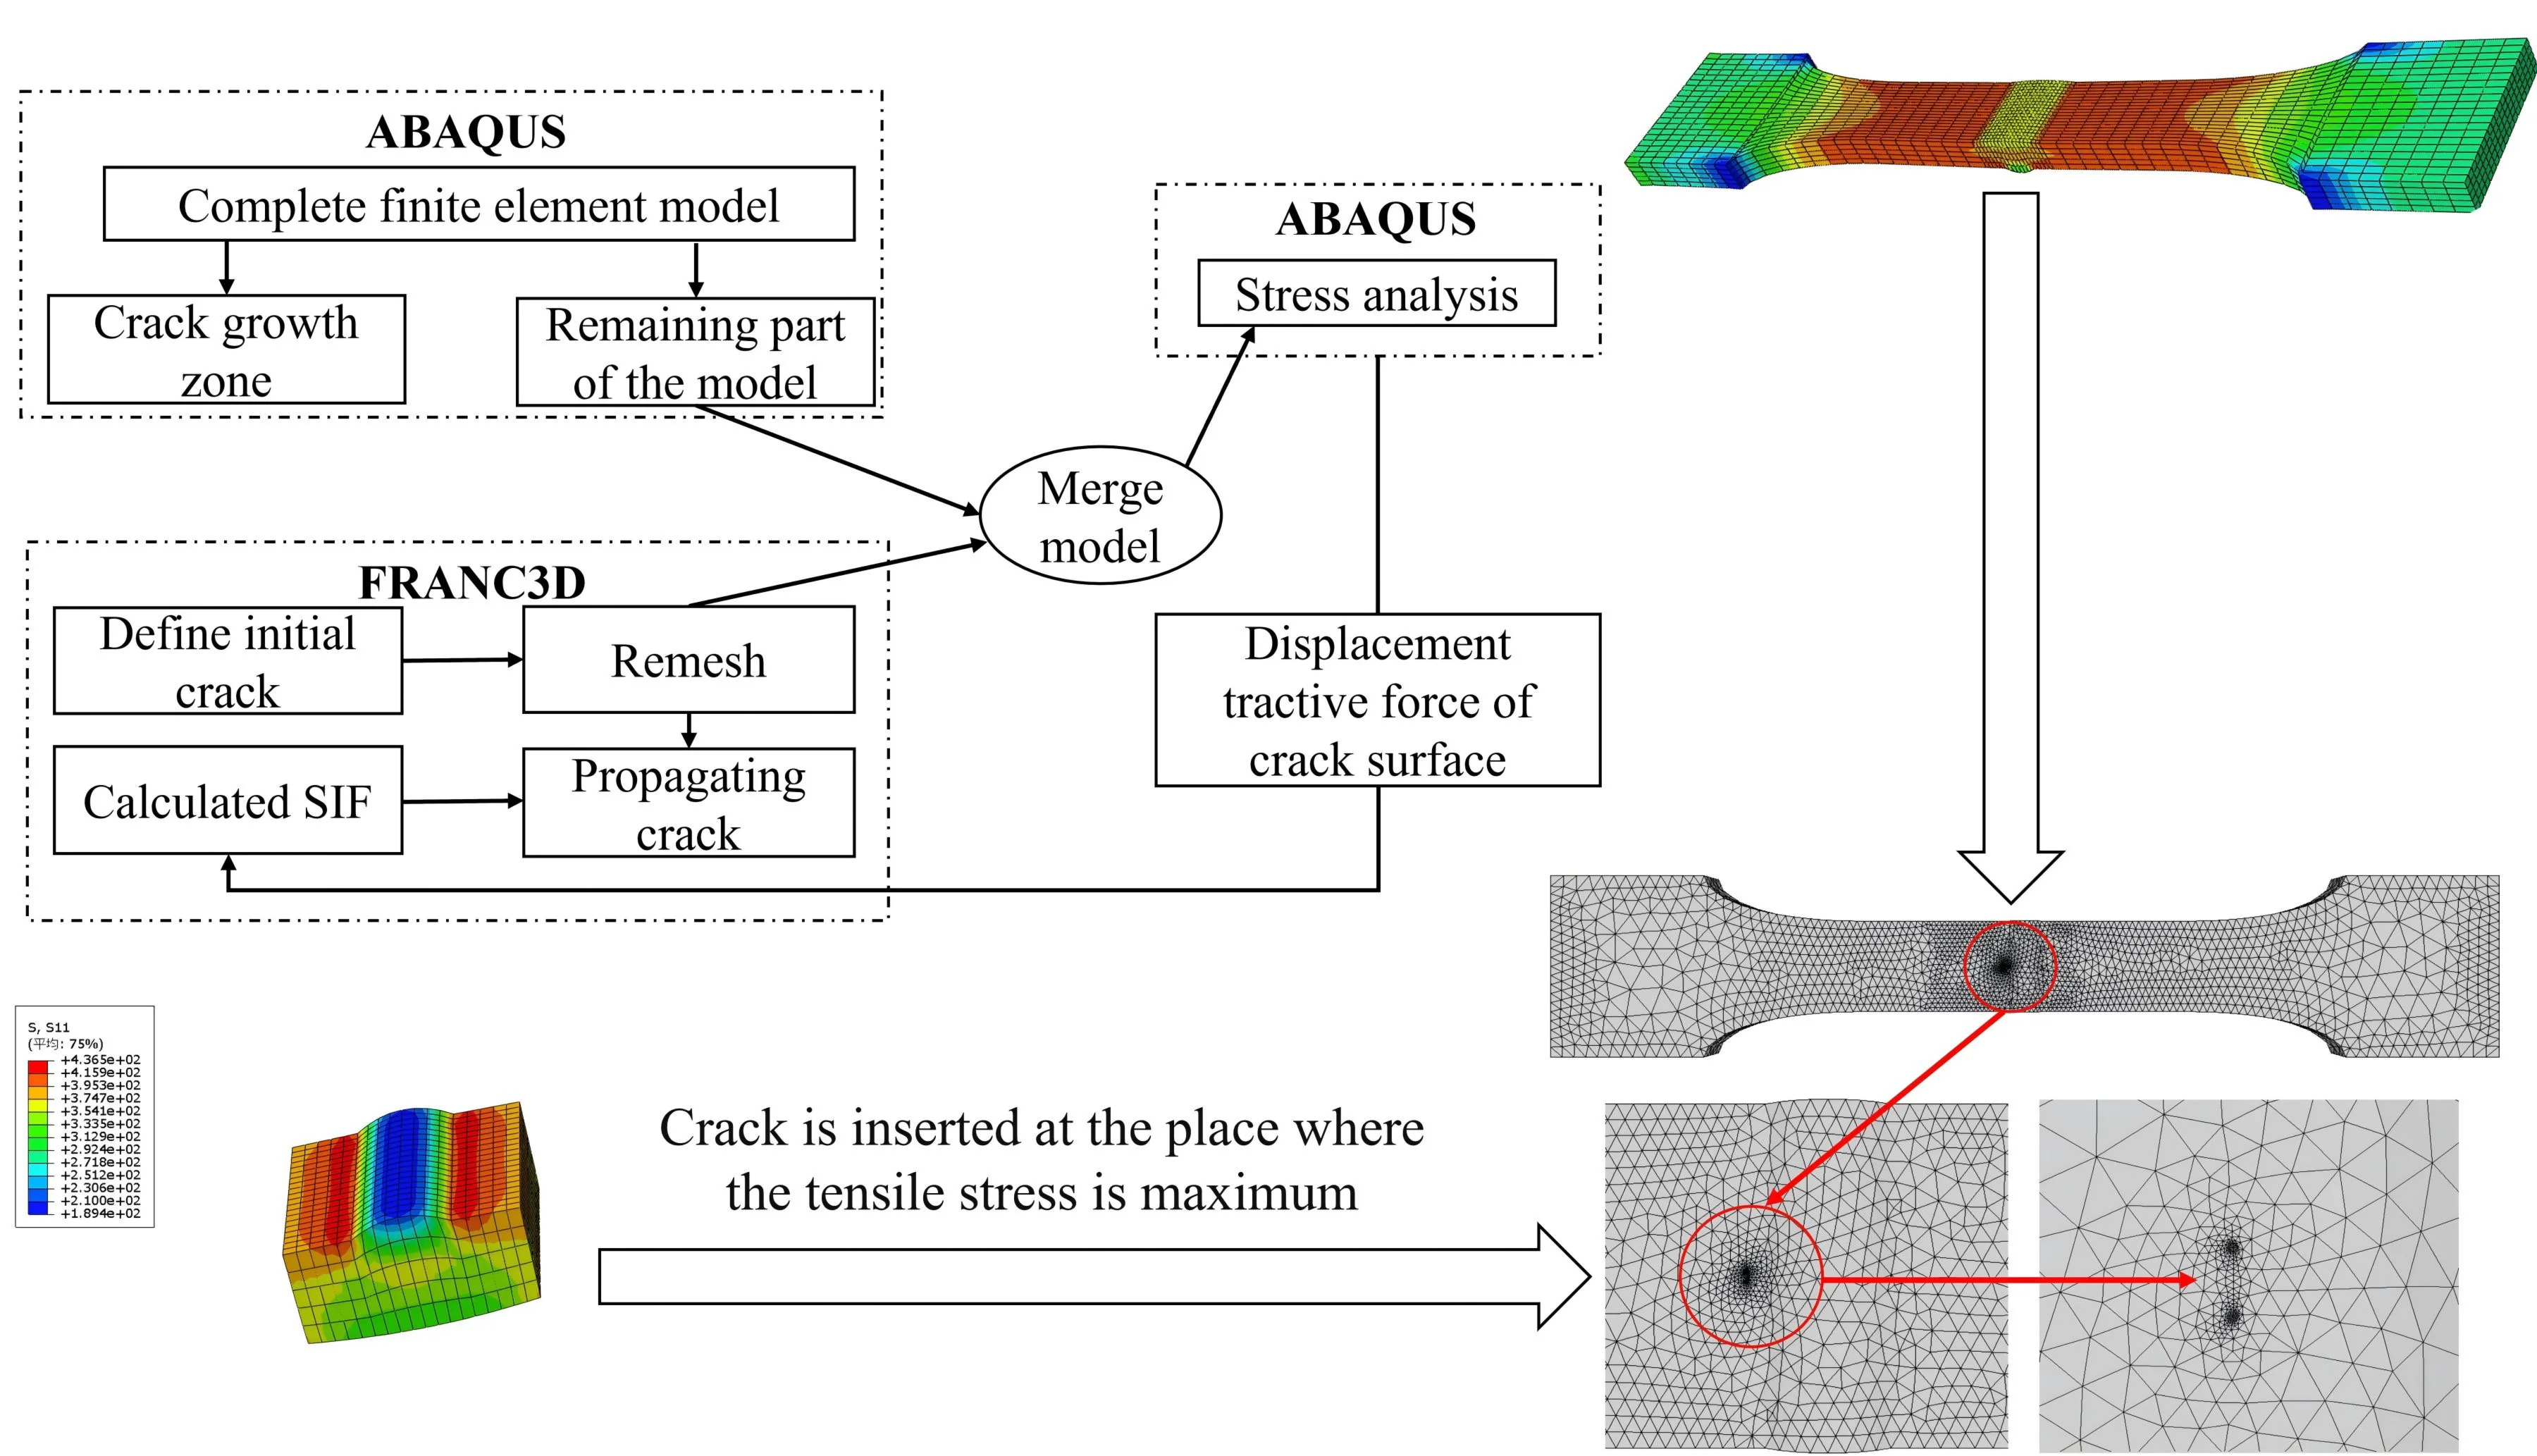
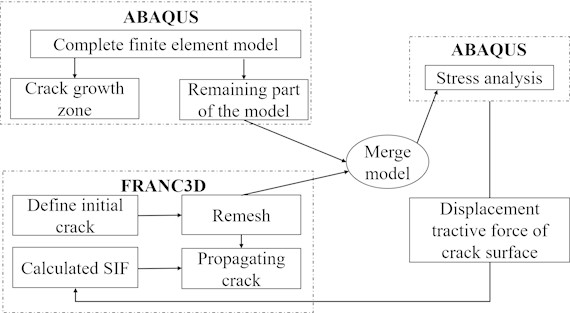
In this paper, the numerical calculation of fatigue crack propagation of weathering steel is realized by combining the finite element method and fracture mechanics, and the fatigue life evaluation method of weathering steel is established [28]. Leveraging the interactive platform of ABAQUS and FRANC3D, the numerical calculation of initial crack insertion and crack propagation under fatigue load is realized. Firstly, by employing the finite-element software ABAQUS, a finite-element model encompassing material parameters, mesh model, boundary conditions, and loads is established. Subsequently, the finite-element model is exported to FRANC3D for initial crack insertion. Once the initial crack is inserted into the model, FRANC3D re-divides the grid. The region adjacent to the crack tip will be redivided into wedge-shaped and hexahedral elements, while the remaining areas will be filled with tetrahedral elements [29]. Finally, FRANC3D calls the ABAQUS solver to calculate the displacement to update the crack front to achieve crack propagation and remeshing. The above three steps are repeated until the fatigue crack size reaches the critical crack size, and the numerical calculation of the initial crack propagation under fatigue load is realized. The specific process is shown in Fig. 7.
Fig. 7Joint simulation process of ABAQUS and FRANC3D
FRANC3D provides three methods to calculate the stress intensity factor, which are the M-integral method, displacement method, and virtual crack closure technique. Among them, the M-integral method is the most accurate method to calculate the stress intensity factor [30]. During the crack propagation process, it is essential to determine both the crack propagation direction and the calculation model of the equivalent stress-intensity-factor amplitude. FRANC3D provides five criteria for determining the direction of crack propagation, which are the maximum tensile stress criterion, the maximum shear stress criterion, the generalized stress criterion, the strain energy release rate criterion, and the plane propagation criterion. A substantial number of experimental investigations [5] have validated the effectiveness of the maximum tensile stress criterion, rendering it the most extensively utilized. FRANC3D provides two calculation models of equivalent stress intensity factor amplitude, which are the equivalent stress intensity factor amplitude model of type I open crack and the composite equivalent stress intensity factor amplitude model [11]. The crack propagation process adopts quasi-static crack propagation, presets the fatigue crack propagation step length, and then calculates the fatigue life through Eq. (1):
where: is fatigue life; is the initial crack size; is the predetermined crack propagation step length; is the critical crack size; and are fatigue crack growth rate parameters.
3.1.1. Finite Element Model
Based on the geometric dimensions presented in Table 1, a finite-element model of the butt-weld sample is constructed in ABAQUS. The C3D20 element is selected for this finite-element model. The element size is set to 3.5 mm in the vicinity of the weld, while it is 7 mm in the remaining areas. The element meshing is depicted in Fig. 8(a), the results of the static analysis are presented in Fig. 8(b), and the static analysis of the weld is shown in Fig. 8(c).
Fig. 8ABAQUS model
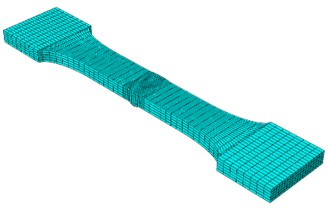
a) Grid division model
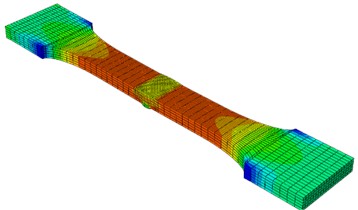
b) Static analysis cloud diagram
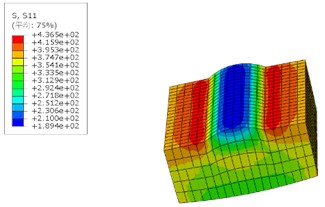
c) Butt weld analysis cloud chart
From the static-analysis results, it can be observed that there is a significant stress concentration around the weld, with a maximum value of 437 MPa. To ensure consistency with the test conditions, the lower part of the specimen is fixed and the fatigue load is applied through the upper part. The yield strength of the weathering steel base metal is 413 MPa, and the yield strength of the weld is 426 MPa, both of which are greater than the maximum fatigue load applied. Therefore, it is considered that the sample does not exhibit plastic deformation during the loading process. The material is pure elastic, the elastic modulus is 206 GPa, and the Poisson’s ratio is 0.3 [27].
3.1.2. Appraisal process
According to the analysis of Fig. 8(c), the stress value at the B2 weld position in Fig. 4 is 436 MPa, and the stress value at the B1 weld position is 338 MPa. It is found that the stress value at the B2 weld position is larger and the stress concentration effect is stronger. Therefore, the initial crack is inserted here during the simulation, and the critical crack size is taken as the plate thickness 16 mm. According to previous studies, the fatigue crack growth rate parameter is determined to be − 10.37, and is 2.38[27]. The fatigue crack propagation threshold is assumed to be 0 so the Paris formula is also applicable to the case where the stress intensity factor amplitude is in zone I, and the fatigue life prediction result is safer.
Fig. 9Initial crack insertion and mesh re-meshing
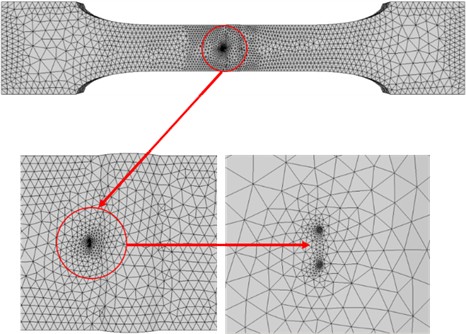
After the finite-element model is exported to FRANC3D, based on the ABAQUS static-analysis cloud diagram, it can be observed that the stress at the welding center is the highest. Therefore, the initial crack is inserted into the weld center, and the mesh is redivided, as depicted in Fig. 9. The region adjacent to the crack tip will be redivided into wedge-shaped and hexahedral elements, while the other regions will be filled with tetrahedral elements. The stress intensity factor amplitude is calculated by the integral method. The maximum tensile stress criterion is adopted to calculate the crack propagation angle. The effective stress intensity factor amplitude is calculated by employing the composite equivalent stress intensity factor amplitude model [30]:
where is the stress intensity factor amplitude caused by normal stress, is the stress intensity factor amplitude caused by shear stress, is the stress intensity factor amplitude caused by torsional stress, and is Poisson’s ratio. Therefore, Eq. (2) can be written as:
3.1.3. Evaluation results and analysis
The fatigue performance test results of the butt weld, the 95 % confidence S-N curve, the design S-N curve from JTG D64-2015 Code for Design of Highway Steel Structure Bridges, and the numerical calculation results of fatigue crack propagation are presented in Fig. 10. When the initial crack size is 0.5 mm, the fatigue strength of the S-N curve is 97.7 MPa. The results indicate that when the initial crack size is a 0.5 mm circular crack, the data point of the fatigue performance test of the butt weld lies above the numerical-calculation S-N curve. The numerical calculation S-N curve can accurately predict the fatigue life of the butt weld specimen and provide sufficient safety margin.
Fig. 10Numerical calculation results of fatigue crack propagation in butt weld
3.2. Influence factors of fatigue life
During the crack propagation simulation process, the impact of the crack propagation trend and fatigue life is assessed by calculating the stress intensity factor (SIF) at the crack tip. Subsequently, the influence of each initial crack parameter on the fatigue life of the specimen is analyzed.
3.2.1. Stress amplitude
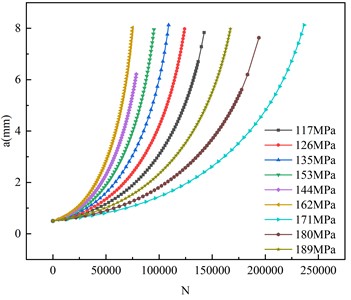
The numerical calculations indicate that an initial crack size of 0.5 mm is inserted at the center of the specimen, and the stress amplitudes are 117 MPa, 126 MPa, 135 MPa, 144 MPa, 153 MPa, 162 MPa, 171 MPa, 180 MPa, 189 MPa, respectively. The variation of crack tip with crack propagation depth a is shown in Fig. 11. The fatigue life of the butt-weld specimen is shown in Fig. 12. Fig. 11 depicts the magnitude of the stress-intensity factor amplitude at the relative position of the crack front under different stress amplitudes, that is, the ratio of the arc length from the crack point to the starting point on the front edge of the circular crack to the whole arc length. It can be seen from Fig. 11 that the stress intensity factor of the crack is large at both ends and small in the middle. The stress intensity factor near the middle crack front decreases with the increase of the initial crack length. 117 MPa, 126 MPa, 135 MPa, 153 MPa, 162 MPa, 171 MPa, 189 MPa, the corresponding maximum strength factors are 1043 MPa, 799 MPa, 855 MPa, 1262 MPa, 1443 MPa, 1397 MPa, 1604 MPa. It can be seen from Fig. 12 that with the increase in stress amplitude, the numerical calculation of fatigue life is significantly reduced. When the stress amplitude is 117 MPa, 126 MPa, 135 MPa, 144 MPa, 153 MPa, 162 MPa, 171 MPa, 180 MPa and 189 MPa respectively, the fatigue life of the butt weld sample is 82.00 %, 70.68 %, 60.21 %, 52.46 %, 46.09 %, 40.23 %, 33.21 % and 31.72 % of the stress amplitude of 117 MPa respectively. Evidently, the stress amplitude also has a substantial impact on the fatigue life of the butt-weld sample.
Fig. 11Stress intensity factors corresponding to different depths of crack propagation
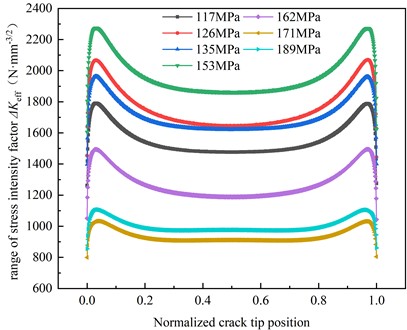
Fig. 12Effect of stress amplitude on fatigue life of butt weld specimen
3.2.2. Initial flaw size
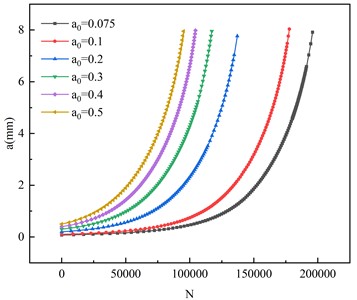
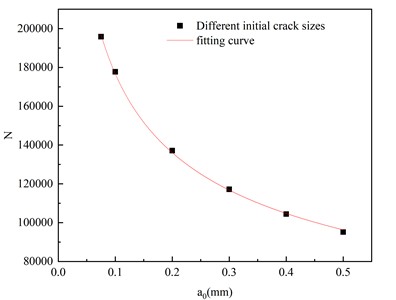
A circular crack with a stress amplitude of 171 MPa was investigated through numerical calculations. When the initial crack sizes were 0.075 mm, 0.1 mm, 0.2 mm, 0.3 mm, 0.4 mm, and 0.5 mm, respectively, the variation of crack-tip with crack propagation depth a of the butt weld specimen was shown in Fig. 13. As can be observed from Fig. 13 that the stress intensity factor of the crack is large at both ends and small in the middle, and the stress intensity factor near the middle crack front decreases with the increase of the initial crack length. The initial crack sizes are 0.075 mm, 0.1 mm, 0.2 mm, 0.3 mm, 0.4 mm, and 0.5 mm, respectively, and the corresponding maximum strength factors are 1313 MPa 1477 MPa 1497 MPa 1772 MPa, 1747 MPa, 1397 MPa. It can be found that with the increase of the initial crack length, the amplitude of the tip stress intensity factor tends to increase. The fatigue life is shown in Fig. 14. From the figure, it can be seen that as the initial crack size increases, the numerically-calculated fatigue life is significantly reduced. When the initial crack size is 0.1 mm, 0.2 mm, 0.3 mm, 0.4 mm, and 0.5 mm, the fatigue life of the butt weld specimen is 90.75 %, 70.00 %, 59.83 %, 53.32 %, and 48.58 % of the initial crack size of 0.075 mm, respectively. Thus, the initial crack size also has a substantial impact on the fatigue life of the butt-weld specimen.
Fig. 13Stress intensity factors corresponding to different depths of crack propagation
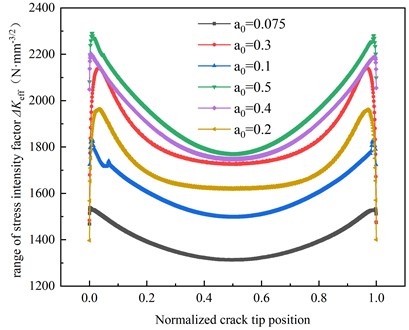
Fig. 14Effect of initial crack size on fatigue life of butt weld specimen
3.2.3. Initial crack shape
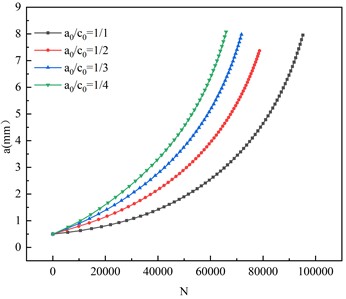
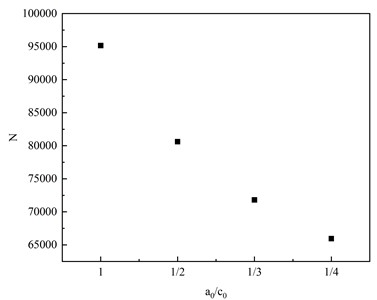
The crack-tip of the specimen with an initial crack size of 0.5 mm and the ratio of the short axis to the long axis of the initial crack / of 1/1, 1/2, 1/3 and 1/4 is studied by numerical calculation. The variation of the crack – tip with the crack propagation depth a is presented in Fig. 15. The maximum crack – tip stress – intensity factors corresponding to the crack shapes with the ratio of the short axis to the long axis of 1/1,1/2,1/3 and 1/4 are respectively: 1397 MPa, 1426 MPa, 1415 MPa, 1417 MPa, compared with the difference between the stress amplitude and the initial crack size on the maximum crack tip stress intensity factor, the initial crack shape has little effect on the maximum crack tip stress intensity factor. The a-N curve is shown in Fig. 16. When the stress amplitude is 171 MPa, the difference between the fatigue life of the initial crack short axis and the long axis ratio of 1/4 and the fatigue life of the initial crack short axis and the long axis ratio of 1/1, 1/2 and 1/3 is 30.70 %, 24.54 %, and 15.28 %, respectively. Thus, the initial crack shape has a relatively significant influence on the fatigue performance of the uncorroded butt-weld specimen.
3.2.4. Initial crack location
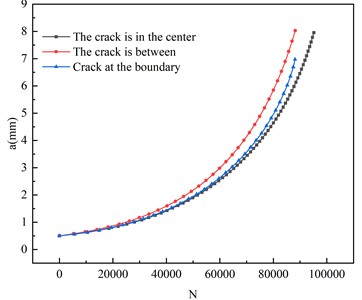
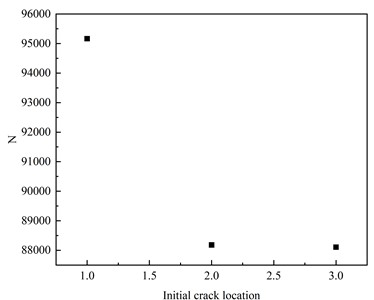
In this section, the fatigue properties of the specimens with initial cracks of center crack, edge crack, and between them are studied, as shown in Fig. 4-10. The initial crack size was set as a circular crack with a diameter of 0.5 mm. The variations of the crack-tip with the crack propagation depth for the initial central crack, edge crack, and the crack in-between are presented in Fig. 17, and the - curve is shown in Fig. 18. The maximum crack tip stress intensity factors corresponding to the initial crack inserted at the center, the boundary, and the crack shape between the two are 1397 MPa, 1229 MPa, 1305 MPa, compared with the difference between the stress amplitude and the initial crack size on the stress intensity factor of the maximum crack tip, the initial crack position has little effect on the stress intensity factor of the maximum crack tip. The difference in fatigue life between the central crack and the boundary crack is 7.3 %, and the difference in fatigue life between the central crack and the crack between the two is 7.4 %. Thus, the initial crack position has a relatively small influence on the fatigue performance of the butt-weld specimen.
Fig. 15Stress intensity factors corresponding to different depths of crack propagation
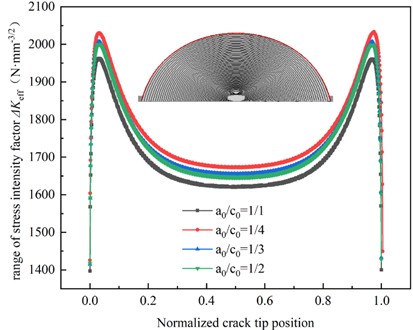
Fig. 16Effect of initial crack shape on fatigue life of butt weld specimen
3.2.5. Angular misalignment
As presented in Table 1, the average angular dislocation of the butt weld samples in this batch is 0.04°, and the corresponding flatness is 0.7 mm/m, which meets the requirement of JTG/T F50-2011 “Technical Specification for Construction of Highway Bridges and Culverts” [24] that the upper limit of flatness is 1 mm/m. Since angular misalignment can cause stress concentration and influence the fatigue life of the sample, this paper explores the impact of the angular dislocation of the butt-weld on the fatigue life of the sample.
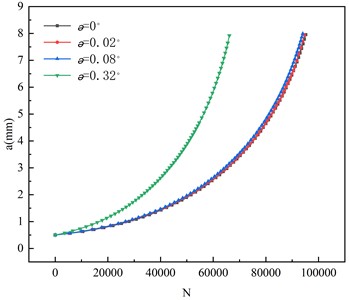
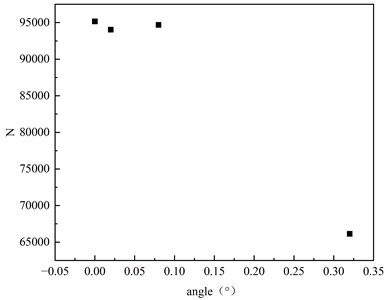
The angular misalignment of circular cracks with a stress amplitude of 171 MPa and an initial crack size of 0.5 mm are calculated to be 0.02°, 0.08°and 0.32°, respectively. The variation of crack tip with crack propagation depth a is shown in Fig. 19, and the a-N curve is shown in Fig. 20. The angular displacement is 0.02°, 0.08°, and 0.32°, respectively, and the corresponding maximum crack tip is 1513 MPa, 1843 MPa, 1847 MPa. When fatigue failure occurs, the difference of fatigue life between angular dislocation 0 and 0.02°, 0.08°, and 0.32° is 1.18 %, 0.50 % and 30.5 %, respectively. While minor misalignment had only a 1 % effect, exceeding flatness limits led to a fatigue life reduction of over 30 %, making it a critical factor.
Fig. 17Stress intensity factors corresponding to different depths of crack propagation
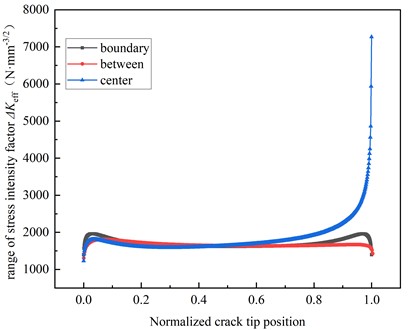
Fig. 18Effect of initial crack location on fatigue life of butt weld specimen
3.2.6. Summary
The stress amplitude has a great influence on the fatigue life of the specimen. The fatigue life of the specimen decreases with the increase of the stress amplitude, and the fatigue life of the stress amplitude of 117 MPa and 189 MPa is 31.72 %. The initial crack size has a great influence on the fatigue life of the specimen. The fatigue life of the specimen decreases with the increase of the initial crack size. The initial crack sizes are 0.075 and 0.5 mm, and the difference between the fatigue life of the two is 48.58 %. Therefore, it is very important to accurately evaluate the initial crack size for predicting the fatigue life of the structure. The initial crack shape has a great influence on the fatigue performance of the sample. The fatigue life of the initial crack with the ratio of the short axis to the long axis of 1/4 and 1/1 is 30.70 % different. The initial crack position has little effect on the fatigue performance of the specimen, and the difference in fatigue life at different positions is less than 10 %. The angular dislocation of the butt weld specimen has little effect on the fatigue performance of the specimen under the premise of meeting the flatness requirements of the specification, but the effect on the specimen when exceeding the flatness requirements of the specification can not be ignored.
Fig. 19Stress intensity factors corresponding to different depths of crack propagation
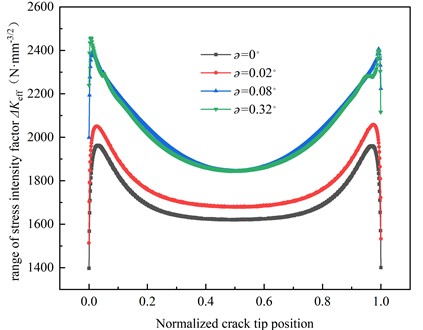
Fig. 20Effect of angular dislocation on fatigue life of butt weld specimen
4. Conclusions
This paper studies the feasibility of the fatigue life evaluation method of weathering steel butt weld based on finite element method and fracture mechanics. The influence of stress amplitude, initial crack size, and initial crack position on the fatigue performance of fatigue details is evaluated by ABAQUS-FRANC3D interactive technology. The main conclusions are as follows:
1) The fatigue life evaluation method of weathering steel but weld based on the finite element method and fracture mechanics can accurately evaluate the fatigue life of weathering steel samples. The fatigue strength obtained by the 95 % confidence S-N curve of the test is 95.4 MPa, and the fatigue strength of the numerical simulation is 97.7 MPa. The difference between the two is 2.5 %, which is a strong validation of the method.
2) There is a significant stress concentration phenomenon around the porosity defect of the welded joint, and the fatigue crack initiates from the edge of the porosity and propagates around.
3) The stress intensity factor at the crack tip is sensitive to the change in stress amplitude and initial crack length. The initial crack shape and crack position have little effect. The stress intensity factor distribution at both ends of the crack tip increases with the increase of the length, and the middle is opposite.
4) The stress amplitude, initial crack size, initial crack shape, and large-angle deviation all significantly influence the fatigue life of the specimen. Specifically, the fatigue life of the specimen decreases with an increase in stress amplitude and with an increase in initial crack size. In contrast, the initial crack location and small-angle deviation have minimal impact on the fatigue performance of the specimen.
References
-
W. Zhang, S. Yang, W.-T. Geng, Q. Hu, and L. Zhou, “Corrosion behavior of the low alloy weathering steels coupled with stainless steel in simulated open atmosphere,” Materials Chemistry and Physics, Vol. 288, p. 126409, Sep. 2022, https://doi.org/10.1016/j.matchemphys.2022.126409
-
D. D. Crampton, K. P. Holloway, J. Fraczek, and J. Wiss, “Assessment of weathering steel bridge performance in Iowa and development of inspection and maintenance techniques,” Iowa department of transportation. Office of Bridges and Structures, 2013.
-
X. Han, D. Y. Yang, and D. M. Frangopol, “Optimum maintenance of deteriorated steel bridges using corrosion resistant steel based on system reliability and life-cycle cost,” Engineering Structures, Vol. 243, p. 112633, Sep. 2021, https://doi.org/10.1016/j.engstruct.2021.112633
-
Z. Han, J. Li, H. Wang, and J. Zhao, “Initiation and propagation of a single internal 3D crack in brittle material under dynamic loads,” Engineering Fracture Mechanics, Vol. 285, p. 109299, Jun. 2023, https://doi.org/10.1016/j.engfracmech.2023.109299
-
Z. Wang, J. He, N. Lu, Y. Liu, X. Yin, and H. Xin, “Experimental and numerical investigation on penetrating cracks growth of rib-to-deck welded connections in orthotropic steel bridge decks,” Structures, Vol. 61, p. 106058, Mar. 2024, https://doi.org/10.1016/j.istruc.2024.106058
-
J. S. Cheng, S. Ma, J. H. Duan, R. Wang, and X. L. Du, “Research on the propagation characteristics of multiple cracks in steel bridge joints,” Theoretical and Applied Fracture Mechanics, Vol. 134, p. 104688, Dec. 2024, https://doi.org/10.1016/j.tafmec.2024.104688
-
D. Amato, L. Mayrhofer, C. Robl, G. Dhondt, and R. Citarella, “Prediction of the crack growth propagation direction in non-proportional mixed-mode missions,” International Journal of Fatigue, Vol. 166, p. 107233, Jan. 2023, https://doi.org/10.1016/j.ijfatigue.2022.107233
-
W. Zhang, Y. Su, Y. Jiang, Z. Hu, J. Bi, and W. He, “Data-driven fatigue crack propagation and life prediction of tubular T-joint: A fracture mechanics based machine learning surrogate model,” Engineering Fracture Mechanics, Vol. 311, p. 110556, Nov. 2024, https://doi.org/10.1016/j.engfracmech.2024.110556
-
Y.-S. Jeong, S. Kainuma, J.-H. Ahn, and W.-H. Lee, “Assessment of fatigue life of out-of-plane gusset welded joints using 3D crack propagation analysis,” Journal of the Korea institute for structural maintenance and inspection, Vol. 22, No. 1, pp. 129–136, Jan. 2018, https://doi.org/10.11112/jksmi.2018.22.1.129
-
Y. Ju, Y. Zhang, and H. Yu, “Numerical prediction and experiments for 3D crack propagation in brittle materials based on 3D-generalized maximum tangential strain criterion,” Theoretical and Applied Fracture Mechanics, Vol. 135, p. 104747, Feb. 2025, https://doi.org/10.1016/j.tafmec.2024.104747
-
S. G. Malipatil et al., “A study on the fatigue crack growth behaviour of GTM718 nickel based super alloy under cold-TURBISTAN spectrum loads,” Theoretical and Applied Fracture Mechanics, Vol. 120, p. 103386, Aug. 2022, https://doi.org/10.1016/j.tafmec.2022.103386
-
Y. Yang and M. Vormwald, “Fatigue crack growth simulation under cyclic non-proportional mixed mode loading,” International Journal of Fatigue, Vol. 102, pp. 37–47, Sep. 2017, https://doi.org/10.1016/j.ijfatigue.2017.04.014
-
H. Vaughan, “Crack propagation and the principal-tensile-stress criterion for mixed-mode loading,” Engineering Fracture Mechanics, Vol. 59, No. 3, pp. 393–397, Feb. 1998, https://doi.org/10.1016/s0013-7944(97)00138-0
-
J. Yao and J. Xiang, “Support vector regression-assisted finite element method for mode I-II fatigue crack growth path prediction,” Theoretical and Applied Fracture Mechanics, Vol. 131, p. 104336, Jun. 2024, https://doi.org/10.1016/j.tafmec.2024.104336
-
P. Zhang, J. Li, Y. Zhao, and J. Li, “Crack propagation analysis and fatigue life assessment of high-strength bolts based on fracture mechanics,” Scientific Reports, Vol. 13, No. 1, Sep. 2023, https://doi.org/10.1038/s41598-023-41804-z
-
W. Tu, J. Yue, H. Xie, and W. Tang, “Fatigue crack propagation behavior of high-strength steel under variable amplitude loading,” Engineering Fracture Mechanics, Vol. 247, p. 107642, Apr. 2021, https://doi.org/10.1016/j.engfracmech.2021.107642
-
Z. Guo, Y. Ma, L. Wang, J. Zhang, and I. E. Harik, “Corrosion fatigue crack propagation mechanism of high-strength steel bar in various environments,” Journal of Materials in Civil Engineering, Vol. 32, No. 6, Jun. 2020, https://doi.org/10.1061/(asce)mt.1943-5533.0003165
-
W. Zhao, G. Feng, M. Zhang, H. Ren, and C. Sinsabvarodom, “Effect of low temperature on fatigue crack propagation rates of DH36 steel and its butt weld,” Ocean Engineering, Vol. 196, p. 106803, Jan. 2020, https://doi.org/10.1016/j.oceaneng.2019.106803
-
N. Lu, H. Wang, J. Liu, Y. Luo, and Y. Liu, “Coupled propagation behavior of multiple fatigue cracks in welded joints of steel-bridge,” Journal of Constructional Steel Research, Vol. 215, p. 108532, Apr. 2024, https://doi.org/10.1016/j.jcsr.2024.108532
-
X. Jiang, D. Cao, X. Qiang, and C. Xu, “Study on fatigue performance of steel bridge welded joints considering initial defects,” Journal of Constructional Steel Research, Vol. 212, p. 108309, Jan. 2024, https://doi.org/10.1016/j.jcsr.2023.108309
-
“Structural steel for bridge,” (in Chinese), China Quality Standards Publishing Media Co., Ltd, Beijing, GB/T 714-2015, 2015.
-
“Non-destructive testing of welds. Ultrasonic testing. Techniques, testing levels, and assessment,” (in Chinese), National Standard of the People’s Republic of China, 2023.
-
“Standard for acceptance of construction quality of steel structures,” (in Chinese), China Planning Publishing House, Beijing, GB 50205-2020, 2020.
-
“Technical specification for construction of highway bridge and culvert,” (in Chinese), China Communications Press, Beijing, JTG/T F50-2011, 2011.
-
“Specifications for design of highway steel bridge,” (in Chinese), China Communications Press, Beijing, JTG D64-2015, 2011.
-
L. Zong, “Research on fatigue crack growth and life assessment method of steel bridge based on fracture mechanics,” (in Chinese), Ph.D. Thesis, Tsinghua University, Beijing, 2015.
-
H. Su, “Research on fatigue life assessment method of weathering steel bridge under corrosion,” (in Chinese), Ph.D. Thesis, Beijing Jiaotong University, Beijing, 2023.
-
J. Haeg and F. Elfving, “Potentials and limitations in finite element based crack propagation analysis using FRANC3D,” Chalmers University of Technology, 2020.
-
D. Bremberg and G. Dhondt, “Automatic mixed-mode crack propagation based on a combined hexahedral-tetrahedral approach,” Key Engineering Materials, Vol. 348-349, pp. 581–584, Sep. 2007, https://doi.org/10.4028/www.scientific.net/kem.348-349.581
-
R. Z. Liang, Z. C. Rui, Z. Y. Liang, and Z. H. Bo, “M-integral for stress intensity factor base on XFEM,” (in Chinese), in Proceedings of the Third International Symposium on Electronic Commerce and Security Workshops, pp. 226–230, 2010.
About this article

The authors would like to gratefully acknowledge the financial support by Shandong Provincial Communications Planning and Design Institute Group Co., Ltd (KJ-2023-SJYJT-10) and National Natural Science Foundation of China (52308132).
The datasets generated during and/or analyzed during the current study are available from the corresponding author on reasonable request.
Changze Xu: data curation, supervision. Qingyuan Liu: resources, visualization. Ruyi Guan: formal analysis, software. Luyang Feng: validation. Jianxing Du: writing-original draft, writing-review and editing.
The authors declare that they have no conflict of interest.
