Abstract
To investigate the influence of element parameters on the performance and acoustic field of flexible ultrasonic transducer arrays, this study employs finite element multiphysics simulation software to analyze various parameters of flexible ultrasonic transducers within a multiphysics coupled field. The analysis begins with simulating the width and thickness of piezoelectric materials in a single-element ultrasonic transducer structure. Simulation results indicate that the electromechanical coupling coefficient of the ultrasonic transducer exhibits a quasi-sinusoidal relationship with width. When the piezoelectric material width is 1.8 mm, the electromechanical coupling coefficient reaches its maximum at a thickness of 0.4 mm. Subsequently, simulations were conducted on various parameters of the flexible ultrasonic transducer array. Key investigations included the effects of piezoelectric unit count, inter-unit spacing, and frequency on the ultrasonic focusing performance of linear phased array transducers. Findings indicate that the focusing capability of flexible ultrasonic transducer arrays improves with reduced spacing and increased unit count. However, due to varying practical application requirements and manufacturing precision constraints, array parameters should be selected by comprehensively considering real-world factors. Overall, this study employs multiphysics coupling simulation to visually demonstrate how array element parameters influence the performance of flexible ultrasonic transducers. It provides valuable reference for advancing flexible ultrasonic technology from laboratory research toward commercial application.
1. Introduction
Ultrasound technology has emerged as a bright star in recent years, showing incredibly wide-ranging potential applications in a variety of domains, including biomedical engineering, non-destructive testing, and medical imaging. Ultrasound technology in medical imaging offers physicians a convenient and non-invasive means of viewing the human body's internal structure [1]-[3], In the field of non-destructive testing, it demonstrates significant application potential in structural health monitoring (SHM) [4]-[6], In practical applications, the acquired data requires processing. For example, Posilović Luka [7] et al. proposed a novel deep learning generative adversarial network model to generate realistic ultrasound B-scans featuring defects at different locations. Ultrasound technology even plays a crucial role in biomedical engineering, including the investigation of biological tissue properties and the management of illness [8].
The stiff structure of the majority of conventional ultrasonic transducers has revealed clear limitations in certain unique detecting settings. On the other hand, because of their special benefits, flexible ultrasonic transducers have drawn a lot of interest. Because of their natural flexibility, flexible ultrasonic transducers may stick to uneven surfaces more effectively. They have shown a lot of promise, whether in the medical field for identifying tiny lesions in the human body’s internal organs or in the industrial field for examining concealed flaws inside intricately structured workpieces. The stability and accuracy of ultrasonic signal transmission are enhanced by this adhesive ability, which significantly boosts detection efficacy.
However, a number of variables, including material characteristics, geometric structure, and operating frequency, affect how well flexible ultrasonic transducers work. For example, the transducer material's mechanical and electrical characteristics directly affect how well ultrasonic waves are generated and transmitted, while its geometric structure such as thickness, shape, and surface characteristics affects the quality of contact between the transducer and the object being detected, which in turn affects the radiation mode and sensitivity of ultrasonic wave detection. How to optimize the design to balance these performances has become a crucial challenge because of the various needs of various application scenarios.
Dong Siyan [9] et al. combined particle swarm optimization with recurrent neural networks to obtain the optimal parameter structure for the transmission performance of a 3×3 piezoelectric ultrasonic transducer array. Li Xihai [10] et al. employed genetic algorithms to optimize the array layout design, analyzing the effects of element arrangement and number on array directivity to achieve effective suppression of side lobes while reducing the number of elements used. Yu Qing [11] et al. analyzed the equivalent circuit model of piezoelectric micro-electro-mechanical ultrasonic transducers, investigating the effect of piezoelectric layer thickness on transducer performance using the finite element method. Peng Zhenyu [12] et al. performed numerical simulations with MATLAB software, establishing a radiated acoustic field model to analyze the directivity and acoustic field of transducer arrays under different parameters, without considering the impact of structural parameters of individual piezoelectric transducers on their performance.
In summary, this paper employs finite element simulation analysis software to conduct multiphysics coupled simulations on single elements and linear arrays of flexible ultrasonic transducers. It first simulates the structural parameters of a single-element flexible ultrasonic transducer, systematically investigating the influence of piezoelectric material width and thickness on transducer performance. Subsequently, a parameter sensitivity analysis of the flexible ultrasonic transducer array was conducted based on a one-dimensional linear array structure, focusing on critical parameters such as the number of transducers, spacing, and center frequency. Compared to other studies, this paper provides a more comprehensive demonstration of how individual element parameters and array parameters independently affect the performance of flexible ultrasonic transducers. Unlike algorithm-based optimization designs, the multiphysics coupling simulation employed in this study offers a more intuitive representation of how each parameter influences device performance.
2. Piezoelectric effect and array principle
2.1. Piezoelectric effect
The piezoelectric effect was first discovered in 1880 [13]. Under the influence of external forces and electric fields, this effect demonstrates the special electromechanical coupling properties of crystalline materials: when mechanical stress is applied along the crystal in a particular direction, the internal ions will experience relative displacement, changing the electric dipole moment. This is followed by the formation of equal and opposite sign charges on the crystal surface, creating a potential difference. Surface charge density has a linearly positive correlation with applied stress, according to experimental research, and this polarization effect is reversible.
The direct and inverse piezoelectric effects are the two types of piezoelectric effects that can be distinguished. The inverse piezoelectric effect is the property where applying an alternating electric field to a piezoelectric material causes mechanical deformation; the direct piezoelectric effect is the phenomenon where a material experiences internal electrical polarization under mechanical stress, resulting in induced charges on its surface. There is a reversible link between these two phenomena. Based on this idea, piezoelectric transducer technology is now widely used in electromechanical conversion devices like sonar systems and ultrasound imaging.
2.2. Piezoelectric equation
Piezoelectric materials remain electrically neutral when no external force is present. A potential shift is created when mechanical stress is applied because of the positive piezoelectric effect, which causes the material’s surface charges to accumulate. Eq. (1) illustrates the constitutive link between the potential shift and stress, which is linearly positively connected. The material maintains a zero strain condition in the absence of an external electric field; the inverse piezoelectric effect causes structural strain when an electric field is applied. Eq. (2) illustrates the constitutive relationship between the strain and electric field strength , which satisfy a linear relationship:
where, represents the piezoelectric constant of the piezoelectric material, reflecting the coupling between electric displacement and stress.
Furthermore, as Eq. (3) illustrates, the tension and strain produced by piezoelectric materials adhere to Hooke’s law:
where is the Young’s modulus of piezoelectric material.
Eq. (4) illustrate the connection between the applied electric field and the potential shift produced by piezoelectric materials:
The dielectric constant of piezoelectric materials is denoted by . Its dielectric constant also fluctuates under certain mechanical circumstances.
The dielectric constant, elasticity, and piezoelectricity of piezoelectric materials are represented in matrix form in three dimensions. Eq. (5) displays the dielectric constant matrix of piezoelectric materials:
Eq. (6) displays the matrix of piezoelectric constants:
Eq. (7) displays the matrix of elastic constants:
Both mechanical and electrical boundary constraints govern the behavior of piezoelectric ultrasonic transducers, and four different types of piezoelectric equations can be used to characterize their constitutive relationship. Piezoelectric materials' potential shift response and strain response can be caused by mechanical loads as well as external electric fields within the elastic limit. Two common operating circumstances are included in the electrical boundary conditions: open circuit and short circuit. Accordingly, mechanical freedom and mechanical clamping are the two states into which the mechanical boundary conditions can be separated [14-16].
The first type of boundary condition is mechanical freedom , electrical short circuit :
where, is the piezoelectric strain constant, is the transpose of , is the stress, is the strain, is the dielectric constant under constant stress, and is the flexibility matrix.
The second type of boundary condition is mechanical clamping , electrical short circuit :
where, is the dielectric constant under constant strain, is the piezoelectric stress constant, is the transpose of , and is the elastic stiffness under a constant electric field.
The third type of boundary condition is mechanical freedom , electrical open circuit :
where, is the dielectric constant under constant strain, is the transpose of , is the dielectric isolation ratio under constant stress, and is the flexibility coefficient under constant displacement.
The fourth type of boundary condition is mechanical clamping , electrical open circuit :
where, is the piezoelectric constant, is the transpose of , is the dielectric isolation ratio under constant strain,, and is the elastic stiffness under constant displacement.
2.3. Electromechanical coupling coefficient
The Electromechanical Coupling Coefficient (ECC) is a key parameter that characterizes the electromechanical energy conversion efficiency of flexible ultrasonic transducers. Its value directly determines the energy conversion efficiency of the device in the electric vibration field coupling, and thus affects the three key performance indicators of the transducer: sensitivity, operating bandwidth, and conversion efficiency [17]. This coefficient is not an independent parameter, but a composite parameter determined by the piezoelectric constant , elastic constant , and dielectric constant together. Therefore, the numerical value of the electromechanical coupling coefficient can serve as a quantitative standard for evaluating the performance of transducers.
The impedance () of a piezoelectric vibrator near its resonant frequency can be expressed as:
where, represents the static capacitance, denotes the thickness, and signifies the speed of sound.
Under resonance conditions, impedance is minimal; under antiresonance conditions, impedance is maximal. Solving for and yields, and thus obtain:
where, denotes the resonant frequency, denotes the anti-resonant frequency, and denotes the electromechanical coupling coefficient.
Considering the nonlinearity of the tangent function, a more precise formula is obtained as:
The final Eq. (15) allows the calculation of the electromagnetic coupling coefficient based on the resonance frequency and anti-resonance frequency :
2.4. Ultrasonic phased control technology
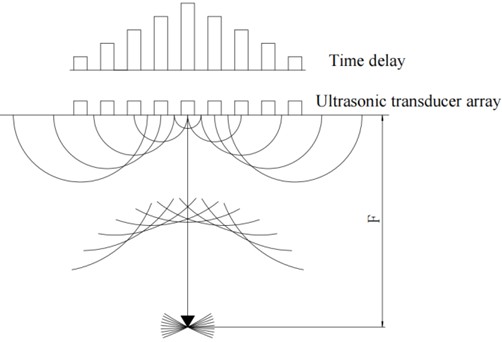
The approach known as Phased Array Ultrasonic Technology (PAUT) carefully regulates the phase connection between the sent and received signals of each member in a transducer array to accomplish beam focusing, dynamic deflection, and scanning. The foundation of ultrasonic phased array technology is Huygens’ principle, which determines the delay relationship of each array element based on the sound path difference of each array element and the sound path depending on the distance between the array element and the focus point. Sound waves’ focusing properties and direction of propagation can be altered by varying the time delay of each array element [18]. Fig. 1 illustrates the ultrasonic phased array technology's focusing concept.
The physical basis of ultrasonic phased array technology includes the principle of wave superposition, coherent interference effect, and Huygens Fresnel principle. Phased array multi element probes provide major advantages in defect detection accuracy and imaging resolution over conventional single element probes because they can electronically deflect and dynamically focus sound beams through time delay control [19, 20].
3. Structural simulation and design of single element flexible ultrasonic transducer
3.1. Overview of finite element simulation analysis method
Finite Element Analysis (FEA) is a numerical analysis method based on the variational principle, which is suitable for solving multi physics coupling problems, including but not limited to structural mechanics, heat conduction, electromagnetic fields, and fluid dynamics. Its core lies in discretizing the continuous domain into a finite number of units with interpolation functions, and simulating the behavior of actual systems through mathematical approximations and numerical calculations [21, 22].
Fig. 1Ultrasonic phased array focusing schematic diagram
The standard analysis process consists of three key stages:
1) Preprocessing stage: Complete geometric modeling, mesh generation, material parameter definition, and boundary condition setting.
2) Solution stage: Based on the theory of multiphysics coupling, solve nonlinear algebraic equations, focusing on complex working conditions such as material nonlinearity, geometric nonlinearity, and transient response.
3) Post processing stage: Verify results and design iterations through visualization of field variables (such as stress cloud maps and displacement vector maps).
FEA is widely used in structural stress analysis, thermal management of electronic components, fluid flow simulation, and electromagnetic equipment design, especially in multi physics field coupling (such as thermal structural, acoustic solid coupling) where it has significant advantages.
This article uses finite element multi physics simulation software to model and simulate the single element and array form of flexible ultrasonic transducers. The specific simulation analysis process is shown in Fig. 2.
3.2. Structural design of single element flexible ultrasonic transducers
The flexible ultrasonic transducer array is composed of many elements, and the physical characteristics of a single element transducer largely determine the ability of the flexible ultrasonic transducer array to achieve sound beam focusing. In order to better study the performance of the flexible ultrasonic transducer array, this paper first simulates and analyzes the structural parameters of a single element flexible ultrasonic transducer.
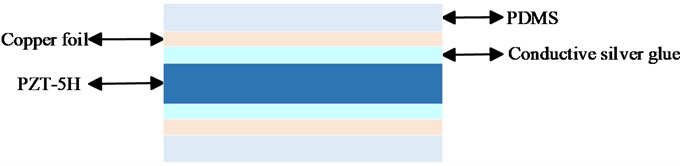
This article uses finite element analysis software to simulate and analyze a single element flexible ultrasonic transducer, mainly exploring the influence of the width and thickness of the piezoelectric material on its performance in the single element flexible ultrasonic transducer. The structural design of the ultrasonic transducer is shown in Fig. 3.
Table 1 presents some material and dimensional parameters of the ultrasonic transducer.
Table 1Structural materials and dimensional parameters of ultrasonic transducers
Materials | Size parameter (mm) |
PDMS | 0.2 |
Copper foil | 0.1 |
Conductive silver glue | 0.1 |
Fig. 2Simulation flowchart
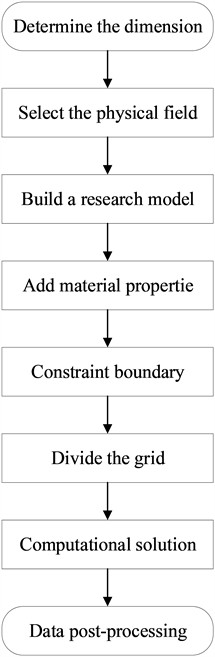
Fig. 3Structure diagram of the ultrasonic transducer
3.3. The influence of piezoelectric material thickness on the performance of ultrasonic transducers
Fig. 4 displays the admittance and impedance curves for various thicknesses. The resonant and antiresonant frequencies of the corresponding structures were extracted, the data recorded, and the corresponding electromechanical coupling coefficients calculated using Eq. (15). ultimately yielding the parameters of the ultrasonic transducer for different piezoelectric material thicknesses.
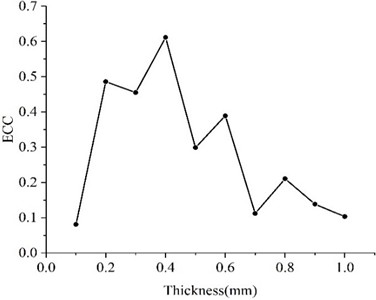
Table 2 records the values of various parameters for ultrasonic transducers at different piezoelectric material thicknesses. Plotting the data from Table 2 yields the variation curve of the electromechanical coupling coefficient with piezoelectric material thickness.
In this section, under the parameter setting of a piezoelectric material width of 1.8, the influence of the thickness of the piezoelectric material on the performance of the ultrasonic transducer was studied. Fig. 5 shows the variation curves of the piezoelectric coupling coefficient at different piezoelectric material thicknesses. The simulation results show that when the thickness increases from 0.1 to 1.0, the electromechanical coupling coefficient varies between 0.081 and 0.612, and when the thickness is, the electromechanical coupling coefficient of the ultrasonic transducer takes the maximum value of 0.612.
Table 2Values of each parameter for different piezoelectric material thicknesses
Thickness (mm) | Resonant frequency (MHz) | Anti-resonant frequency (MHz) | ECC |
0.1 | 7.54 | 7.52 | 0.081 |
0.2 | 11.32 | 10.12 | 0.486 |
0.3 | 7.74 | 7.03 | 0.455 |
0.4 | 8.73 | 7.16 | 0.612 |
0.5 | 8.52 | 8.20 | 0.299 |
0.6 | 8.41 | 7.86 | 0.389 |
0.7 | 9.80 | 9.75 | 0.112 |
0.8 | 8.74 | 8.58 | 0.211 |
0.9 | 7.69 | 7.63 | 0.138 |
1.0 | 8.92 | 7.96 | 0.489 |
Fig. 4Conductance and impedance curves of piezoelectric material with thicknesses of 0.2 mm and 0.8 mm
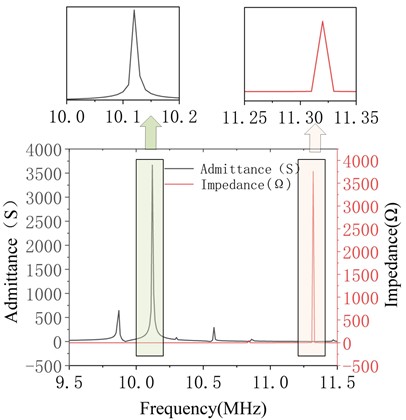
a) At a thicknesses of 0.2 mm
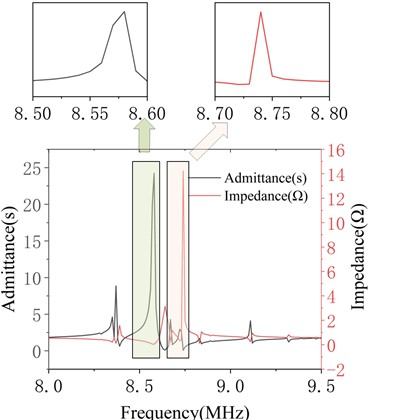
b) At a thicknesses of 0.8 mm
Fig. 5ECC for different piezoelectric material thicknesses
3.4. The influence of piezoelectric material width on the performance of ultrasonic transducers
Fig. 6 displays the admittance and impedance curves for partial widths. The resonant and antiresonant frequencies of the corresponding structures were extracted from these curves, and the recorded data were used to calculate the electromechanical coupling coefficient of each structure based on Eq. (15). This process ultimately yielded the parameter values for the ultrasonic transducer at different piezoelectric material widths.
Fig. 6Conductance and impedance curves of piezoelectric materials with widths of 0.1 mm, 0.2 mm, 1.1 mm, and 1.2 mm
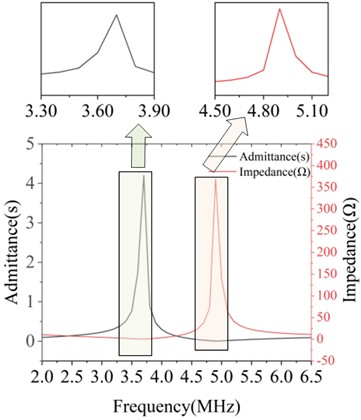
a) At a width of 0.1 mm
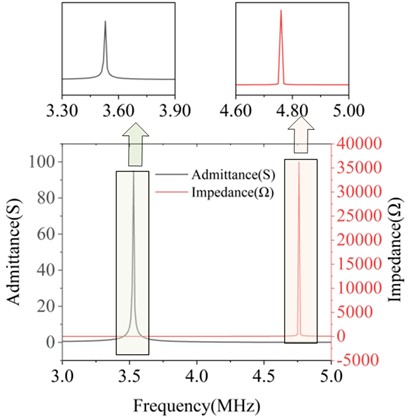
b) At a width of 0.2 mm
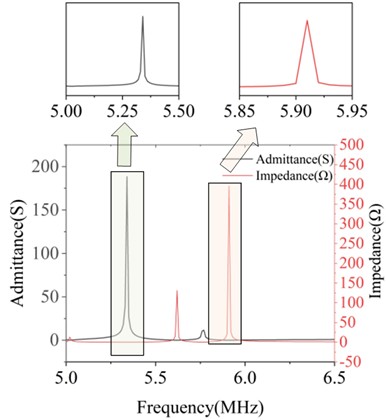
c) At a width of 1.1 mm
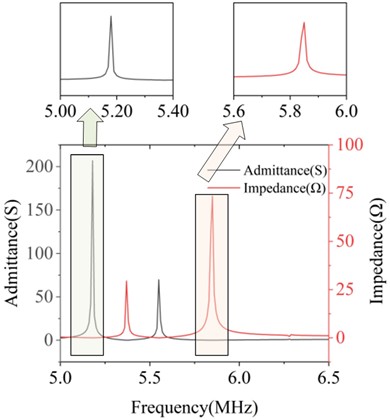
d) At a width of 1.2 mm
Table 3 records the values of various parameters for ultrasonic transducers with different piezoelectric material widths. Plotting the data from Table 3 yields the variation curve of the electromechanical coupling coefficient with piezoelectric material width.
In this section, under the parameter setting of a piezoelectric material thickness of 0.4, the influence of the piezoelectric material width on the performance of the ultrasonic transducer was studied. Fig. 7 shows the variation curves of the piezoelectric coupling coefficient at different piezoelectric material widths. The simulation results show that the electromechanical coupling coefficient of the ultrasonic transducer presents a sinusoidal relationship with the width. When the width is, the electromechanical coupling coefficient is very high, reaching 0.770 at 0.4, 0.692 at 0.8, 0.653 at 0.8, and 0.612 at 1.8 respectively. The electromechanical coupling coefficient keeps showing peaks and troughs as the width increases. Although the electromechanical coupling coefficient of the ultrasonic transducer is very high when the width is small, it needs to be considered that in actual preparation, if the width is too small, it will greatly increase the preparation difficulty. Moreover, the wider the ultrasonic transducer is, the narrower the ultrasonic beam it emits and the stronger the directivity. This is because the acoustic wave interference formed by large-sized transducers in space is more concentrated, and the energy is more focused in the direction of the main lobe. Meanwhile, an overly large width will lead to a significant reduction in the flexibility of the flexible ultrasonic transducer.
Table 3Values of each parameter of the ultrasonic transducer for different piezoelectric material widths
Height (mm) | Resonant frequency (MHz) | Anti-resonant frequency (MHz) | ECC |
0.1 | 4.93 | 3.67 | 0.705 |
0.2 | 4.76 | 3.53 | 0.708 |
0.3 | 4.50 | 3.26 | 0.725 |
0.4 | 4.29 | 2.9 | 0.770 |
0.5 | 3.76 | 3.46 | 0.427 |
0.6 | 4.94 | 4.72 | 0.324 |
0.7 | 5.60 | 4.37 | 0.664 |
0.8 | 5.32 | 4.02 | 0.692 |
0.9 | 5.95 | 4.78 | 0.635 |
1.0 | 5.83 | 5.51 | 0.358 |
1.1 | 5.91 | 5.34 | 0.465 |
1.2 | 5.85 | 5.18 | 0.503 |
1.3 | 5.79 | 4.57 | 0.653 |
1.4 | 5.80 | 4.83 | 0.593 |
1.5 | 5.77 | 5.45 | 0.360 |
1.6 | 5.76 | 5.34 | 0.409 |
1.7 | 5.74 | 4.85 | 0.574 |
1.8 | 5.73 | 4.70 | 0.612 |
1.9 | 5.71 | 5.17 | 0.461 |
2.0 | 5.68 | 4.80 | 0.574 |
2.1 | 5.69 | 4.69 | 0.606 |
2.2 | 5.66 | 5.14 | 0.455 |
2.3 | 5.65 | 4.73 | 0.586 |
2.4 | 5.59 | 5.19 | 0.406 |
2.5 | 5.66 | 5.15 | 0.451 |
2.6 | 5.82 | 4.78 | 0.610 |
2.7 | 5.80 | 5.11 | 0.512 |
2.8 | 5.74 | 4.58 | 0.642 |
2.9 | 5.79 | 4.98 | 0.549 |
3.0 | 5.54 | 5.10 | 0.426 |
It can be known from the data in Table 4 that the electromechanical coupling coefficient of PZT-5H is 0.52. In the simulation results of this section: The electromechanical coupling coefficient of the structure reaches 0.770 when the width is 0.4. It reaches 0.692 when the width is 0.8. It reaches 0.653 when the width is and 0.612 when the width is 1.8, which is almost 1.5 times that of the piezoelectric ceramic sheet.
Table 4 shows the main parameters of certain types of piezoelectric materials.
Fig. 7ECC for different piezoelectric material widths
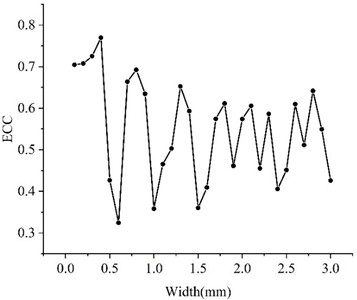
Table 4Parameters of piezoelectric ceramic materials
Parameters | Materials | |||||
P-5A | P-5B | P-5H | P-5X | P-4 | P-8 | |
Relative Permittivity | 1800 | 2300 | 3200 | 4500 | 1150 | 1000 |
Sound velocity | 3930 | 3850 | 3850 | 3900 | 4500 | 4550 |
Poisonby | 0.36 | 0.36 | 0.36 | 0.36 | 0.30 | 0.30 |
Mechanical quality factor | 75 | 80 | 85 | 85 | 500 | 800 |
Density | 7.5 | 7.5 | 7.5 | 7.5 | 7.5 | 7.5 |
Curie temperature | 300 | 280 | 280 | 280 | 310 | 300 |
ECC | 0.48 | 0.50 | 0.52 | 0.55 | 0.45 | 0.40 |
4. Parameter sensitivity analysis of flexible ultrasonic transducer arrays
There are various configurations of flexible ultrasonic transducer arrays, and this study focuses on one-dimensional linear array structures. The beam focusing characteristics of one-dimensional linear arrays are regulated by three key parameters: 1) The number of array elements; 2) Array element spacing; 3) Center frequency [23]-[25]. Based on the multi-physics field coupled finite element model, this paper numerically simulates the sound field distribution of one-dimensional linear arrays and quantitatively characterizes their sound beam focusing performance. The influence laws of the number of array elements, spacing and center frequency on the focusing characteristics of the sound beam are revealed through parametric analysis.
In this section, the acoustic-solid coupling module in the finite element simulation software is adopted for simulation. The acoustic domain is set as a rectangle, and ultrasonic transducers are constructed at its bottom edge. Apply power to each ultrasonic transducer, the acoustic boundary conditions of the simulation module are set, and the delays of each ultrasonic transducer are set according to the focusing and focusing deflection rules. Among them, the material of the acoustic domain medium is set as human tissue. To simulate the real propagation of ultrasonic sound waves in the human body, the material density is set at 1200 kg/m3 and the sound velocity is set at 1540 m/s.
4.1. The influence of ultrasonic transducer spacing on beam focusing
Fig. 8 illustrates the focusing effect of ultrasonic beams at partial spacings. Data was extracted from this figure, ultimately yielding parameter values for different ultrasonic transducer spacings.
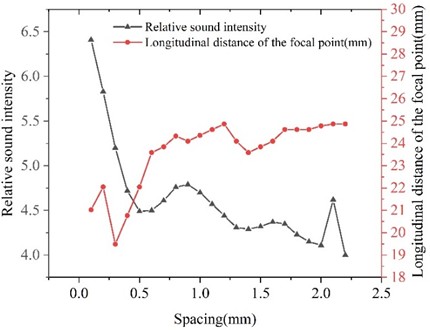
Table 5 records the values of various parameters at different ultrasonic transducer spacings. By plotting the data from Table 5, we can obtain a line chart showing the variation of these parameters with different ultrasonic transducer spacings.
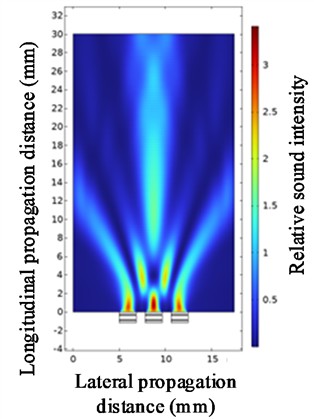
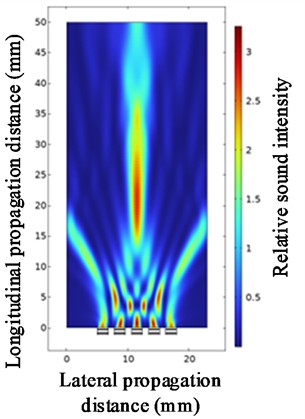
Under the conditions of fixed parameters (the number of array elements = 7, the center frequency = 1 MHz, and the focusing distance = 25), the influence of the spacing of ultrasonic transducers on the beam focusing effect was studied. Fig. 9 is a line graph of the changes in the values of each parameter under different ultrasonic transducer spacings. As shown in Fig. 9, the sound intensity at the focusing point gradually decreases with the increase of the spacing of the ultrasonic transducers. When the spacing is 0.1 to 0.5, the longitudinal focusing distance differs significantly from the specified focusing distance. Other focusing distances do not differ much from the specified one. An increase in the spacing will make the side lobes more obvious and simultaneously lead to a decrease in the sound intensity of the main lobe. Therefore, the spacing of ultrasonic transducers should not be too large. However, the actual manufacturing process accuracy should be taken into account. If the spacing of ultrasonic transducers is too small, it will increase the precision requirements for the actual manufacturing process, which undoubtedly will increase the difficulty of actual manufacturing.
Fig. 8Ultrasonic beam focusing diagrams with spacings of 0.4 mm, 0.8 mm, 1.2 mm, and 1.8 mm
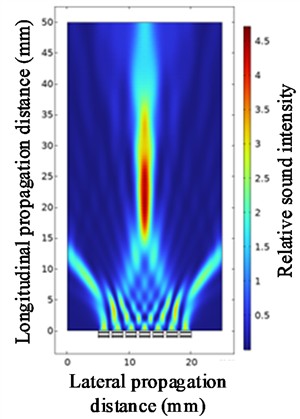
a) At a spacing of 0.4 mm
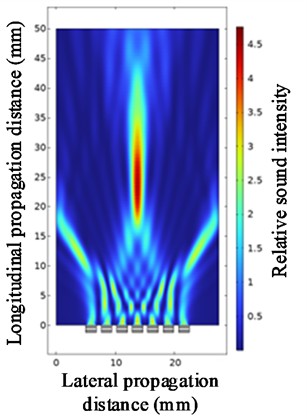
b) At a spacing of 0.8 mm
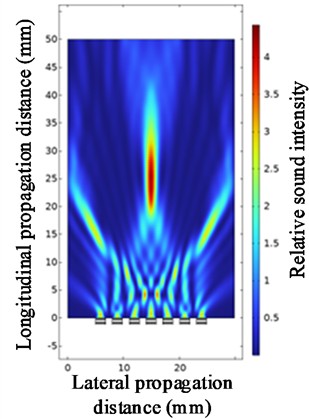
c) At a spacing of 1.2 mm
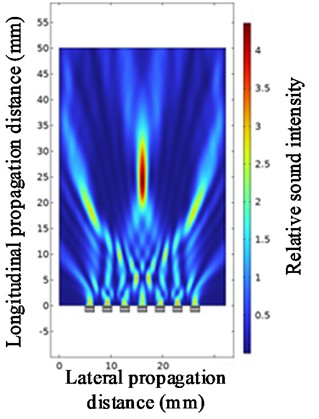
d) At a spacing of 1.8 mm
Table 5Values of each parameter for different ultrasonic transducer spacing
Distance (mm) | Relative sound intensity | Longitudinal distance of focusing point |
0.1 | 6.41 | 21.03 |
0.2 | 5.83 | 22.05 |
0.3 | 5.20 | 19.49 |
0.4 | 4.72 | 20.77 |
0.5 | 4.49 | 22.05 |
0.6 | 4.50 | 23.59 |
0.7 | 4.61 | 23.85 |
0.8 | 4.76 | 24.33 |
0.9 | 4.79 | 24.10 |
1.0 | 4.70 | 24.36 |
1.1 | 4.57 | 24.62 |
1.2 | 4.44 | 24.87 |
1.3 | 4.31 | 24.10 |
1.4 | 4.29 | 23.59 |
1.5 | 4.32 | 23.85 |
1.6 | 4.37 | 24.10 |
1.7 | 4.35 | 24.62 |
1.8 | 4.23 | 24.62 |
1.9 | 4.15 | 24.62 |
2.0 | 4.11 | 24.78 |
2.1 | 4.62 | 24.87 |
2.2 | 4.00 | 24.87 |
Fig. 9Line graph of the variation of the values of each parameter for different ultrasonic transducer spacing
4.2. The influence of the number of ultrasonic transducers on beam focusing
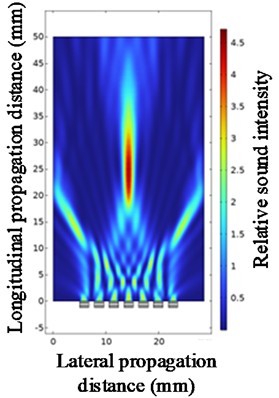
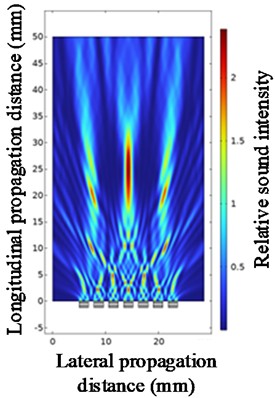
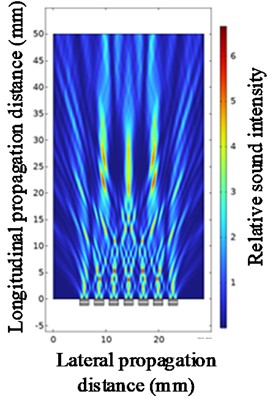
Fig. 10 illustrates the focusing effect of partial ultrasonic beams. Data was extracted from this figure, ultimately yielding parameter values for different numbers of ultrasonic transducers.
Table 6 records the values of various parameters under different numbers of ultrasonic transducers. By plotting the data results from Table 6, we can obtain a line chart showing the variation of parameter values with different numbers of ultrasonic transducers.
Under fixed parameter conditions (array element spacing = 0.8, center frequency = 1 MHz, focusing distance = 25), the influence of the number of ultrasonic transducers on the beam focusing effect was studied. Fig. 11 is a line graph of the changes in the values of each parameter under different numbers of ultrasonic transducers. As shown in Fig. 11, when the number is 14, the longitudinal focusing distance differs significantly from the set focusing distance. Other focusing distances do not differ much from the set ones. When the number is 14, the relative sound intensity of the focusing point fluctuates between 1.47 and 3.41. In addition, the sound intensity of the focusing point increases with the increase in the number of ultrasonic transducers. As shown in Fig. 11, an increase in the number of ultrasonic transducers will enhance the acoustic intensity of the main lobe, make the energy of the synthetic beam more concentrated, and achieve a more ideal focusing effect. In actual preparation, the increase in the number of ultrasonic transducer array elements is often accompanied by an increase in the number of channels in the electronic circuit, which increases the manufacturing cost. A larger number will also reduce the flexibility of the array and increase the difficulty of actual manufacturing.
Fig. 10Ultrasonic beam focusing diagrams with quantities of 3, 5, 7 and 9
a) At a quantity of 3
b) At a quantity of 5
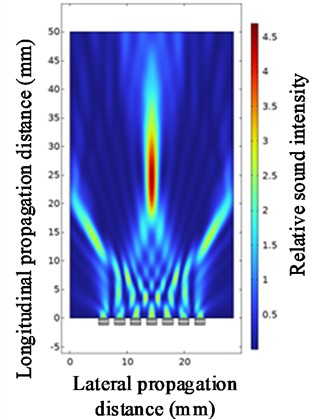
c) At a quantity of 7
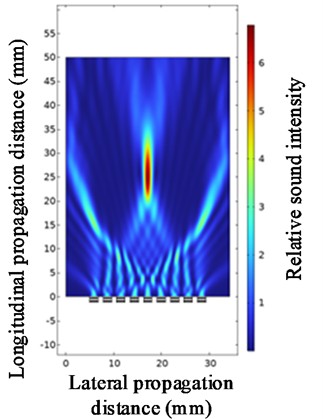
d) At a quantity of 9
4.3. The influence of the center frequency of the ultrasonic transducer on beam focusing
Fig. 12 illustrates the focusing effect of ultrasonic beams at selected center frequencies. Data were extracted from the figure, ultimately yielding parameter values for different ultrasonic transducer center frequencies.
Table 6Values of each parameter for different number of ultrasonic transducers
Quantities | Relative sound intensity | Longitudinal distance of focusing point |
1 | 2.96 | 0.51 |
2 | 1.74 | 4.01 |
3 | 3.41 | 0.77 |
4 | 2.17 | 12.92 |
5 | 2.91 | 21.28 |
6 | 3.78 | 22.82 |
7 | 4.70 | 24.36 |
8 | 5.71 | 25.13 |
9 | 6.79 | 24.62 |
10 | 8.03 | 25.13 |
Fig. 11Line graph of variation of values of each parameter for different number of ultrasonic transducers
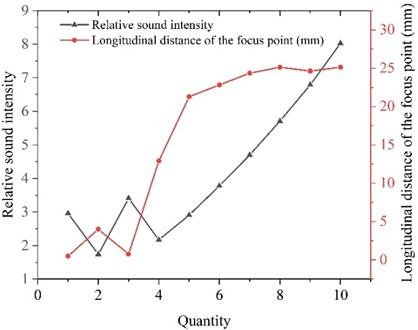
Table 7 presents the values of various parameters at different center frequencies of ultrasonic transducers. By plotting the data from Table 7, we can obtain line graphs illustrating the variation of these parameters across different center frequencies.
Table 7Values of each parameter at different ultrasonic transducer center frequencies
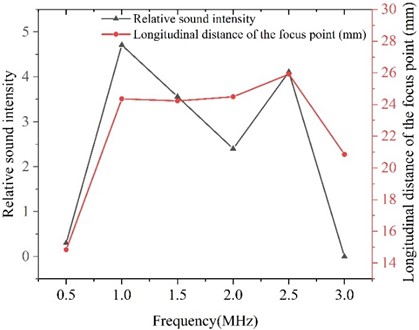
Center frequency (MHz) | Relative sound intensity | Longitudinal distance of focusing point (mm) |
0.5 | 0.30 | 14.84 |
1.0 | 4.71 | 24.36 |
1.5 | 3.56 | 24.23 |
2.0 | 2.4 | 24.49 |
2.5 | 4.11 | 25.92 |
3.0 | 0.0005 | 20.86 |
Under fixed parameter conditions (array element spacing = 0.8, array element number = 7, focusing distance = 25), the influence of the center frequency of the ultrasonic transducer on the beam focusing effect was studied. Fig. 13 is a line graph of the changes in the values of each parameter at different center frequencies of the ultrasonic transducer. As shown in Fig. 13, when the center frequency is 1.0 to 2.5 MHz, the focusing distance is not much different from the setting, and at 1.0 MHz, the relative sound intensity reaches the maximum. When other parameters are constant, although the increase in the center frequency of the ultrasonic transducer can significantly reduce the beam width of the main lobe, it will simultaneously cause an increase in the number of side lobes and an enhancement of the relative sound pressure level. These factors will lead to significant side lobe interference to the main lobe signal.
Fig. 12Ultrasonic beam focusing diagrams with the center frequency of 1 MHz, 2 MHz, and 3 MHz
a) At a center frequency of 1 MHz
b) At a center frequency of 2 MHz
c) At a center frequency of 3 MHz
Fig. 13Line graph of variation of values of each parameter at different ultrasonic transducer center frequencies
5. Discussion
This paper primarily investigates the effects of piezoelectric material thickness, width, array element spacing, and quantity on the performance of flexible ultrasonic transducer arrays. The physical mechanisms by which these parameters influence device performance are as follows.
The thickness of piezoelectric materials primarily affects their resonant frequency. Under the influence of an alternating electric field, piezoelectric elements undergo compressional and tensional vibrations along their thickness, exhibiting a vibration mode similar to a rod with free ends. According to wave theory, the fundamental resonant frequency is determined by both the longitudinal sound velocity of the acoustic wave propagating through the matrix and the material thickness, this is the half-wavelength resonance principle. Resonance occurs when the thickness of the piezoelectric element equals half the wavelength of the acoustic wave. Thinner materials exhibit higher resonant frequencies. Consequently, piezoelectric elements in transducers for high-frequency superficial imaging are extremely thin, while those in low-frequency transducers designed for deep penetration are relatively thicker.
The width of piezoelectric elements primarily influences their acoustic beam divergence angle. A single element can typically be regarded as an acoustic source, whose far-field directional pattern is determined by its width dimension. A larger width results in a smaller divergence angle of the acoustic beam in the plane of the array, concentrating more energy. The element width directly determines the thickness of the acoustic slice. A larger width results in a narrower acoustic beam, enabling thinner imaging layers and higher resolution. However, when the width approaches or exceeds the thickness, the element may exhibit unwanted lateral vibration modes in addition to its thickness-direction vibration. These stray vibrations can couple with the primary thickness vibration, reducing electromechanical coupling efficiency.
The array element spacing determines the occurrence of sidelobes. Array element spacing refers to the distance between the centers of adjacent elements. According to the sampling theorem, to avoid generating sidelobes in space, the array element spacing must be less than half the wavelength of ultrasound in the medium. If the spacing is too large, lobs will form; smaller spacing better suppresses lobs. However, larger spacing reduces the array's bending stiffness, making it easier to conform to complex curved surfaces of the human body or industrial equipment.
The number of array elements directly determines the total aperture size of the array. According to diffractive optics theory, a larger aperture yields stronger focusing capability and higher lateral resolution. More elements can synthesize a larger effective aperture, and more elements mean more independent control units during transmission and reception. This enables the beamformer to more precisely control the deflection and focusing of the acoustic beam, effectively suppressing sidelobes.
In summary, the design of flexible ultrasonic transducer arrays requires balancing various parameters to achieve optimal overall performance. Unlike machine learning optimization methods employed by other researchers, this study primarily utilizes finite element analysis software to provide a more intuitive and comprehensive demonstration of how each parameter affects performance under multi-physics coupling conditions. This offers valuable reference for advancing flexible ultrasonic technology from laboratory research to commercial applications. Future researchers may integrate finite element analysis software with machine learning, which I believe will enable more effective optimization of flexible ultrasonic transducer array structures.
6. Conclusions
In order to examine the impact of different parameters on the focusing performance of a flexible ultrasonic transducer array and to establish a foundation for determining the ideal structure of the array, this paper uses finite element multiphysics software to perform simulation analyses of the array’s various parameters.
For the purpose of to accomplish this, this paper first performs a simulation analysis of the primary parameters of a single-element ultrasonic transducer, such as the piezoelectric material's thickness and width, in order to examine their effects on the electromechanical coupling coefficient of the transducer. According to the results of the simulation, the electromechanical coupling coefficient of a single-element ultrasonic transducer shows a sinusoidal relationship with increasing width; the electromechanical coupling coefficient of the flexible ultrasonic transducer reaches its maximum value when the thickness of the piezoelectric material is 0.4.
The effects of transducer spacing, number, and center frequency on the focusing performance of the flexible ultrasonic transducer array were then examined by simulating the parameters of the flexible ultrasonic transducer array under the conditions of a single-element flexible ultrasonic transducer with a piezoelectric material width of 1.8 and a thickness of 0.4. According to simulation data, the optimum focusing performance occurs when the transducer spacing is narrower; when the number exceeds 4, the more transducers, the better the focusing performance; and the focusing performance is best at a central frequency of 1 MHz.
It should be emphasized that although the flexible ultrasonic transducer array’s focusing performance improves with wider spacing and more transducers, doing so not only raises the manufacturing cost of the flexible transducer array and reduces its flexibility, but it also significantly increases the requirements for manufacturing process precision. In order to satisfy real operating needs, parameters should be carefully chosen in practice depending on the usage environment and specifications.
Structural parameter sensitivity analysis conducted through flexible ultrasonic transducer linear arrays will provide critical quantitative guidance for the lifecycle of flexible ultrasonic transducers. At the design level, it precisely identifies core versus secondary parameters affecting device performance, revealing inherent trade-offs between different performance metrics. This empowers engineers to optimize design workflows and make evidence-based decisions. Regarding manufacturing costs, analysis results directly translate into scientific tolerance standards. These guide manufacturers to select high-precision processes for high-sensitivity parameters while relaxing requirements for low-sensitivity parameters to reduce costs, ultimately significantly improving production yield and product consistency. Regarding application performance, this analysis reliably predicts a device's final functionality, ensuring its effectiveness in real-world scenarios. It provides a robust data foundation for rapid, precise customization, offering valuable reference for advancing flexible ultrasound technology from laboratory research to commercial applications.
References
-
H. Hu et al., “A wearable cardiac ultrasound imager,” Nature, Vol. 613, No. 7945, pp. 667–675, Jan. 2023, https://doi.org/10.1038/s41586-022-05498-z
-
H. G. Jo et al., “Forward-looking ultrasound wearable scanner system for estimation of urinary bladder volume,” Sensors, Vol. 21, No. 16, p. 5445, Aug. 2021, https://doi.org/10.3390/s21165445
-
L. Zhang et al., “A conformable phased-array ultrasound patch for bladder volume monitoring,” Nature Electronics, Vol. 7, No. 1, pp. 77–90, Nov. 2023, https://doi.org/10.1038/s41928-023-01068-x
-
R. K. W. Vithanage et al., “A phased array ultrasound roller probe for automated in-process/interpass inspection of multipass welds,” IEEE Transactions on Industrial Electronics, Vol. 68, No. 12, pp. 12781–12790, Dec. 2021, https://doi.org/10.1109/tie.2020.3042112
-
M. E. Bajgholi, G. Rousseau, M. Viens, and D. Thibault, “Advanced ultrasonic inspection methodologies for fitness-for-service (F.F.S) assessment of hydraulic turbines,” The International Journal of Advanced Manufacturing Technology, Vol. 129, No. 5-6, pp. 2621–2633, Oct. 2023, https://doi.org/10.1007/s00170-023-12498-4
-
G. Kim, M.-K. Seo, Y.-I. Kim, S. Kwon, and K.-B. Kim, “Development of phased array ultrasonic system for detecting rail cracks,” Sensors and Actuators A: Physical, Vol. 311, p. 112086, Aug. 2020, https://doi.org/10.1016/j.sna.2020.112086
-
L. Posilović, D. Medak, M. Subašić, M. Budimir, and S. Lončarić, “Generative adversarial network with object detector discriminator for enhanced defect detection on ultrasonic B-scans,” Neurocomputing, Vol. 459, pp. 361–369, Oct. 2021, https://doi.org/10.1016/j.neucom.2021.06.094
-
Y. Tian, “Physical properties and applications of ultrasound,” (in Chinese), Modern Physical Knowledge, Vol. 23, No. 1, pp. 24–26, 1999.
-
S. Dong et al., “Research on performance simulation and structural optimization design of piezoelectric ultrasonic transducers,” (in Chinese), Xi’an University of Electronic Science and Technology, p. 003361, 2023, https://doi.org/10.27389/d.cnki.gxadu.2023.003361
-
X. Li et al., “Optimization design of ultrasonic transducer arrays based on genetic algorithms,” (in Chinese), Piezoelectricity and Acousto-Optics, Vol. 40, No. 4, pp. 529–533, 2018, https://doi.org/10.11977/j.issn.1004-2474.2018.04.013
-
Q. Yu et al., “Simulation and structural optimization of piezoelectric micro-electro-mechanical ultrasonic transducers,” (in Chinese), Piezoelectricity and Acousto-Optics, Vol. 44, No. 3, pp. 403–406, 2022, https://doi.org/10.11977/j.issn.1004-2474.2022.03.014
-
Z. Peng et al., “Study on the influence of element parameters on the acoustic field in phased array ultrasonic transducers,” (in Chinese), Optics and Optoelectronic Technology, Vol. 19, No. 2, pp. 25–33, 2021, https://doi.org/10.19519/j.cnki.1672-3392.2021.02.004
-
C. Wang, Piezoelectric Ferroelectric Physics. (in Chinese), Science Press, 2009.
-
K. Tonisch, V. Cimalla, C. Foerster, H. Romanus, O. Ambacher, and D. Dontsov, “Piezoelectric properties of polycrystalline AlN thin films for MEMS application,” Sensors and Actuators A: Physical, Vol. 132, No. 2, pp. 658–663, Nov. 2006, https://doi.org/10.1016/j.sna.2006.03.001
-
H. F. Tiersten, “Electrostatic interactions and the piezoelectric equations,” The Journal of the Acoustical Society of America, Vol. 68, No. S1, pp. S40–S40, Nov. 1980, https://doi.org/10.1121/1.2004716
-
J. Yao, Z. Y. Zhu, and H. Wang, “Piezoelectric equation and two types of piezoelectric sensors model,” Advanced Materials Research, Vol. 291-294, pp. 2021–2026, Jul. 2011, https://doi.org/10.4028/www.scientific.net/amr.291-294.2021
-
G. G. Yaralioglu, A. S. Ergun, B. Bayram, E. Haeggstrom, and B. T. Khuri-Yakub, “Calculation and measurement of electromechanical coupling coefficient of capacitive micromachined ultrasonic transducers,” IEEE Transactions on Ultrasonics, Ferroelectrics and Frequency Control, Vol. 50, No. 4, pp. 449–456, Apr. 2003, https://doi.org/10.1109/tuffc.2003.1197968
-
X. Bao, “Research on phased array ultrasonic detection system and its key technology,” (in Chinese), Tsinghua University, PhD dissertation, 2003.
-
Q. Xu and H. Wang, “Sound field modeling method and key imaging technology of an ultrasonic phased array: a review,” Applied Sciences, Vol. 12, No. 16, p. 7962, Aug. 2022, https://doi.org/10.3390/app12167962
-
S. Jin et al., “Development and application of ultrasonic phased array inspection technology,” (in Chinese), Journal of Electronic Measurement and Instrumentation, Vol. 28, No. 9, pp. 925–934, 2014, https://doi.org/10.13382/j.jemi.2014.09.001
-
S. S. Bhavikatti, Finite Element Analysis. New Age International, 2005.
-
B. Szabo and I. Babuska, Finite Element Analysis. Wiley, 2021, https://doi.org/10.1002/9781119426479
-
K. B. Ocheltree and L. A. Frizzel, “Sound field calculation for rectangular sources,” IEEE Transactions on Ultrasonics, Ferroelectrics and Frequency Control, Vol. 36, No. 2, pp. 242–248, Mar. 1989, https://doi.org/10.1109/58.19157
-
Y. Lin, J. M. Dodson, J. D. Hamilton, J.-U. A. Kluiwstra, C. Cain, and K. Grosh, “Theory and experiment for the design of piezoelectric element for phased arrays,” in IEEE Ultrasonics Symposium an International Symposium, Vol. 2, pp. 1697–1700, Oct. 2024, https://doi.org/10.1109/ultsym.1997.663337
-
L. Azar, Y. Shi, and S.-C. Wooh, “Beam focusing behavior of linear phased arrays,” NDT and E International, Vol. 33, No. 3, pp. 189–198, Apr. 2000, https://doi.org/10.1016/s0963-8695(99)00043-2
About this article

The authors have not disclosed any funding.
The datasets generated during and/or analyzed during the current study are available from the corresponding author on reasonable request.
Yongbin Du: conceptualization, methodology, writing-review and editing, supervision, project administration and funding acquisition. Yuanhai Zhao: conceptualization, methodology, software, writing-original draft preparation, writing-review and editing. Hengyu Wang: software, writing-review and editing. Kunwang Sun: validation, formal analysis, data curation. Yi Zhang: validation, formal analysis, investigation. Shunli Wang: conceptualization, methodology, project administration and funding acquisition.
The authors declare that they have no conflict of interest.
