Abstract
To ensure the purity of molten steel and maintain the continuity of casting, the slag detection utilizing vibration signals has been widely applied in the continuous casting. Due to the non-stationary and non-linear flow behavior of molten steel, it is hard to construct a reliable criterion to identify the slag entrapment from the vibration signals. In this paper, a numerical simulation model is built to reveal the flow process of molten steel draining from a ladle. By the analysis of the volume fraction, path line and velocity field, the flow state at the moment of slag outflowing is captured. According to the simulated results, a method based on the manifold learning is proposed to deal with the vibration signals. Firstly, the non-stationary vibration signals are decomposed into sub-bands by the continuous wavelet transform and the energy of the signal component at each wavelet scale is calculated to constitute the high dimensional feature space. Then, a manifold learning algorithm called local target space alignment (LTSA) is employed to extract the non-linear principal manifold of the feature space. Finally, the abnormal spectral energy distribution caused by slag entrapment is indicated by the one-dimensional principal manifold. The proposed method is evaluated by the vibration acceleration signals acquired from a steel ladle of 60 tons. Results show that the slag entrapment is exactly and timely identified.
1. Introduction
In the process of continuous casting, the molten steel is firstly stored in a ladle, then flowed into a tundish through the controlled nozzle, and finally entered into the mold for continuous solidification. It is a critical and dangerous operation that the molten steel drains from a ladle. In the ladle, a layer of slag, which is mainly composed of nonmetal oxides, always floats on the top of molten steel. In most time of the molten steel draining, the slag layer is steady floating and prevents molten steel from oxidizing. However, while the molten steel has decreased below a certain level, the interface between the steel and the slag becomes unsteady and a vortex, which appears on the top of the liquid surface and extends to the nozzle, may be formed. Then, the slag would invade into the tundish and mix with the molten steel. This phenomenon has a bad influence on the steels compositions and causes the slag inclusion in steel products. Therefore, it is significant for production of clean steel that monitoring the process of molten steel draining from the ladle. Many attempts have been made to differentiate slag entrapment from pure molten steel [1-4], such as vibration analysis, electromagnetic induction [3], infrared thermography [4], etc. Due to the sensitivity to vortex and the ease of implementation, the vibration analysis receives the most attention in the research and application of slag detection.
The vibration of molten steel draining from a ladle is induced by the flow of complex fluid mixture. Therefore, it is necessary to build the simulation model for uncovering the fluid flow process [5-9]. Sahai et al. [6] constructed the instantaneous velocity fields of melt flow to offer information for casting control. Davila et al. [7] studied the turbulence model of the steel draining under isothermal and nonisothermal conditions to estimate the bath level, in which a vortex would be formed and developed. Although the purposes of existing models were the improvement of casting device and the casting process optimization, the simulation model can also help to provide guidance for vibration analysis.
Generally, vibration signals are acquired from the operation arm connecting with the nozzle. Due to the long transfer path of vibration and the strong influence of working circumstance, the vibration signals are contaminated by the unexpected noises generated from various interfering source. Many intelligent methods, such as hidden Markov model [10], vector quantization [11] and radial basis function neural network [12], have been used to identify the features of slag entrapment in vibration signals. However, the generalization of these intelligent methods is still not satisfying. In essence, the vibration signals of molten steel are non-stationary signals induced by the non-linear dynamic behavior of flow. Under the disturbances of initial condition and noises, it is hard to establish a common criterion for identifying slag with limited experimental data. In this case, non-linear feature extraction methods such as manifold learning [13-16] can be used to deal with the vibration signals and recognize the change of flow state caused by slag entrapment.
In this paper, we build a numerical simulation model to display the volume fraction, path line and velocity field of molten steel draining from a ladle. The non-linear and non-stationary flow behavior at the moment of slag outflowing is captured. According to simulated results, a processing method combining wavelet decomposition and manifold learning is proposed and applied in vibration signal analysis. Thereinto, the wavelet transform is used to decompose the non-stationary vibration signals. The high dimensional feature space is constituted by the signal energy at each wavelet scale. Then, a manifold learning algorithm called local target space alignment (LTSA) is employed to extract the low dimensional principal manifold of the feature space. With dimension reduction, the non-linear structures between the feature vectors are well retained. Experiments verified that one-dimensional principal manifold can indicate the outflow of slag.
The paper is organized as follows. We briefly describe the mechanical structure of casting device and the acquisition of the vibration signals in the next section. In section 3, the numerical simulation model of molten steel draining from a ladle is constructed to direct the vibration analysis. The method for vibration signal processing is proposed in section 4. An actual application case is provided to illustrate the effectiveness of the proposed method in section 5. Finally, the conclusions are given in section 6.
2. Vibration detection of molten steel draining from a ladle
The continuous casting device, as shown in Fig. 1, consists of ladle, nozzle, operation arm, tundish and mold. The tundish and mold are fixed in the production line and obtain molten steel from the transfer ladle. The submerged nozzle connects the ladle and tundish, and is manually adjusted by operation arm to control the molten steel flow. The slag, which is generated in the ladle, floats on the top of molten steel due to the low mass density. To prevent the pollution of molten steel and maintain continuous casting, the slag invading to the tundish should be minimized and ideally avoided.
In some continuous casting workshops, operators can recognize the slag flowing through the nozzle by feeling the vibrations of operation arm. This manual detection is the origin of modern vibration detection with sensors. However, the disadvantages of manual detection are low sensitivity and huge time delay. Furthermore, it may cause the fatigue of operators and lead to wrong judgement. Consequently, vibration sensors are ideal alternative to monitor the fluid flow of molten steel continuously. Usually, sensors are located on the operation arm instead of the nozzle to avoid heat damage. To remove the noise and automatically identify the slag outflowing, an appropriate processing method for measured vibration signals is essential.
3. Numerical simulation of molten steel draining from a ladle
The basic procedure of numerical simulation for fluid dynamics can be summarized as follows. The geometry model of analyzed object, i.e. physical bounds of fluid, is defined. Then, the volume occupied by the fluid is divided into discrete cells. According to some physical criterions, the equations of relation between the cells are established. Under the given boundary conditions, the equations are solved iteratively. Finally, a postprocessor is used for the analysis and visualization of the resulting solution. For simulating the process of molten steel draining from a ladle, the commercial fluid dynamics package, FLUENT (FLUENT Inc., Lebanon, NH), is applied to implement the above procedures.
According to the geometric dimensions of an actual ladle, the physical bounds of molten steel are modeled as shown in Fig. 2. The quadrilateral mesh is used to divide the fluid field. Because of the dramatic changes of flow state near the nozzle, the mesh near the nozzle is denser than other zones.
Fig. 1Continuous casting device and its vibration detection
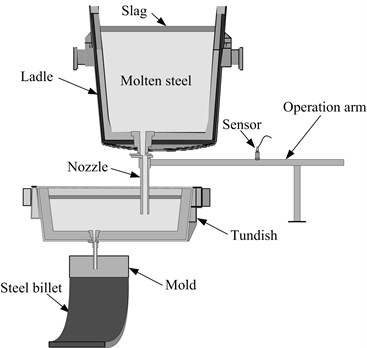
Fig. 2Computational mesh of the ladle

In the ladle, molten steel, slag and air exist as liquid phase, solid phase and gas phase, respectively. Since the slag floats on the top of molten steel, the air is isolated from the molten steel and only contacts with the slag. In this case, two interfaces, steel-slag interface and slag-air interface, should be considered. It is assumed that there are no conversions or fusions among three phases during the ladle drain operations. The volume of fluid (VOF) multiphase model, which has proved to be the most reliable and efficient model for interface analysis [7], is used to trace the dynamic positions of the fluid interfaces. For the computational cells at steel-slag interface, there is a constraint , where and are the volume fractions of the liquid steel phase and the solid slag phase, respectively. The physical properties are blended according to the volume fractions of each phase in the flow field. For example, the density and viscosity of steel-slag interface are calculated as:
The same principles are also applied at the slag-air interface. In the simulation, the volume fractions of three phases in each computational cell are continuously calculated, and then the dynamic behavior of single phase and interface can be traced with a unified way.
While the molten steel drains through a narrow nozzle at high flow rate, turbulence flow, which is characterized by chaotic and stochastic, would be emerged. To make the simulation close to the real situation, the shear stress transport (SST) - model [17] is used to simulate the turbulence flow in the molten steel draining. In this model, the effect of the transport of the principal shear stress flow is added to the turbulence viscosity equation, and a function blending - model and k- model is used to ensure that the model equations behave appropriately both near the ladle walls and in the inner regions of fluid. The algorithms of SST - model has embodied in the FLUENT, so it is just selected in the simulation.
The model equations are solved by the algorithm of pressure implicit with splitting of operators (PISO). The stop criterion of iteration is that the sum of all residuals for the dependent variables is less then 10-3. By FLUENT, the numerical solutions are obtained and displayed as animated images. Fig. 3(a) shows the contours of the volume fraction at the moment of slag outflowing. The blue region is the air phase, the red region is the liquid steel and the region between them is the solid slag. It can be seen that the slag floating on the molten steel is entrapped into the nozzle while a number of molten steel is still remained. The path lines of flow at the same time are shown in Fig. 3(b). The spiraling path lines can be clearly observed above the nozzle. It means that the vortex has been formed and transported the slag from liquid surface to the outlet.
Fig. 3Simulation results at the moment of slag outflowing: a) contours of the volume fraction, b) path lines
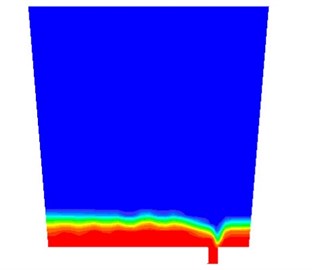
a)
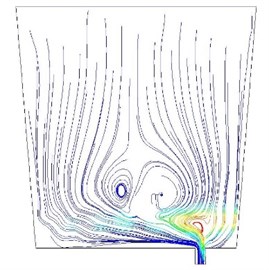
b)
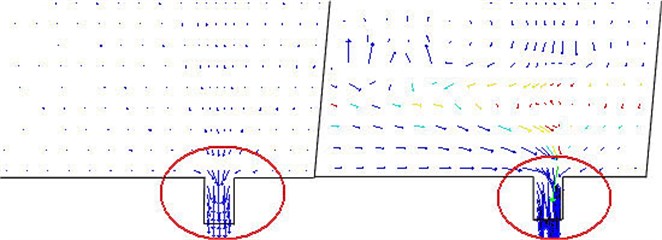
The vibration is caused by the flush of fluid mixture to the nozzle. Therefore, the velocity field of fluid is established to analyze the flush behavior. Fig. 4 shows the velocity field comparison of pure molten steel and slag entrapment. While the pure molten steel flows through the nozzle, the velocity vectors in nozzle are in order and parallel with the wall of nozzle. Once the slag is entrapped by the vortex, the velocity vectors become chaotic. A mass of vectors point to the ladle walls and the magnitudes of vector are changed with the flow position. Then, the abnormal vibration would be induced by the chaotic velocity field.
According to the simulated results, the conclusions can be drawn as follows:
(a) Due to the effect of vortex, the slag would outflow before the molten steel drains away. The formation of vortex is influenced by a lot of uncertain factors, such as the temperature of molten steel, the open degree of nozzle, the composition of molten steel and the standstill times of ladle. Therefore, the slag entrapment cannot be avoided just by the simulation. The vibration monitoring should be a good choice for producing spot of continuous casting.
(b) The fluid flow of slag entrapment is chaotic and stochastic. By the flush of unsteady flow, the vibration response changes from stationary to non-stationary. Due to the non-linearity of flow state, the non-linear feature of vibration signals should be extracted and used to identify the anomaly.
Fig. 4Velocity field comparison of pure molten steel and slag entrapment
4. Vibration signals processing
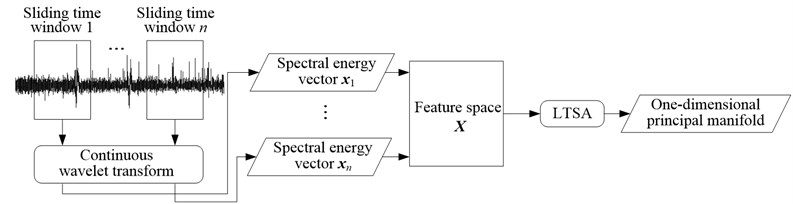
To detect the slag entrapment from the vibration signals, we proposed a signal processing method based on the manifold learning. Firstly, spectral energy distributions of vibration signals are obtained by continuous wavelet transform to construct the high dimensional feature space. Then, a manifold learning algorithm, i.e. LTSA, is used to extract the one-dimensional principal manifold from the high dimensional feature space. The non-linear dynamic behavior of fluid flow can be captured by the one-dimensional principal manifold curves.
4.1. Manifold learning
The manifold learning is a method that maps the high dimensional feature into a reduced subspace to fuse the multiple feature information. The “manifold” is defined as a nonlinear surface embedded in high dimensional space along which dissimilarities between data points are best represented. In real world applications, many complex objects, such as images and spectral energy distribution, can be described by feature points in a high dimensional vector space. To detect the outliers in high dimensional feature space, a proper low dimensional projection of high dimensional space is necessary. The manifold learning has been proved to be the most reliable method for reducing non-linear high dimensional features. Consequently, it is used to process the feature vectors of vibration signals.
Suppose a -dimensional feature space where is the number of feature vectors. A -dimensional manifold embedded in the feature space can be described as:
where is the low dimensional feature subspace of and is the noise. With , the dimensionality reduction of the feature vectors is realized. The manifold represents the embedding coordinates along the principal eigenvectors of in -dimensional embedding space.
Many algorithms have been develop to implement manifold learning, such as isometric mapping (Isomap) [13], locally linear embedding (LLE) [14] and local target space alignment (LTSA) [18]. Due to the advantage of noise immunity, LTSA is now widely applied in non-linear dimensionality reduction. The basic idea of LTSA is to construct a local tangent space in the neighborhood of each feature vector, and obtain the global low dimensional embedding through affine transformation of the local tangent spaces. Firstly, locally linear neighborhood mappings of all data points are established. For each feature vector find its -nearest neighbors matrix in Euclidean space. Then the local geometry coordinate around is computed by the singular value decomposition (SVD) as:
where is the all ones vector with length of , is the largest singular values of , and are the matrices of the corresponding left and right singular vectors, respectively. The local alignment matrix of is calculated by partially summing as following:
where is the set of indices for the -nearest neighbors of , , is the identity matrix, and the initial is 0. Finally, the low dimensional embedding vectors is obtained by calculation of the th eigenvectors of alignment matrix corresponding to the 2nd to smallest eigenvalues.
By the manifold learning, the non-linear structures between the feature vectors in are unfolded and displayed in low dimensional subspace. In the next section, the algorithm of LTSA is applied to identify the abnormal spectral energy caused by slag entrapment.
4.2. Signal processing method
The methodology for detecting slag entrapment from vibration signals is illustrated in Fig. 5. With a sliding time window, the segments of vibration signals are selected in chronological order. The continuous wavelet transform is used to decompose the signal segments into different spectral bands. The energy of the signal component at each wavelet scale is calculated and combined as the spectral energy vector , in which is determined by the number of wavelet scales. While the time window is sliding, the spectral energy vectors are continuously calculated and constitute the feature space with the form of a matrix with rows. By LTSA, one-dimensional principal manifold curves of is obtained and used to indicate slag entrapment.
Fig. 5Flowchart of processing method for vibration signals
According to the simulated results and practical experiences, there exists an intrinsic change of spectral energy distributions in the vibration signals while the slag outflows. The abnormal change has no regular mode and varies with casting conditions. In the high dimensional feature space, the anomaly is hard to identify. Therefore, the LTSA algorithm is used to reduce the dimensionality of the original feature space on the precondition that non-linear structures between the feature vectors is still kept. The one-dimensional representation of the feature space is suitable for identifying the anomaly caused by slag entrapment.
Once a great batch of vibration signals is acquired during the process of molten steel draining from the ladle, LTSA cannot be efficiently applied due to the high computation cost. In this case, an incremental LTSA algorithm is highly necessary. The incremental algorithm works in three steps. First, the k-nearest neighbors are adjusted according to the new coming spectral energy vectors . If is closer to an existing point than its -nearest neighbor, will replace the neighbor point in the neighborhood of . Second, the local geometry coordinates and local alignment matrix of the adjusted neighbors are calculated from Eq. 5 and 6, respectively. In the third step, by the subspace iteration with Rayleigh-Ritz acceleration for calculation of eigenvalues and eigenvectors of updated alignment matrix [19], the new one-dimensional principal manifold values are obtained. Based on the incremental algorithm, the computation load is significantly reduced to catch up the pace of signal acquisition.
5. Case study
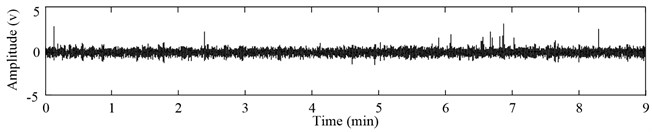
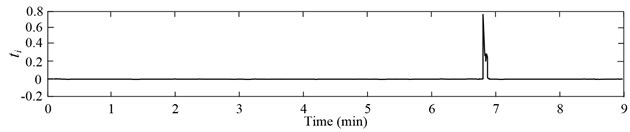
In this section, the proposed method is applied to detect the slag entrapment for a steel ladle of 60 tons. The vibration acceleration signals are acquired from the operation arm and the sampling frequency is set as 3000 Hz. The total draining process was last for about 40 minutes. The vibration signals at the last 9 minutes are shown in Fig. 6(a). The length and step size of sliding time window is set as 1 second and 0.1 second, respectively. Utilizing the Daubechies wavelet, the signals within each time window are decomposed into the scales of 1 to 20. The normalized energy at each wavelet scale constitutes a 1 by 20 spectral energy vector. Some spectral energy vectors at different time are listed in Table 1. Due to the high dimensions, it is hard to evaluate the change degree of spectral energy distribution clearly. The feature space composed of the sequential spectral energy vectors is processed by the incremental LTSA algorithm. As 10, the one-dimensional principal manifold is obtained and shown in Fig. 6(b). To facilitate observation, the horizontal ordinate is replaced by the corresponding time. At 6 minutes and 47.2 seconds, a sharp peak is appeared in the manifold curves. The value of principal manifold increased dramatically from near zero to 0.6910. In practice, the nozzle is closed at nine minutes according to the manual detection results of an experienced operator. However, a little slag had entrapped into the nozzle and been observed in the molten steel surface of tundish. It is verified that our method can exactly identify the slag entrapment and be prior to the manual detection.
Fig. 6Slag detection: a) vibration acceleration signals, b) one-dimensional principal manifold
a)
b)
Table 1Spectral energy vector and corresponding one-dimensional principal manifold
Time | Spectral energy vector (×103) | |
0.1 sec | [0.05, 0.08, 0.11, 0.17, 0.72, 4.43, 17.54, 43.40, 73.72, 96.47, 109.24, 115.45, 116.09, 110.26, 97.50, 79.31, 58.65, 39.19, 23.87, 13.74] | -0.0007 |
1 min | [0.03, 0.01, 0.03, 0.09, 0.65, 4.37, 17.57, 43.56, 73.93, 96.65, 109.40, 115.58, 116.19, 110.29, 97.44, 79.17, 58.49, 39.04, 23.80, 13.70] | -0.0120 |
3 min | [0.03, 0.01, 0.03, 0.12, 0.79, 4.94, 19.13, 46.14, 76.59, 98.65, 110.88, 116.66, 116.64, 109.79, 95.92, 76.87, 55.88, 36.66, 21.93, 12.33] | -0.0031 |
5 min | [0.03, 0.01, 0.05, 0.12, 0.70, 4.65, 18.50, 45.12, 75.46, 97.69, 110.17, 116.19, 116.47, 109.96, 96.41, 77.62, 56.78, 37.62, 22.96, 13.49] | -0.0025 |
6 min 47.2 sec | [0.15, 0.30, 0.48, 0.67, 1.21, 4.83, 17.31, 41.50, 69.54, 90.70, 103.11, 109.78, 111.35, 106.91, 96.04, 80.36, 62.49, 45.84, 32.93, 24.50] | 0.6910 |
6 min 47.3 sec | [0.12, 0.23, 0.39, 0.53, 1.05, 4.68, 17.37, 41.97, 70.53, 92.03, 104.67, 111.42, 112.92, 108.13, 96.66, 80.09, 61.35, 43.87, 30.39, 21.59] | 0.4696 |
6 min 47.4 sec | [0.11, 0.20, 0.34, 0.47, 1.00, 4.78, 17.95, 43.35, 72.47, 93.96, 106.28, 112.59, 113.53, 108.11, 96.02, 78.89, 59.74, 42.04, 28.47, 19.70] | 0.2495 |
6. Conclusion
The prevention of slag invading into the tundish is essential for the production of clean steel. In this paper, the non-stationary and non-linear flow behavior of molten steel is analyzed by a numerical simulation model. The vibration signals acquired from the operation arm inherit the non-stationary and non-linear property. Therefore, a method combing wavelet decomposition and manifold learning is used to process the vibration signals. With the sliding time window and the incremental LTSA algorithm, the low dimensional principal manifold of the spectral energy feature space is extracted continuously. The one-dimensional principal manifold is chosen as the indicator of abnormal spectral energy distribution. The method is validated with a practical case, and the result shows that the slag entrapment is exactly and timely identified.
However, several problems still need consideration. The detection effect of our method still depends on the parameters of sliding time window. If more information of vibration response can be provided by the numerical simulation model, the parameter choice would be more reasonable. Moreover, the threshold of one-dimensional principal manifold curve should be optimized to achieve the automatic decision for casting control. These are our research work in the near future.
References
-
K. W. Ng, R. Harris Fluid slag skimming from steel ladles. ISIJ International, Vol. 41, Issue 5, 2001, p. 422-425.
-
Lifeng Zhang, Brian G. Thomas State of the art in evaluation and control of steel cleanliness. ISIJ International, Vol. 43, Issue 3, 2003, p. 271-291.
-
Julius E., Theissen W., Block F. R. Function and application of electromagnetic slag detection system. World Steel & Metalworking, Vol. 8, Issue 1, 1987, p. 56-61.
-
M. Viale, O. Martin, F. Muratori, U. Bertezzolo, J. Perez, C. Partemio, J. Usart Application of no-line infrared thermography in steel making industry. Proc. of SPIE, Vol. 6541, 2007, p. 1-11.
-
Brain G. Thomas, Lifeng Zhang Mathematical modeling of fluid flow in continuous casting. ISIJ International, Vol. 41, Issue 10, 2001, p. 1181-1193.
-
Yogeshwar Sahai, Toshihiko Emi Criteria for water modeling of melt flow and inclusion removal in continuous casting tundishes. ISIJ International, Vol. 36, Issue 9, 1996, p. 1166-1173.
-
O. Davila, R. D. Morales, L. G. Demedices Mathematical simulation of fluid dynamics during steel draining operations from a ladle. Metallurgical and Materials Transactions B, Vol. 37, Issue 2, 2006, p. 71-87.
-
J. Strandh, K. Nakajuma, R. Eriksson, P. Jönsson A mathematical model to study liquid inclusion behavior at the steel-slag interface. ISIJ International, Vol. 45, Issue 12, 2005, p. 1838-1847.
-
A. R. Banderas, R. S. Perez, R. D. Morales, J. P. Ramos, L. D. Garcia, M. D. Cruz Mathematical simulation and physical modeling of unsteady fluid flows in a water model of a slab mold. Metallurgical and Materials Transactions B, Vol. 35, Issue 6, 2004, p. 449-460.
-
Dapeng Tan, Peiyu Li, Xiaohong Pan Application of improved HMM algorithm in slag detection system. Journal of Iron and Steel Research International, Vol. 16, Issue 1, 2009, p. 1-6.
-
Dapeng Tan, Peiyu Li, Guochun Yao, Duanyang Liu Steel water continuous casting slag detection system based on VQ. IEEE International Conference on Systems, Man and Cybernetics, Vol. 2, 2006, p. 1315-1319.
-
Lu Tian, Yujun Huang, Huangqi Cai Slag detection system based on vibration using chaos and nerve cell theory. Proceeding of the 4th International Conference on Continuous Casting of Steel in Developing Countries, 2008, p. 637-642.
-
Joshua B. T., Vin D. S., John C. L. A global geometric framework for nonlinear dimensionality reduction. Science, Vol. 290, Issue 5500, 2000, p. 2319-2323.
-
Sam T. R., Lawrence K. S. Nonlinear dimensionality reduction by locally linear embedding. Science, Vol. 290, Issue 5500, 2000, p. 2323-2326.
-
Qing Zhang, Jing Wang, Guanghua Xu A new density estimation neural network to detect abnormal condition in streaming data. Journal of Vibroengineering, Vol. 14, Issue 2, 2012, p. 621-632.
-
Yizhuo Zhang, Guanghua Xu, Jing Wang, Lin Liang An automatic patient-specific seizure onset detection method in intracranial EEG based on incremental nonlinear dimensionality reduction. Computer in Biology and Medicine, Vol. 40, Issue 11, 2010, p. 889-899.
-
F. R. Menter Two-equation eddy-viscosity turbulence models for engineering applications. AIAA Journal, Vol. 32, Issue 8, 1994, p. 1598-1605.
-
Zhenyue Zhang, Hongyuan Zha Principal manifold and nonlinear dimension reduction via local tangent space alignment. SIAM Science Computing, Vol. 26, Issue 1, 2004, p. 313-338.
-
Xiaoming Liu, Jianwei Yin, Zhilin Feng, Jinxiang Dong Incremental manifold learning via tangent space alignment. Artificial Neural Networks in Pattern Recognition, Vol. 4087, 2006, p. 107-121.
About this article

This work was supported by the National Natural Science Foundation of P. R. China (approval No. 51005174) and Science & Technology Plan Project of Shaanxi, China (approval No. 2009K09-04).
