Abstract
This paper presents an innovative solution for the auto healing porous structures damaged by cyclic freeze-thaw, followed by predicting the results of recovered damage due to freezing based on Bayesian inference. The additional hydration of high strength material, cured in high temperature, is applied as auto curing for the damaged micro-pore structures. Modeling of micro pore structure is prior to damage analysis. The amount of ice volume with temperature dependent surface tensions, freezing pressure and resulting deformations, and cycle and temperature dependent pore volume has been predicted and compared with available test results. By heating the selected area of specimen in frozen chamber, approximately 100 % of strength recovery has been observed after 10 days of freeze-thaw tests in the proposed nonlinear stochastic prediction models and the experimental results.
1. Introduction
The most important design parameters concerning the cyclic freeze-thaw are the distribution of micro-pores and the saturation of pores, which depend on the freezing expansion pressure as a function of temperature, developed in computational programs by Cho [1]. In this study a probabilistic prediction model has been proposed for the damaged porous material by cyclic freeze-thaw, which is verified in the experiments. The previous researches regarding stochastic modeling for the deterioration of structural components and a system have the following limitations [2-4]: 1) little effort has been focused to identify future failure but past cause or result of failure, 2) important design variables, which affect significantly system response, are subjectively determined, 3) consequently, the evaluation results may have limitations for predicting future degradation with full modeling of field variables, consisting of highly correlated composite elements. In highly correlated system models, specifically given the parameters are of multiple dimensions, it is often impossible to present the marginal distribution of each parameter analytically. In this research the mentioned limitations have been reduced appreciably by modeling uncertainty. This paper is organized as follows. In second section, freeze-thaw damage and auto healing in concrete are given. In third section, Bayesian hierarchical model for correlated data is presented. Healed strength is predicted, compared with experimental results are also presented in fourth section. Finally our work of this paper is summarized in the last section.
2. Freeze-thaw damage and auto healing in concrete
Hydration and micro structural information are obtained from the analysis results of DuCOM [5]. In DuCOM, for the hydration model, multi-component chemical reactions and compounds have been considered as input data. Based on solidification theory, the reactants, mainly cement, aggregate and water, produce C-S-H gel structures, as modeled schematically in a cluster at Fig. 1, showing that the solidification process of cement paste is idealized by the formation of finite age-independent structural elements called clusters.
Fig. 1The schematic representation of hydration solidification
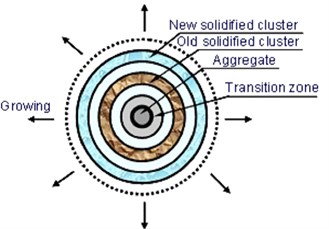
The aging process of cement paste is represented by the solidification of new cluster. As hydration proceeds, number of clusters increases (Fig. 2). Fagerlund [6], Penttala [7] and Cho [8] reported that the concrete structure damaged by cyclic freeze-thaw is affected by two parametric categories, material and load parameters.
Fig. 2The number of clusters increases as hydration proceeds
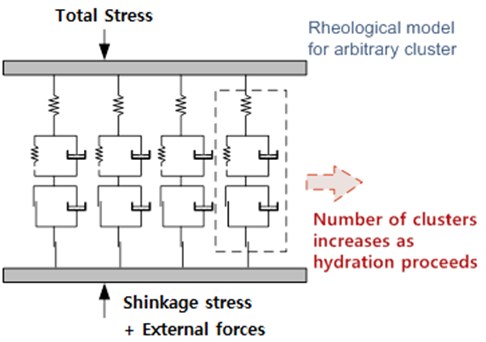
Fig. 3Structural degradation by the cyclic freeze-thaw, with the increase of saturation and degradation of entrained air
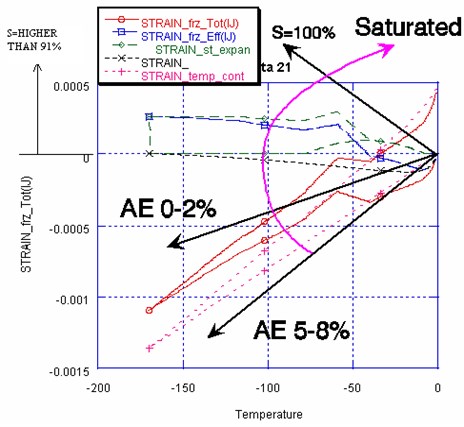
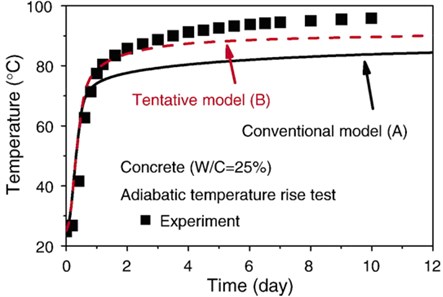
The material parameters are water to cement ratio (W/C), entrained air pores, mix ratio, hydration, and the concentration of chloride ions, shown in Fig. 3. Recently Nakarai et al. proposed an enhanced model that added a part of the moisture in the inter-hydrate pores to the free water and considered the change of adsorbed water associated with relative humidity (Model B) to explain the continuous hydration process of low W/C concrete under adiabatic temperature conditions (Fig. 4). The large temperature rise was predicted by considering the increase in the amount of free water for hydration [9].
Fig. 4Hydration process under adiabatic temperature condition in terms of auto-healing
3. Bayesian hierarchical model for correlated data
3.1. Hierarchical modeling
Bayesian hierarchical modeling has the following marginal likelihood, when data have not been observed yet:
which is the likelihood averaged over all parameter values supported by our prior beliefs, where is called prior predictive distribution.
The posterior predictive distribution is given by:
which is the likelihood of the future data averaged over the posterior distribution [10].
This distribution is termed as the predictive distribution since prediction is usually attempted only after observation of a set of data . Future observations can be alternatively viewed as additional parameters under estimation. From this perspective, the joint posterior distribution is now given by . The Markov Chain Monte Carlo (MCMC) method is used to obtain this posterior distribution from which the inputed values for missing observations or future predicted data are drawn. Inference on the future observations can be based on the marginal posterior distribution by integrating out all nuisance parameters . Hence the predictive distribution is given by resulting in (4) since past and future observables, and , are conditionally independent given the parameter vector .
3.2. Comparison of prediction by linear and quadratic model
Linear regression models are the most popular models in statistical sciences. In linear regression model, the response variable is considered to be a continuous random variable defined in the whole set of real numbers following the normal distribution. The following equation is selected:
where mean value of maintenance (duration of service). Due to the absence of a parameter representing correlation between and , standardizing the -s around their mean to reduce dependence between and in their likelihood is done, resulting in achieved complete independence. When component functions are correlated with each other and showing nonlinearity, problems could arise to predict future values by applying linear stochastic regression model. Due to their synergic or depending as causes and resultantly growing damages, in general deterioration of an infra-structure shows inelastic behavior.
The synergic effects have been evaluated in deterministic and probabilistic way, which revealed worse deterioration than linearly superposed. Therefore the following quadratic regression models are proposed, for which each dependent variable serves as the dependent variable and the other variables in the dataset serve as the independent variables:
The model parameter estimates are then used in making random draws from the multinomial distribution for each missing response on the dependent variable in the regression. The two stochastic regression models are compared for their fitness test in the next section.
4. Healed strength predicted, compared with experimental results
4.1. Parameters of experiments
The important factors for the damage by cyclic freeze-thaw are mix proportion, dimension, and cured condition. For deciding heat control and for identifying auto healing effect, the following parameters have been selected.
For the mix proportion, among the water to cement ratio of 25 %, 45 % and 75 %, 25 % ratio (W1) has been used with the 0 % (A1) of entrained air pore distribution. 2 % of entrapped air pore was assumed. For the dimension and location due to the area of exposed surfaces, dimension and location of specimens in the considered structure is considered as the dimension of specimen 4×16×4 cm in hexahedron shape shown in Fig. 5. Two locations of the specimen, node number of 38 and 106 have been selected from the structure.
Table 1Arrangement of heat controller to the surfaces of the specimen
Surface | Node | Location | Heat plate # | Heat controller |
1 | 38 | Back side | 3 | 3 |
2 | 38 | Side | 3 | 3 |
3 | 38, 106 | Bottom/top | 1 | 1 |
4 | 106 | Side | 4 | 4 |
5 | 106 | Back side | 4 | 4 |
6 | 106 | Bottom | 2 | 2 |
The contact conditions for modeled locations in Figure 5 are explained in Table 1. The proposed experimental condition is modeled using DuCOM, which is life time simulator for concrete structures, part of which is illustrated in Table 2. In the multi-component cement hydration model [9], the referential hydration heat rate and activation energy in the equation of reaction kinetics are defined in a manner that considers the temperature dependency. Mutual interactions among the reacting constituents during hydration are quantitatively formulated. The effect of free water on the hydration rate is modeled using the hard shell concept of a hydrated cluster (Figure 2). The degree of heat generation rate decline in terms of both the amount of free water and the thickness of internal hydrates layer is formulated.
Fig. 5The boundary condition and locations of measurement
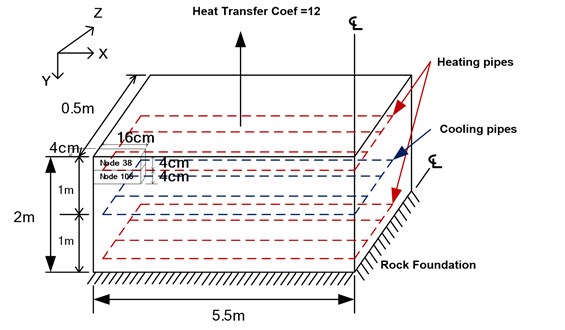
a)) Dimensions F. E. modeled
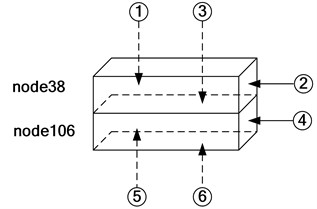
b) Enlarged nodes for modeling four exposed surface conditions (node numbers)
Table 2Integrated DuCOM [5] consists of ten Fortran-90 source files
MULTI-COM.F | Main system control processor |
AGNG-model.F | Aging material model of mechanics based on solidification concept and micro-pore pressure, time-dependent constitutive model of aged concrete |
CHLD-model.F | Chloride penetration model and free-ion and bounded chloride |
CO2G-model.F | Carbon dioxide diffusion model and ion thermo-dynamic equilibrium in pore solution, carbonation chemical reactions |
HEAT-model.F | Cement hydration heat model for each mineral compounds and consumption of water and CaOH2 creation model |
HYGR-model.F | Moisture migration and equilibrated balance model in micro pore, structural formation of micro-pore |
MECH-model.F | Constitutive model for reinforced concrete solids with multi-directional cracking, soil foundation model and interfaces |
OXGE-model.F | Oxygen (dissolved and gaseous) migration and micro-cell based corrosion of steel dispersed in concrete |
CALC-model.F | Calcium ion (dissolved) migration and leaching from Ca(OH)2 and C-S-H gel (calcium silicate) |
ELEC-model.F | Electric potential field and electron current, conductance and resistance |
BIOM-model.F | Bio-mass and its micro-organization rate, coupled heat generation and moisture consumption and volume compaction |
META-model.F | Heavy metal ion dissolution and diffusion from mono-sulphate 6-order chromium ion is considered |
The ambient temperature is varying, and it is dependent on the hydration rate. It is decided based on the previous analyses results as: 1) ambient temperature -6 ºC: T1 (heating specimen), 2) ambient temperature -6 ºC: T2 (no heating, hence frozen), 3) ambient temperature 10 ºC: T3 (room temperature). Ambient temperature history with heating plate setup is presented in Fig. 6.
Fig. 6Temperature control setup for the ambient and heating plate temperature history
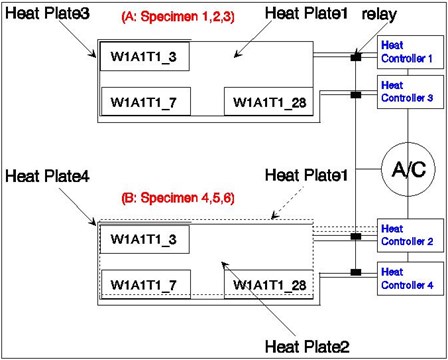
a) Plates setup for auto healing
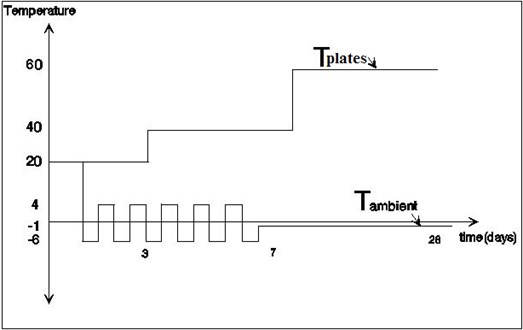
b) The ambient temperature history with heating plate setup
4.2. Measured results of test specimens investigated compared with Bayesian inference prediction
The hydration of heated specimen predicted based on linear and quadratic Bayesian inference models are compared with experimental results of hydration, which is directly related with the strength and stiffness of the concrete structures (Fig. 7).
Shown in the Figure 7, from the 3rd date (heated curing started from the date), even though the heated specimen are under cyclic freeze-thaw, they show higher degree of hydration than frozen ones. Concrete hardens as a result of the chemical reaction between cement and water known as hydration. This produces heat and is called the heat of hydration, which increases internal temperature while hydrated. In general higher cement contents result in more heat development. Normal, heavyweight and mass concrete states that as a rough guide, hydration of cement will generate a concrete temperature rise of about 4.7°C to 7.0°C per 50 kg of cement per m3 of concrete (10°F to 15°F per 100 lb of cement per yd3 of concrete) in 18 to 72 hours. This is the reason of monastically increasing degree of hydration while ambient temperature fluctuates in Figure 7.
Fig. 7Predicted and measured degree of hydration for the specimens
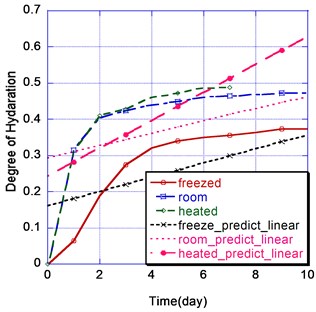
a) Linear prediction model with experimental results
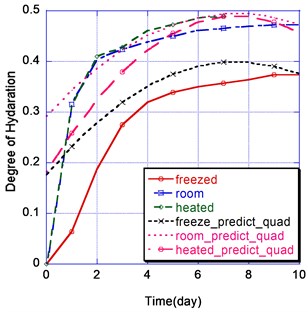
b) Quadratic prediction model with experimental results
The difference between the analysis and the experiments might be largely affected by the boundary conditions. The node 106 of specimen (4 side heated) shows much higher stiffness and hydration than the 3 side heated specimen (node 38). Therefore the best location of heated plates can be the top surface of the structure. If locating the plates on the top surface, because we select the two most severe locations from the structure, the most surface area of the considered structure can be treated as node 106 specimen.
It is notable that linear prediction models show bigger difference compared with experimental results in all of three room temperature, frozen, and heated condition specimens as shown 8.9 % difference at 9th day, while quadratic model provides rather close predicted values in terms of degree of hydration as shown 5.5 % difference averagely. However quadratic model shows tendency of increasing difference as time goes without experimental data from 8th date as well, which reveals there are needed expanded prediction models in order to optimize prediction model for missing or future prediction.
5. Conclusions
An innovative solution by auto healing of concrete structures damaged due to the cyclic freeze-thaw has been tested and compared with statistical prediction models. The results of models, compared with measurement of damages by cyclic freezing and thawing, show successful recovery of strength and stiffness.
The proposed Bayesian models leads to a probabilistic prediction of the future degradation of porous material based on prior probability density functions via Markov chain Monte Carlo simulations. Between two predictive models, the linear prediction model shows bigger difference compared with experimental results in all specimens, while quadratic model provides closer prediction in terms of degree of hydration, showing 62 % improvements compared with linear model. The suggested solution could be applied to a general purpose as well, in terms of modeling management of dynamic malfunction of network or improved control of government/corporation budget, which could save a great deal of work by expanding applications.
References
-
Cho T. Prediction of cyclic freeze–thaw damage in concrete structures based on response surface method. Construction and Building Materials, Vol. 21, Issue 12, 2007, p. 2031-2040.
-
LaFrance-Linden D., Watson S., Haines M. J. Threat assessment of hazardous materials transportation in aircraft cargo compartments. Transportation Research Record 1763, TRB, Washington (DC), National Research Council, 2001, p. 130-137.
-
Sundararajan C. Probabilistic Structural Mechanics Handbook. Chapman & Hall, London, 1995.
-
Nathan O. S., Dana L. K. Bayesian parameter estimation in probabilistic risk assessment. Reliability Engineering & System Safety, Vol. 62, Issue 1-2, 1998, p. 89-116.
-
Maekawa K., Chaube R. P., Kishi T. Modelling of Concrete Performance. E and FN SPON, London, 1999.
-
Fagerlund G. Equations for calculating the mean free distance between aggregate particles or air-pores in concrete. CBI Research 8:77, Swedish Cement and Concrete Research Institute, Stockholm, 1977.
-
Penttala V. Freezing-induced strains and pressures in wet porous materials and especially in concrete mortars. Advanced Cement Based Materials, Vol. 7, Issue 1, 1988, p. 8-19.
-
Cho T. A numerical model for the freeze-thaw damages in concrete structures. Journal of Korean Concrete Institute, Vol. 17, Issue 5, 2005, p. 857-868.
-
Nakarai K., Ishida T., Kishi T., Maekawa K. Enhanced thermodynamic analysis coupled with temperature-dependent microstructures of cement hydrates. Cement and Concrete Research, Vol. 37, Issue 4, 2007, p. 139-150.
-
Press J. S. Bayesian Statistics: Principles, Models and Applications. Wiley, New York, 1989.
About this article

This research was a part of the project titled “Development of the Advanced Technology of Nuclear Power Plant Structures Quality on Performance Improvement and Density Reinforcement (201016101004L)” in the Nuclear Power Technology Development Project funded by Korea Institute of Energy Technology Evaluation and Planning (KETEP) and the Ministry of Knowledge Economy, Korea.
