Abstract
The correlation between the cone resistance and the shear wave velocities was derived for the Quaternary glacial clayey soil (moraine) using Seismic Cone Penetration Test (SCPT) technique. The correlation obtained between two parameters is as high as +0.73. The derived regression equation has significant differences from those of clayey soils reported from other regions that are accounted to different genetic type of sediments and evolutionary history. Accordingly the obtained results can be applied in defining the dynamic geotechnical properties of glacial clayey soils of Lithuania and other regions that have similar geological conditions (i.e. formerly glaciated areas).
1. Introduction
Seismic cone penetration testing (SCPT) is increasingly applied technique used for assessment and design of construction foundations. In some cases it is crucial to evaluate the dynamic impact of external and internal vibrations on the constructions with a particular focus on the soil-structure interaction at the design stage. The risks related to the vibrations induced by tectonic forces (earthquakes), wind and water waves, also the liquefaction effects should be taken into account when designing the specific structures such as nuclear power plants, wind farms, offshore platforms [1, 2]. It requires assessment of a number of dynamic geotechnical parameters such as the shear modulus , the maximum shear modulus , the dynamic small-strain shear modulus and the Poisson's ratio ν. According to elasticity theory the shear modulus is directly related to soil bulk density and shear wave velocity as shown in Eq. (1):
where is the shear modulus, is the bulk density and is the shear wave velocity.
The shear wave velocity is of primary importance in assessing the dynamic soil properties. Variations in seismic velocities are related to specific soil composition, physical state, formation conditions, recent and ancient stresses affecting the body.
The Lithuanian territory is covered by Quaternary glacial sediments that were formed mainly during the last glaciation / deglaciation cycle. About 60 percent of the surface lithologies are represented by clayey moraine. Therefore the knowledge of their dynamic properties, including shear wave velocities, and understanding controlling factors is of primary importance in geotechnical studies of sites of construction of specific structures [3].
2. Methods
Shear wave velocities can be measured through both laboratory testing and field experiments. There is a number of laboratory methods to measure , such as resonant column, torsional shear, bending elements, triaxial test measuring very small strain (< 10-3-10-4 %) in a sample centre [4, 5, 6]. This approach ensures very high accuracy of measurements. Yet the laboratory sample conditions are not compatible to that in-situ. The samples are damaged to a different degree during sampling and the stress conditions are also inevitably changed. Therefore the obtained results are not always consistent to reflect the natural soil environment. Alternatively the field geophysical measurements are widely employed, e.g. downhole test (DHT), crosshole test (CHT), suspension logging, seismic reflection, seismic refraction, spectral analysis of surface waves (SASW). Still the results have some inconsistencies. Geophysical methods define distribution within a rather large soil volume, while the detailed geological framework of this volume and soil geotechnical parameters can be precisely defined only by drilling and sampling.
The seismic cone penetration technique becomes increasingly applied as it provides combination of soil geotechnical studies (static penetration CPT, dilatometer DMT) and seismic wave velocity measurements, such as seismic cone penetration test SCPT and seismic dilatometric test SDMT [7, 8, 9]. The conventional CPT and DMT tools are equipped with seismic module [10, 11] (see Fig. 1) to enable registration of shear- and compressional waves along with conventional geotechnical parameters, i.e. cone resistance , sleeve friction and pore water pressure .
The seismic survey was performed using “Geotech” sensor. The seismic modulus was attached to the CPT instrument and pushed into the ground. The penetration of the cone was regularly stopped at 0.5 m spacing to register seismic waves generated on the surface by hammering two L-shaped plates linked to penetrometer (see Fig. 2).
Fig. 1Scheme of seismic cone penetration test [10]
![Scheme of seismic cone penetration test [10]](https://static-01.extrica.com/articles/14602/14602-img1.jpg)
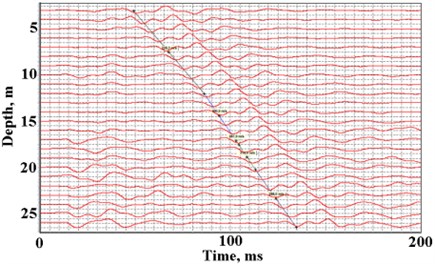
The registered seismic data were processed using “Geotech SCPT Analysis” programme. The programme enables compilation of a seismic depth profile and identification of seismic wave velocities by reducing the seismic noise using inverse polarisation and cross-correlation methods (see Fig. 3).
The geotechnical parameters were derived from the same penetrometer that enables correlation of seismic wave velocities and cone resistance for individual geological layers.
Fig. 2Plate used for excitement of shear waves
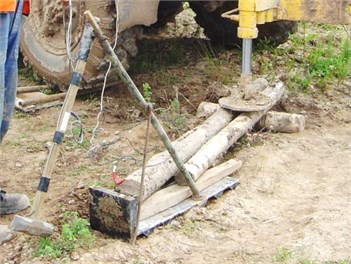
Fig. 3Example of shear waves propagation to a depth
Some basic soil parameters, i.e. density, grain size composition, strength, liquid limit, consistency index, cohesion, angle of internal friction were measured in a Laboratory of Vilnius University to characterise the studied soils.
3. Results
3.1. Soil geotechnical parameters
The glacial clayey soils were studied only. The investigated soils are classified as sandy silty clay and sandy clayey silt according to LST ISO 14688-2 [12]. They are collectively referred to as moraine. The sandy silty clay is predominating lithology. The average content of gravel grains is 3.4 %, sand –37.8 %, silt –42.8 % and clay –16.0 %.
The soil strength varies considerably. The strong soil ( 2.5 MN/m²) was mainly identified in the study points. According to liquid limit measurements, the soil is of low plasticity ( 35 %). The consistency index is variable, the soil is classified as stiff ( – 0.75-1.0) and very stiff ( 1.0), rarely firm ( – 0.50-0.75). The average bulk density is 2.24 Mg/m³. The void ratio ranges from 0.29 to 0.42 and averages 0.35. The direct shear test measurements indicate average cohesion 72.0 kN/m². The average angle of internal friction is 19° and modulus of deformation is about 27.4 MN/m². The overconsolidation ratio OCR was calculated from data of static penetration tests. They show that soils are overconsolidated to the depth of 25 m.
The studied soils can be therefore characterised as overconsolidated, of low compressibility, mostly stiff and very stiff.
3.2. Correlation of cone resistance and shear wave velocities
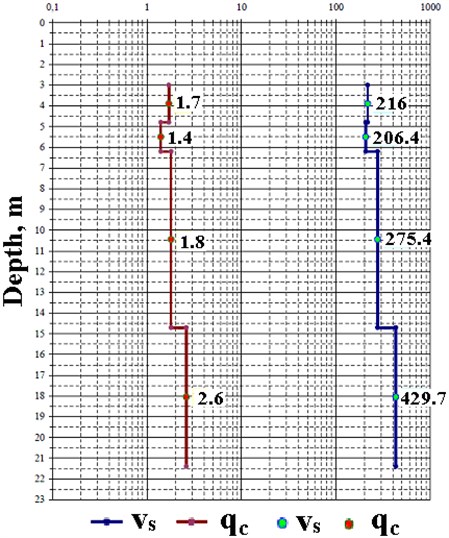
Fifty SCPT seismic measurements of glacial clayey soils (moraine) were done. The relatively homogeneous geological bodies were identified based on penetration resistance values derived from SCPT measurements. Accordingly the average shear wave velocities were calculated for the defined layers (see Fig. 4). The depths of studied layers range from 3.5 m to 27.5 m.
In total 55 averaged values of and were obtained that enabled consistent statistical analysis of correlation of those parameters (see Fig. 5). A rather strong correlation is stated, the correlation coefficient is as high as +0.73. The equation of the best-fit regression line was found as shown in Eq. (2):
where is the shear wave velocity in m/s, is the cone resistance in MN/m².
4. Discussion
The correlation of the seismic wave velocities with cone penetration test parameters (, , ) was reported from other regions in Table 1. They show considerable difference though.
Mayne and Rix (1995) [13] established a database from different sites in Europe and North America, where SCPT data was available. All were clay sites with varying OCR, strength and stiffness. A rather strong statistical correlation ( 0.75) between Lithuanian measured values of shear wave velocities and values calculated by the equation by Mayne and Rix (1995) [13] is noted (see Table 1). However Lithuanian shear wave velocities are about 1.35 times higher for the same cone resistance (see Fig. 6).
Fig. 4Example of comparison of profiles of averaged cone resistance qc in MN/m² and shear wave velocities vs in m/s
The difference is even higher for equations provided by Iyisan (1996) [14] and essentially by Prakoso (2010) [15] (see Fig. 6). The former equation characterises deep alluvial deposits of the river Euphrates, while the latter study was carried out in residual soils of West Java (Indonesia). Both sites have very different geological settings compared to Lithuanian condition, this explains considerable differences in relationship. The closest correlation was obtained with equation provided by Long and Donohue (2010) [16, 17] for Norwegian offshore clays. The correction factor is about 0.91. Similarly to Lithuania the sediments were deposited in the region previously affected by ice sheets.
The differences in relationship are related to different genetic type and evolutionary history of clayey soils in the regions characterised by different geological setting. It should be therefore realised that correlation equations derived from other regions should be employed with great caution.
The soil lithology is of primary importance. SCPT studies of Quaternary sandy soils were performed in Lithuania recently [21]. The statistical correlation is somewhat higher in sandy lithologies (+0.80) compared to moraine (+0.73). It is explained in terms of wider range in grain-size composition of moraine layers. There is great difference between the correlation equations derived for two types of soils (see Fig. 7). Shear wave velocities are much higher in clayey soil compared to sandy soil for the same cone resistance values. The difference systematically increases with increasing cone resistance values. The trend defined for Lithuanian Quaternary sandy soils is rather close to clayey soil trends provided by Iyisan (1996) [14] and Prakoso (2010) [15] (see Figs. 6, 7).
Fig. 5Plot of cone resistance vs shear wave velocities of studied clayey soils
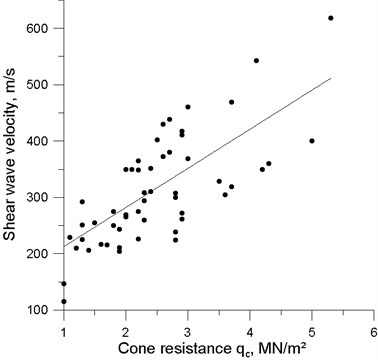
Fig. 6Comparison of regression lines of cones resistance vs. shear wave velocity relationships defined for clayey soils of different regions (see Table 1 for equations)
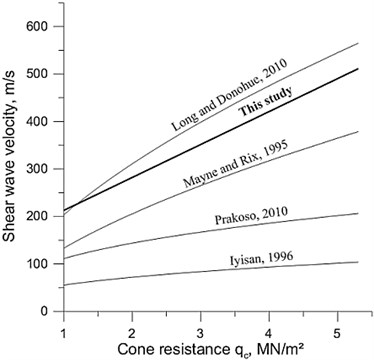
Table 1Shear wave velocity correlation equations derived for clayey soils of different regions based on SCPT data
No. | Soil type | Equations | References |
1 | All soils | Hegazy and Mayne, 1995 [18] | |
2 | All soils | Mayne, 2006 [19] | |
3 | Clay (alluvial) | Iyisan, 1996 [14] | |
4 | Clay | , ( in kN/m²) | Mayne and Rix, 1995 [13] |
5 | Clay | , ( in kN/m²) | Mayne and Rix, 1995 [13] |
6 | Silt and clay | Prakoso, 2010 [15] | |
7 | Soft clay | , ( in kN/m²) | Long and Donohue, 2010 [17] |
8 | Clayey silt | Trevor, Paisley, Mayne, 2010 [20] | |
Where: is the shear wave velocity, m/s; is the corrected cone resistance, MN/m²; is the measured cone resistance, MN/m²; is the sleeve friction, kN/m²; is the void ratio. | |||
Fig. 7Comparison of cone resistanceand shear wave velocity correlation regression lines of Quaternary sandy soils [21] and clayey soils (this study) of Lithuania
![Comparison of cone resistanceand shear wave velocity correlation regression lines of Quaternary sandy soils [21] and clayey soils (this study) of Lithuania](https://static-01.extrica.com/articles/14602/14602-img7.jpg)
5. Conclusions
The application of SCPT approach allows combined measurement of cone resistance and shear wave velocities. The obtained correlation between those two parameters for Quaternary glacial clayey soils can be applied at sites of similar geological setting that are surveyed by using traditional cone penetration methods thus supplying additional information on dynamic geotechnical parameters. The consistency of this approach is supported by rather close statistical correlation +0.73 obtained between cone resistance and shear wave velocities.
References
-
Massarsch K. R. Deformation properties of fine-grained soils from seismic tests. Keynote Lecture, International Conference on Site Characterization (ISC’2), Porto, Portugal, 19-22 September 2004, p. 133-146.
-
Youd T. L., Idriss I. M. Liquefaction resistance of soils: summary report from the 1996 NCEER and 1998 NCEER/NSF workshops on evaluation of liquefaction resistance of soils. Journal of Geotechnical and Geo-environmental Engineering ACSE, Vol. 127, Issue 10, 2001, p. 297-313.
-
Seismic Design and Qualification for Nuclear Power Plants. Safety Standards Series No. NS-G-1.6, IAEA, Vienna, Austria, 2003.
-
Mayne P. W. Cone Penetration Testing: State-of-Practice. Final Report, NCHRP Project 20-05, Task 37-14, Georgia Institute of Technology, Atlanta, GA, Transportation Research Board Synthesis Study, 2007.
-
Woods R. D., Henke R. Seismic techniques in the laboratory. ASCE Journal, Geotechnical Engineering Division, Vol. 107, Issue GT10, 1981, p. 1309-1325.
-
Woods R. D. Laboratory measurement of dynamic soil properties. Dynamic Geotechnical Testing II, ASTM Special Technical Publication No. 1213, Eds. Ebelhar R. J., Drnevich V. P., Kutter B. L., American Society for Testing and Materials, Philadelphia, USA, 1994, p. 165-190.
-
Campanella R. G. Field methods for dynamic geotechnical testing: an overview of capabilities and needs. Dynamic Geotechnical Testing II, ASTM Special Technical Publication No. 1213, Eds. Ebelhar R. J., Drnevich V. P., Kutter B. L., American Society for Testing and Materials, Philadelphia, USA, 1994, p. 3-12.
-
Campanella R. G., Howie J. A. Practical Applications of the Cone Penetration Test. A Manual on Interpretation of Seismic Piezocone Test Data for Geotechnical Design, Civil Engineering Department, June 2005, 305 p.
-
Schneider J. A., Hoyos L. Jr., Mayne P. W., Macari E. J., Rix G. J. Field and laboratory measurements of dynamic shear modulus of Piedmont residual soils. Behavioral Characteristics of Residual Soils, Proc. of the Sessions of the Geo-Congress’99, Geotechnical Special Publications No. 92, ASCE, Charlotte, NC, USA, 17-20 October 1999, p. 12-25.
-
Campanella R. G., Robertson P. K., Gillespie D. A seismic cone penetrometer for offshore applications. Proc. of the Internat. Conf. on Oceanology (Oceanology International’86), Vol. 6, Brighton, U. K., 4-7 March 1986, p. 479-486.
-
Robertson P. K., Campanella R. G., Gillespie D. G., Greig J. Use of piezometer cone data. Proc. of the ASCE Specialty Conference (In-Situ’86): Use of In Situ Tests in Geotechnical Engineering, Blacksburg, VA, USA, 23-25 June 1986, p. 1263-1280.
-
LST EN ISO 14688-2:2004. Geotechnical Investigation and Testing – Identification and Classification of Soil – Part 2: Principles for Soil Classification.
-
Mayne P. W., Rix G. J. Correlations between shear wave velocity and cone tip resistance in clays. Soils & Foundations, Vol. 35, No. 2, 1995, p. 107-110.
-
Iyisan R. Correlations between shear wave velocity and in-situ penetration test results. Chamber of Civil Engineers of Turkey, Teknik Dergi, Vol. 7, Issue 2, 1996, p. 1187-1199.
-
Prakoso A. W. Correlation of cone resistance and shear wave velocity for residual soil. Proc. of 2nd International Symposium on Cone Penetration Testing (CPT’10), Vol. 2, Huntington Beach, CA, USA, 9-10 May 2010, p. 425-430.
-
Long M. Design parameters from in situ tests in soft ground – recent developments. Geotechnical and Geophysical Site Characterization, Proc. of the 3rd Int. Conf. on Site Characterization (ISC’3), Taipei, Taiwan, 1-4 April, 2008, p. 89-116.
-
Long M., Donohue Sh. Characterisation of Norwegian marine clays with combined shear wave velocity and CPTU data. Canadian Geotechnical Journal, Vol. 47, Issue 7, 2010, p. 709-718.
-
Hegazy Y. A., Mayne P. W. Statistical correlations between vs and CPT data for different soil types. Proc. of 1st Internat. Symposium on Cone Penetration Testing (CPT’95), Vol. 2, Swedish Geotechnical Society, Linköping, Sweden, 4-5 October 1995, p. 173-178.
-
Mayne P. W. The 2nd James K. Mitchell Lecture: Undisturbed sand strength from seismic cone tests. Geomechanics and Geoengineering: An International Journal, Vol. 1, Issue 4, 2006, p. 239-247.
-
Trevor F. A., Paisley J. M., Mayne P. W. Cone penetration tests at active earthquake sites. 2nd International Symposium on Cone Penetration Testing, 9-11 May 2010, Hunting Beach, California, USA.
-
Gadeikis S., Dundulis K., Žaržojus G., Gadeikytė S., Urbaitis D., Gribulis D., Šliaupa S. Correlation of shear–wave velocities and cone resistance of quaternary glacial sandy soils defined by seismic cone penetration test (SCPT). Journal of Vibroengineering, Vol. 14, Issue 2, 2012, p. 715-722.
About this article

