Abstract
In a large number of engineering structures, clearance always exists due to assemblage, manufacturing errors and wear. The presence of clearance may lead to intermittent contact or impacts. For such structures accurate assessment of dynamic response is necessary for design against excessive vibration and wear as well as noise. In this paper we are interested in the study of the dynamic behavior of a cantilever beam structure with clearance. Simulation and experimental tests were carried out for this goal. For simulation tests, clearance was equivalent to a spring-dashpot model with consideration of vertical and angular motions, the impact of beam and boundary face was also taken into consideration. A cantilever beam set-up was designed and built for experimental validations. The presented results showed that the system responses were greatly influenced in the presence of clearance. The peak value of beam’s time-domain signal is larger with the clearance enlargement. The high-order harmonics are more possible to exist in frequency-domain signals when clearance size increases. The effects of clearance should not be ignored when analyzing the dynamic performance and vibration characteristic of engineering structures.
1. Introduction
Beam-like structures are commonly used in transportation, construction, weapon and mechanical industries. For such structures, such as building skeletons and gun barrel, clearances are unavoidable due to imperfect manufacture and wear. These clearances change the dynamic response of the mechanism, justify the deviations between numerical predictions and experimental measurements and eventually lead to important deviations between the projected behavior of mechanisms and their real outcome [1-3]. As a result, structure exhibits a nonlinear behavior. Therefore it is very important to study the methods for the dynamic behavior analysis of the structure with clearance connections [4-7].
Clearance nonlinearity is different from most of other nonlinearities because it cannot be approximated by a mathematical series. Modeling clearance structure involves three types of coupling motions. The first one is the angular motion of rigid links, which is a large displacement, slowly variable process. The second one is the impact motion caused by joint clearance, which is instantaneous, suddenly changing and a very complicated process. The last is elastic deformation motion, which is a smaller displacement, quickly variable process [8]. In order to have a complete understanding of dynamic behavior of clearance mechanisms, researchers carried out several modeling methods [9-12]. There are three different types of clearance dynamic models: permanent contact model, two-state model and three-state model. Permanent contact model is also called clearance link model, that is, the clearance joint is regarded as a rigid link without mass and whose length is equal to gap size. Winfrey first analyzed the motion of a cam system with clearances by structural dynamic finite element method. The modeling analysis was very simple for the constant mass and stiffness matrices and superposition was assumed by small deformation [9]. Dubowskey developed a more general dynamic model for an elastic linkage mechanism with clearance connections by Lagrangian approach [10]. In the two-state model, the relative motion states are divided into separation and contact. Rhee and Akey have studied the response of a revolute joint with clearance in a rigid four bar mechanism. The clearance is modeled as a massless rigid connection requiring a continuous contact. Separation and contact motion phases are distinguished. They showed that, depending on the clearance size, the system can exhibit periodic or chaotic behavior [11]. Erkaya and Uzmay presented an investigation of joint clearance influences on the path generation and transmission angle of structures. Joint clearance was treated as a massless virtual link and mathematical expression of its motions was obtained using Lagrange’s equation [12]. In the three-state model, the relative motion states are divided into contact, separation and collision [13]. Schwab et al. have studied the behavior of slider-crank mechanism when the coupler is rigid or flexible. A Hertzian contact force model is used at the revolute slider joint. Three motion types of motions were detected: free flight, continuous contact and impact with penetration. Compared with the rigid case, the flexibility of the connecting rod has a smoothing effect and acts as a suspension for the mechanism [14].
Although the dynamic modeling work for the structure with clearance connections has attracted more and more attention and gained some achievements, the impact nonlinear behavior caused by joint clearance is rarely considered [14, 15]. In this study, we are interested in the dynamic response of a cantilever beam structure with clearance. The rest of the paper is organized as follows. In Section 2, we present the spring-dashpot model for the clearance and the contact in the connections. In Section 3, we highlight the problem of clearance and the coupling separation-collision through simulation tests carried on the software ADAMS. In Section 4, we describe the experimental set-up designed and built to carry out some experimental validations.
2. Nonlinear dynamic modeling of cantilever with clearance
In the static condition, the cantilever contacts with gland and base in the supported end (Fig. 1). The beam will break away from the surface of gland or base when it is under external force. And then it collides with the surface of gland or base repeatedly, as shown in Fig. 2.
Fig. 1Cantilever beam with clearance: 1 – base; 2 – cantilever; 3 – gland; 4 – screw; 5 – support pad – A; 6 – support pad – B
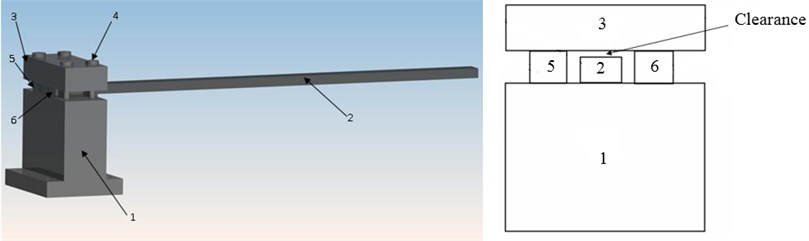
Fig. 2Contact and collision of cantilever clearance
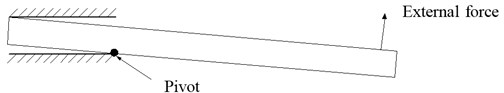
a) Contact velocity is zero
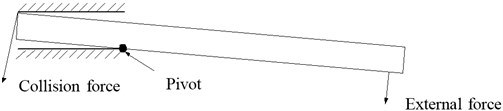
b) Collision force is obvious
Clearance is equivalent to the spring-dashpot model. There is a collision between the end of cantilever and the surface of gland. The normal contact force can be expressed as the function about puncture depth considering local deformation of contact point and the duration time of contact process. To obtain the above function viscous damping should be taken into consideration to reflect the energy loss which material damping leads to. The viscous damping is related to the coefficient of resilience and embedded depth. In the contact process, the value of collision force at one point is expressed as:
In the above expression:
– Hertzian contact stiffness;
– coefficient of viscous damping;
– coefficient of resilience;
– index: 3/2;
– relative embedded depth of contact point;
– normal relative velocity of contact point currently;
– value of normal relative velocity in contact point currently.
The expanded expression of the normal contact force is expressed as:
To study cantilever with clearance, clearance was equivalent to spring-dashpot which was added to finite element model by Chen [5]. Clearance was equivalent to continuous material. He changed elastic modulus of material and contact degree between clearance and boundary to reflect different size of clearances.
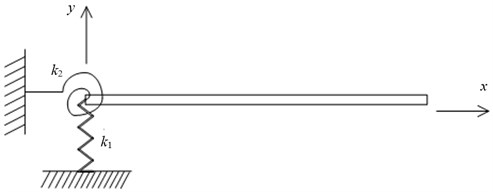
The above research results are taken into account to build a new model below. Since the existence of clearance not only has effect on vertical direction of cantilever, but also has effect on rotary movement, we put forward the model as shown in Fig. 3, the end of cantilever is under the constraint of draught spring and torsion spring .
Differential equation of transverse vibration is expressed as:
Its general solution is expressed as:
Fig. 3Spring-dashpot model of cantilever with clearance
In the above expressions:
– elastic modulus of beam;
– section modulus in bending;
– material density of beam;
– transversal deformation of the beam structure;
– characteristic parameter related to vibration mode.
Boundary conditions in the end with elastic constraint are expressed as:
Boundary conditions in the free end are expressed as:
The equations obtained by substituting the above conditions are expressed as:
Determinant of coefficient matrix of equations about , , and is zero to make sure that, , and have nonzero solutions. That is:
The above determinant can obtain the equation:
In the above equation: , natural frequency is proportional to (we can obtain the relationship from the expression: ).
When , , the equivalent equation is expressed as:
It is the equation of an ideal cantilever, namely, the beam is totally fixed and its numerical solutions are:
, , .
When , , the equivalent equation is expressed as:
It is the equation of beam with free ends namely and its numerical solutions are:
, , .
The Eq. (9) is transcendental equation, so we can obtain the analytical solutions of about and .
Fig. 4Value of λ1 with respect to k1 and k2
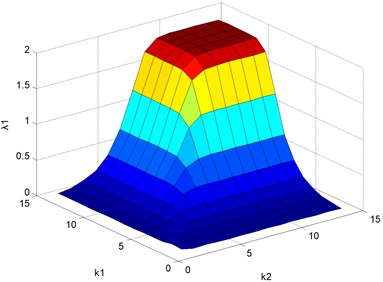
Fig. 5Value of λ2 with respect to k1 and k2
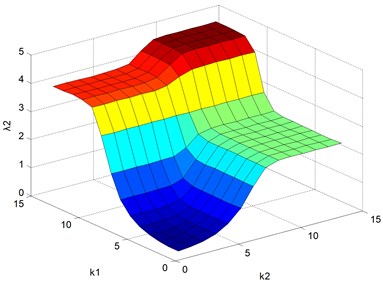
Fig. 6Value of λ3 with respect to k1 and k2
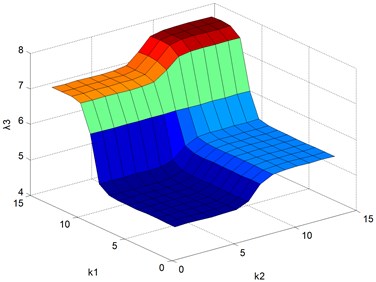
There are infinite numbers of solutions of Eq. (2). We only choose the first three solutions which correspond to the first three natural frequencies of the model in Fig. 3. Figs. 4-6 show the values of , and with respect to and . From Fig. 4, we conclude that increases as and increase. When and come to a certain value (e.g. equals to 106 and equals to 105), is close to a constant value 1.875. On this condition, we can regard the model as a cantilever. While the other figures are quite different, when is less than 103 and is more than 105, gets close to a constant value 2.365. When is less than 104 and is more than 105, reaches a constant value 5.497. On these two conditions, the beam only has rotational restriction. When is more than 106 and is less than 102, gets close to a constant value 2.365. When is more than 107 and is less than 102, reaches a constant value 5.497. On these two conditions, the beam only has translational constraint.
3. The simulation study of cantilever with clearance in ADAMS
According to the fundamental conditions put forward when building the rigid dynamic model of cantilever with clearance, the motion process of cantilever with clearance is simulated by ADAMS under the effect of external force. ADAMS software is an analysis software of virtual prototype developed by MDI company. As one module of ADAMS, ADAMS/Flex provides the technology to correctly include a component’s flexibility even in presence of large overall motion and complex interaction with other modeling elements. Another module ADAMS/Vibration allows engineers to easily study forced vibration of mechanical systems using frequency domain analysis.
Nonlinear spring-dashpot model which is used in collision process has been built. We need set contact stiffness, nonlinear coefficient of force, damping ratio, and embedded depth in contact points and so on. The values of the above parameters should be only taken properly because the value of collision force is not necessary to be studied quantitatively. The embedded depth is 0.01, and the other parameters use default values of ADAMS system.
The length of cantilever is 510 mm, the width and thickness are 20 mm, 12 mm, respectively (see Fig. 7). The length of support part is 50 mm. The obtained model is shown in Fig. 8 and the enlarged drawing of support part is shown in Fig. 9. The top and bottom surfaces offset some distance to form the clearance. The variation of offset distance means the variation of clearance size, as shown in Fig. 10. Unilateral clearance is considered in this paper for convenience.
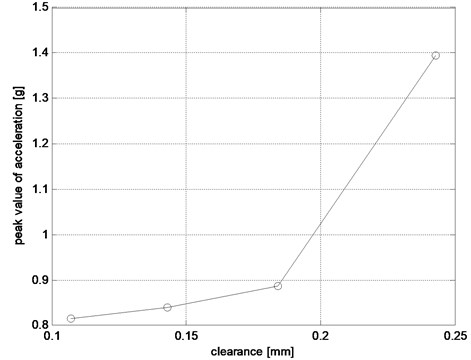
Four different clearance cases listed in Table 1 are considered in ADAMS simulation. The parameters consist of stiffness, damping, embedded depth, in Eq. 1 are set in ADAMS as shown in Table 2. We add drought springs to the points of contact. The model ran respectively under four different clearances. We get four acceleration-time curves at the test point which is 370 mm far from the end of the beam. They are shown in Fig. 11. We can see that when clearance increases, the acceleration changes more severely, especially at the beginning of the simulation. The acceleration-time curve under the clearance of 0.107 mm is singled out in Fig. 12. Fig. 13 shows the peak value of each curve. We can conclude that the peak value increases with the clearance enlargement.
Table 1Clearance size in ADAMS simulation
No. of group | Clearance size / mm |
1 | 0.107 |
2 | 0.143 |
3 | 0.184 |
4 | 0.243 |
Fig. 7Dimension of the beam in simulation
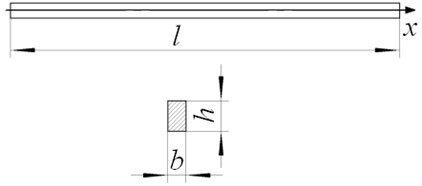
Fig. 8ADAMS model of cantilever with clearance

Fig. 9Support part of ADAMS model
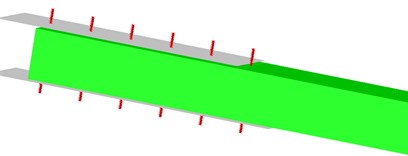
Fig. 10Clearance of ADAMS model
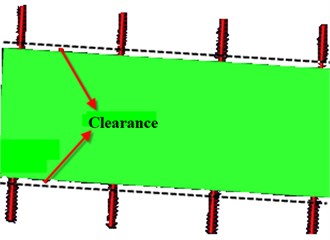
Fig. 11Four acceleration-time curves at the test point which is 370 mm distance far from the end of the beam
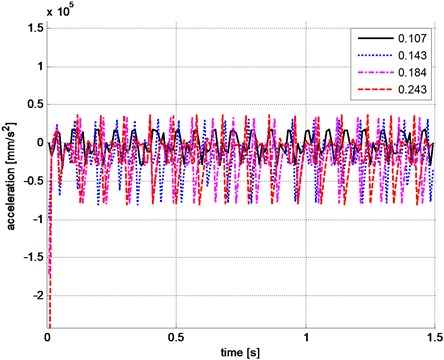
Fig. 12Acceleration-time curve under the clearance of 0.107 mm
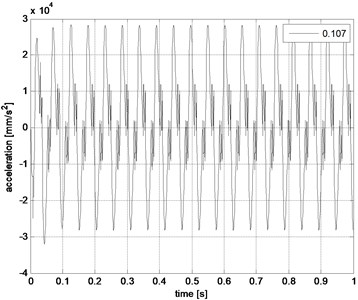
Fig. 13Peak value of each acceleration-time curve
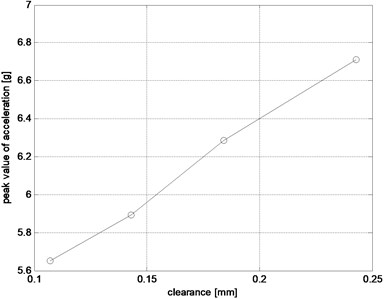
Table 2Contact parameter in ADAMS
Contact type | Point to plane |
Stiffness | 1e5 |
Force exponent | 2.2 |
Damping | 10.0 |
Penetration | 1e-3 |
4. The experimental tests of cantilever with clearance
4.1. Description of experimental set-up
Quantitative experiment device of cantilever with clearance was shown in Fig. 14. The material of cantilever is structural steel, and its elastic modulus: , Poisson ratio: , material density: . The dimensions of cantilever are set as same as one in the ADAMS simulation: its length: its width: its thickness: . The clearance of cantilever is changed by the means of changing simultaneously the thickness of support pad – A and B, as shown in Fig. 1. The method is presented in details as follows: seven groups support pads were designed and the thickness of support pad – A was the same with that of pad – B in every group. The thickness of support pads was actually measured after machining. The thickness of support pad subtracted that of cantilever to obtain the size of clearance. The actual thickness of support pads and the actual values of clearance in experiment were given in Table 2. When the value of clearance is -0.006 mm, it represents that the value is zero (negative sign and the value mean that gland has great pressure on cantilever). When the value of clearance is 0.04 mm, the pressure of gland on cantilever doesn’t exist.
Fig. 14Experimental device of cantilever with clearance: 1 – exciter; 2 – cantilever; 3 – acceleration sensor
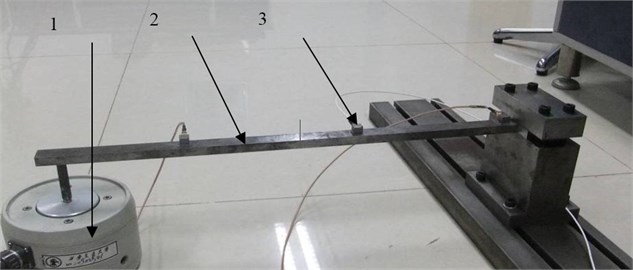
Table 3Thickness of support pads and the actual clearance size in experiment
No. of group | Actual thickness / mm | Clearance size / mm |
1 | 11.994 | -0.006 |
2 | 12.008 | 0.008 |
3 | 12.040 | 0.040 |
4 | 12.107 | 0.107 |
5 | 12.143 | 0.143 |
6 | 12.184 | 0.184 |
7 | 12.243 | 0.243 |
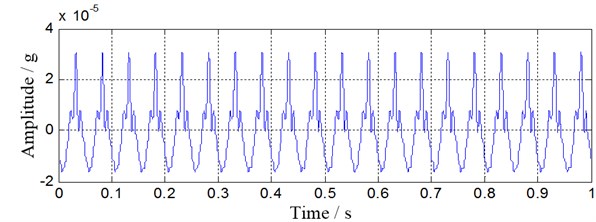
In experimental tests, firstly, signal generator produces sinusoidal signals which are sent to the exciter. Secondly, cantilever generates vibration excited by exciter. Thirdly, vibration acceleration of cantilever was collected by acceleration sensors. Then the collected signals were sent to Sony-EX collection box. In the end, time-domain signals were recorded down by software after the collected signals were sent to computer. JZK-5 modal exciter was used in the experiment. Fig. 15 shows time-domain signals of real-time collection for one case.
Tests of seven groups with different clearances are carried out. We should carry out the tests after the entire system enters in the stable state. In this way, data fluctuation of tests is not apparent so that the data can truly reflect stable state of system. The thickness of support pad – A is the same with that of pad – B. The clearance size of cantilever can be changed by changing the thickness of support pad A and B. In the experiment the clearance between cantilever and gland is zero by tightening four screws, of course, the clearance between cantilever and base is also zero. So the thickness of support pads in every group subtracts that of cantilever to obtain the clearance size. Data was collected three times in every group. If the time – domain signals were unchangeable, the result was valid. In this way, signals can actually reflect the clearance size.
Fig. 15Real-time signals when clearance size is 0.008 mm
Based on the theory analysis and simulations, collision occurs under the effect of external force on the cantilever. The signals in the experiment were obtained by adding the response of sinusoidal signals to the response of impulse excitation. Two responses were separated to obtain the characteristics of signals in time domain and frequency domain.
4.2. Assessment of experimental results
To study the effect of clearance on sinusoidal excitation response, sinusoidal excitation response was extracted after the signals of collision response were filtered out from the obtained signals. Actually, the process of filtering out collision response signals is kind of smoothing processing. Five-points moving average method was used in order to filter out the collision response components. Peak values of seven groups after processing are shown in Table 4. Amplitude spectrums as shown in Fig. 16 can be obtained after discrete Fourier transforming. There is frequency doubling, frequency tripling and even high-order harmonics apart from 20 Hz exciting frequency in Fig. 16. The high-order harmonics are more possible to exist with the growth of clearance size. At the same time, amplitude of different frequency components increases correspondingly. Because the system with clearance is nonlinear, different frequency components increase with different ratios.
Table 4Obtained values of seven groups after processing
Number of group | Size of clearance / mm | The maximum positive value in time domain / g | The minimum negative value in time domain / g | Peak value / g |
1 | -0.006 | -0.042 | 0.145 | 0.187 |
2 | 0.008 | -0.051 | 0.241 | 0.292 |
3 | 0.040 | -0.125 | 0.208 | 0.333 |
4 | 0.107 | -0.210 | 0.271 | 0.481 |
5 | 0.143 | -0.213 | 0.329 | 0.542 |
6 | 0.184 | -0.278 | 0.321 | 0.599 |
7 | 0.243 | -0.336 | 0.415 | 0.751 |
Peak value changes with clearances, as shown in Fig. 17. From the chart we can obtain the change trend with clarity as follow: peak value in the time-domain increases with the growth of clearance size when cantilever bears sinusoidal excitation whose intensity doesn’t change. At the same time, the variation is apparent from clearance size: 0 to clearance size: 0.008 mm.
Fig. 16Frequency spectrums of signals after smoothing processing
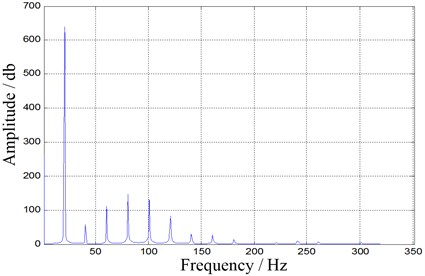
a) Frequency spectrum of the signal when clearance size is 0.008 mm
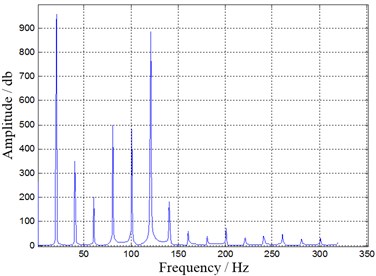
b) Frequency spectrum of the signal when clearance size is 0.243 mm
Fig. 17Change chart of peak value following clearances
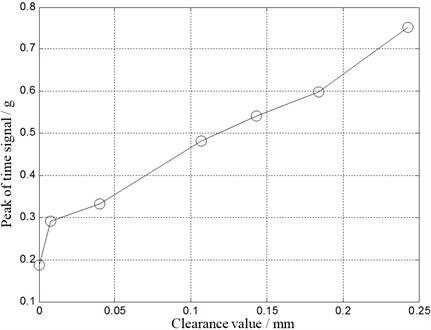
The peak value of sinusoidal response signals increases monotonously with the variation of clearance. The explanation is shown below. The growth of clearance makes the degree of impulse excitation larger. Moreover, the effect of collision excitation is much larger than that of sinusoidal excitation generated by the exciter. So the peak value of sinusoidal response signals increases correspondingly. There is a series of high-order harmonics in the amplitude spectrum chart of sinusoidal response signals. Two reasons make the existence of the high-order harmonics possible. On one hand, the effect of impulse excitation on system can result in the existence of the high-order harmonics. On the other hand, because the clearance exists in support in the motion process, cantilever is a sectional and nonlinear model whose support stiffness is changeable with following time.
Fig. 18Four acceleration-time curves for different clearance case in experiment
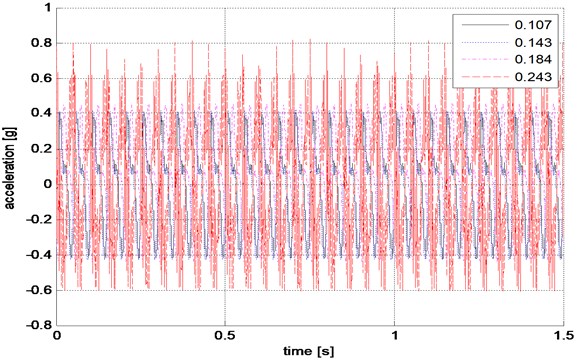
Fig. 19Acceleration-time curve under the clearance of 0.107 mm in experiment
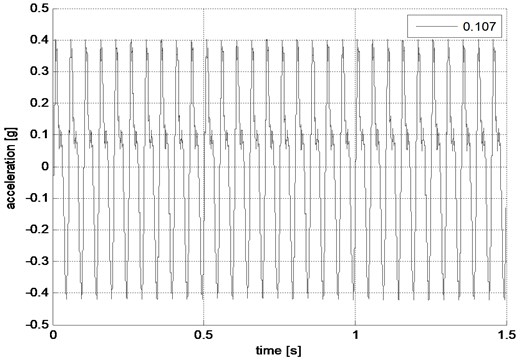
Fig. 20Enlarged figure of Fig. 17
4.3. Comparisons of simulation and experimental results
In order to make a comparison of experimental results with simulation, we took four clearance cases listed in Table 1 as examples. Fig. 18 gave the four acceleration-time curves in experiment, and Fig. 19 showed the acceleration-time curve under the clearance of 0.107 mm. Fig. 20 showed the enlarged picture of peak value of each acceleration-time curve in Fig. 17. Through the acquired data, it is obvious that the peak value increases with the clearance, which is consistent with the simulation results. However, there is some difference from the simulation, in the experiment, when clearance is 0.243 mm, the peak value of the acceleration is particularly large. The peak values of acceleration in simulation and experiment are different, about one order of magnitude. The following two points may lead to the deviation: (1) the beam is regarded as a rigid body in ADAMS; (2) in the experiment, there are inevitable measuring errors.
5. Conclusions
Clearances occur in almost all engineering structures, typically beam-like structure. Therefore, it is very important to study the clearances of mechanisms, which may increase the working performance and lifetime of mechanisms. Based on nonlinear dynamic model of cantilever with clearance, clearance was equivalent to spring-dashpot model in this paper. The motion of support part was simulated by ADAMS through adding collision to the built model. Simulation and experimental results show that, in the present of clearance, the mechanism responses were greatly influenced. The peak value of beam’s time-domain signal is larger with the clearance enlargement. The high-order harmonics are more possible to exist in frequency-domain signals when clearance size increases. At the same time, amplitude of different frequency components increases correspondingly. Because the system with clearance is nonlinear, different frequency components increase with different ratios. The important contribution in this work is the quantitative effect of the size of clearances on the nature of dynamic response, which should be an important design parameter when designing supports in a vibrating beam-like structure.
References
-
Z. F. Bai, Y. Zhao Dynamic behavior analysis of planar mechanical systems with clearance in revolute joints using a new hybrid contact force model. Internation Journal of Mechanical Sciences, Vol. 54, 2012, p. 190-205.
-
M. Dupac, D. G. Beale Dynamic analysis of a flexible linkage mechanism with cracks and clearance. Mechanism and Machine Theory, Vol. 45, 2010, p. 1909-1923.
-
B. Li, H. R. Cao, Z. J. He The construction of one-dimensional Daubechies wavelet-based finite elements for structural response analysis. Journal of Vibroengineering, Vol. 13, 2011, p. 729-738.
-
B. Li, X. F. Chen, Z. J. He Detection of crack location and size in structures using wavelet finite element methods. Journal of Sound and Vibration, Vol. 285, 2005, p. 767-782.
-
R. Y. Chen Dynamic Modeling and Experimental Research on the Slide Plate of Gun Barrel and Guide with Clearances. Master Thesis, Xi’an Jiaotong University, Xi’an, China, 2010.
-
C. Athisakul, B. Phungpaingam. Effect of material nonlinearity on large deflection of variable-arc-length beams subjected to uniform self-weight. Mathematical Problems in Engineerings, No. 345461, 2012, p. 1-9.
-
I. Khemili, L. Romdhane. Dynamic analysis of a flexible slider-crank mechanism with clearance. European Journal of Mechanics A/Solids, Vol. 27, 2008, p. 882-898.
-
C. Jin, Q. Yang, F. Ling. The nonlinear dyanmic behavior of an elastic linkage mechanism with clearance. Journal of Sound and Vibration, Vol. 249, 2002, p. 213-226.
-
R. C. Winfrey, R. V. Anderson, C. W. Gnilda. Analysis of elastic machinery with clearances. Journal of Engineering for Industry, Vol. 95, 1973, p. 695-703.
-
S. Dubowsky, T. N. Gardner. Design and analysis of multilink flexible mechanisms with multiple clearance connections. Journal of Engineering for Industry, Vol. 99, 1977, p. 88-96.
-
J. Rhee, A. Akay. Dynamic response of a revolute joint with clearance. Mechanism and Machine Theory, Vol. 40, 2005, p. 1316-1329.
-
S. Erkaya, I. Uzmay. Determining link parameters using genetic algorithm in mechanisms with joint clearance. Mechanism and Machine Theory, Vol. 44, 2009, p. 222-234.
-
T. Li, J. Guo, Y. Cao. Dynamic characteristics analysis of deployable space structures considering joint clearance. Acta Astronautica, Vol. 68, 2011, p. 974-983.
-
A. L. Schwab, A. L. Meijaard. A comparison of revolute clearance models in the dynamic analysis of rigid and elastic mechanical systems. Mechanism and Machine Theory, Vol. 37, 2002, p. 895-913.
-
B. Li, Z. J. He. Frequency-based crack identification for static beam with rectangular cross-section. Journal of Vibroengineering, Vol. 13, 2011, p. 477-486.
About this article

This work was supported by National Natural Science Foundation of China (Grant No. 11104222) and the NSAF (Grant No. 11176024).
