Abstract
A structural damage diagnosis method based on information exergy is developed in this study. Damage sensitive features are firstly extracted from the sensory information using information exergy philosophy and then structural health condition is evaluated using similarity matching. The proposed diagnostic method integrates multi-point and multi-moment structural health monitoring information to perform structural damage identification. Thus structural damage progressing information can be captured and uncertainty within the damage diagnostic process can be reduced. The effectiveness and accuracy of the proposed structural fault identification approach is demonstrated through experimental tests on a truss-type structure with singular value spectrum exergy as damage sensitive feature.
1. Introduction
Structures are often of security and economic significance and they deteriorate once put into service. How to perform structural health monitoring and damage diagnosis to sustain structural safety and reliability is the focus of both academics and practitioners [1]. Structural damage diagnosis technique can identify the occurrence, location and severity of damage in a structure, so that proper measures can be taken beforehand.
Most structural damage identification methods are based on vibration signature analysis and have found promising applications [2, 3]. Some effects and features of system nonlinear vibration as well as troubleshooting measures have been outlined in [4]. Empirical mode decomposition and wavelet transform are combined in [5] to pinpoint occurring time and evaluate extent of structural damage. And ambient vibration response analysis is employed to calculate scour depth of bridge foundation in [6].
Structural damage diagnosis results are of uncertainty due to various uncertainties, such as measurement uncertainty, modeling errors and physical variability [7, 8]. To obtain more reliable fault identification results, methods integrating multi-source information by D-S theory have been tailored for structural defects diagnosis [9, 10]. These methods mostly merging sensory information at the same moment and time-varying measurement uncertainty cannot be managed.
For better structural damage diagnostic performance, an information exergy-based method integrating multi-point and multi-moment structural health monitoring information is proposed in this study. The proposed method can reveal structural damage evolving process and thus uncertainty within the damage diagnostic process can be reduced, especially the time-varying measurement uncertainty.
The remainder of this paper is organized as follows. A brief introduction to information exergy is given in Section 2. Then the information exergy-based damage diagnosis method is developed in Section 3. Also, illustration for information-exergy feature extraction is presented in this section. Damage identification of a truss structure is carried out in Section 4 with discussions. Section 5 concludes this paper with some summaries and future research directions.
2. A brief introduction to information exergy
In this section, generalized information entropy is introduced firstly and then the definition of information exergy is given.
2.1. Generalized information entropy
Information entropy (Shannon entropy) was firstly proposed by C. E. Shannon as a criterion for analyzing and comparing probability distributions [11]. It provides a measure of information of any distribution and piece of information source.
It is now clear that the information entropy of an information source is related to the space division and the corresponding measurement defined on the space as the following form [13]:
where:
limited to and is a division of the information source, like the realizations of a random variable;
limited to is the measurement of the information source on the dividing space, much like a probability density function.
Like Shannon entropy, generalized information entropy can work as a criterion for interpretating a piece of information source. In the case of damage diagnosis, it can reveal useful information about the condition monitoring time series, which is associated with the damage dynamics of the structure or system.
Generalized information entropy methods have been applied in mechanical and structural faults diagnosis using structural health monitoring information as information source and damage sensitive features as measures [12, 13]. Nevertheless these generalized entropy-based diagnostic methods are still based on moment sensory condition monitoring time series and uncertain diagnostic results may be resulted [14, 15]. Therefore the concept of information exergy is discussed in the following subsection.
2.2. Information exergy
Exergy is defined as the maximum theoretical useful work obtained if a system is brought into thermodynamic equilibrium with the environment by means of processes in which the interacts only with this environment [16]. Exergetic analysis has been used in [17] for chiller health monitoring and performance assessment.
Before introduction of the information exergy, definition of moment condition monitoring time series should be cleared. It refers to one piece of sensory time series quickly acquired at one moment. While in a condition monitoring process serval sets of condition monitoring time series are recorded.
Recently, information exergy based on the generalized information entropy has been coined for rotating machinery vibration faults diagnosis in [18].
Information exergy, denoted as is a time cumulating function of information entropy as follows:
where:
is generalized information entropy of moment sensory condition monitoring time series at ;
and are the starting and ending moment of the condition monitoring process.
is called planar information exergy.
Planar information exergy is descreted as the following way to simplify the calculation and application:
where:
is the generalized information entropy of sensory condition monitoring time series at descreted moment ;
is a discrete moment in the interval and is the number of total descrete moments of the condition monitoring process.
Finally, all the are arranged into a vetor ( is the transposition operator). This vetor combines all the information in a condition monitoring process, thus more confident diagnostic decision can be made.
3. Structural damage diagnosis based on information exergy
Based on the information exergy given in the previous section, a structural damage identification method is proposed in subsection 3.1 with interpretations. And singular value spectrum information exergy is presented in subsection 3.2 to illustrate how information exergy-based features can be extracted.
3.1. Structural damage diagnostic method
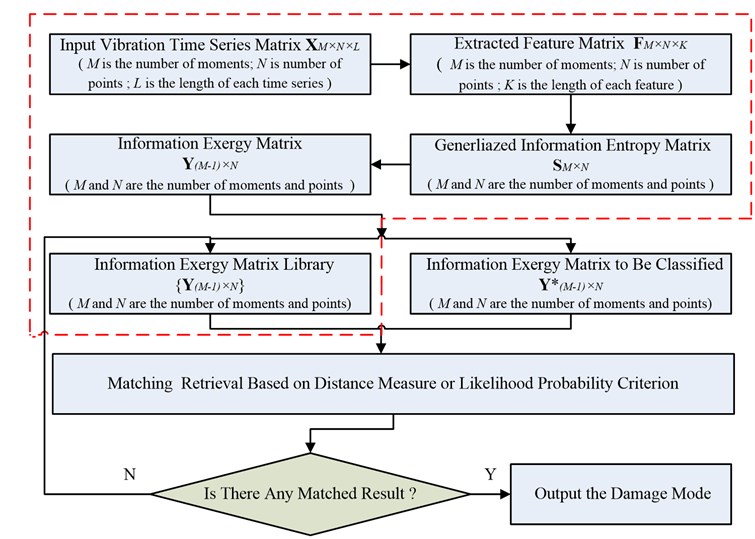
The proposed method for structural damage diagnosis (Fig. 1) primarily consists of two phases, the off-line learning phase (the part enclosed in the red dashed line) and the on-line exploiting phase as follows:
(1) Acquire vibrational signals through the data acquisition system, especially from the structural health monitoring system of the structure of interest.
(2) Extract features from the original vibration time series, such as singular value spectrum, wavelet packet decomposition power spectrum etc.
(3) Calculate the generalized information entropy pertaining to the extracted feature according to Eq. (1).
(4) Compute the information exergy related to the above information entropy with Eq. (3).
(5) Construct the information exergy library of typical damage modes of the interested structure which is to be used as a searching pool during the exploiting phase.
(6) Match retrieval based on similarity criterion (distance metrics or likelihood probability) when an unknown instance arrives.
(7) Make decision-whether to output matched damage mode(s), or to compile the unkown instance into the library as a typical damage mode itself.
Information exergy-based damage identification method is a generic framework that many kind of feature extraction techniques and similarity matching criterions can be embeded. Exergic features combining muti-moment condition monitoring time series can caputure the damage dynamics of the structure and reduce the uncertainty of the diagnostic results.
Fig. 1Flow chart of the structural damage diagnostic method based on information exergy
3.2. Extraction of singular value spectrum information exergy
Many kinds of information exergic features can be constructed to perform structural damage diagnosis. Here singular value spectrum information exergy is used to illustrate how information exergic features are extracted from the condition monitoring time series.
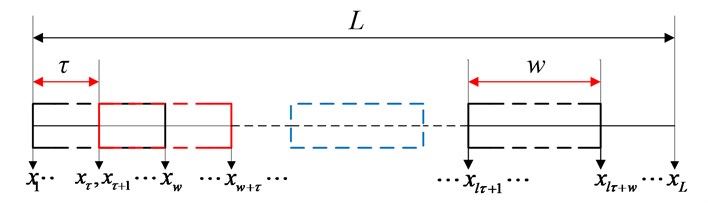
Firstly, the moment time series is embeded into the reconstructed phase space with an analysis window of width and time-delay (Fig. 2), thus its trajectory matrix is obtained as follows:
Note that when the time-delay equals unitary, then we get the Hankel matrix based trajectory matrices as in [19].
Then, the trajectory matrix is subjected to singular value decomposition [20]:
and the diagnal matrix is as the following form:
None-zero preserves principal information of the trajectory matrix and is defined as singular value spectrum of the original moment time series .
Singular value spectrum can be viewed as a division of the original moment time series in the singular value spectrum space with the following measure:
Thus generalized information entropy can be difined according to Eq. (1) using . Hereafter this kind of generalized information entropy is denoted as singular value spectrum infomation entropy (SVS-InEn).
Fig. 2Illustration of the trajectory matrix construction schematic
To some exent, SVS-InEn reflects the complexity of energy distribution of the moment time series in the singular value spectrum space. The larger the SVS-InEn is, the more disperse the energy is and the more complicated the moment time series is.
Based on the above analysis, one SVS-InEn can be derived for each moment time series using Eq. (7) and Eq. (1). Considering Eq. (3), corresponding singular value spectrum information exergy is obtained by combining results of all the moment time series together, hereafter abbrivated as SVS-InEx.
Further taking the multi-points sensory information into account, a SVS-InEx feature matrix can be obtained arranging multi-moment and multi-point condition monitoring information in the row and column, respectively:
where and are the number of total discrete moments and sensory points of the condition monitoring process.
Other types of information exergic feature can be constructed in a similar procedure. The SVS-InEx feature matrix merging time and space information of a structure as damage sensitive index will be applied to the damage diagnosis of a truss-like structure in the following section.
4. Experimantal case study and results analysis
Damage diagnosis of an experimental truss structure using information exergy-based method is studied in this setion. Damage modes of single and multipe bolt looseness are investigated in this case study as these kind of damages are more common in practice [21].
4.1. Experimental setup
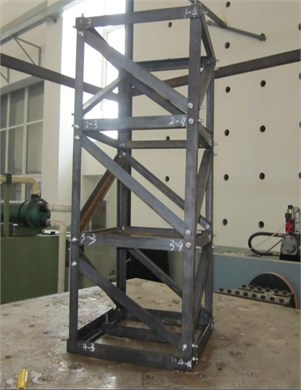
The structure (Fig. 3(a)) used in this study is a one by one bay three-story truss structure. It is composed of angle steel bolted together in the four vertices of each level and the dimension is 400 by 400 by 900 (in mm). To facilitate the management of the date files and damage scenarios, all the 16 vertices of the structure are marked as from the top to the bottom, where and are the level number and the vertices of each level, respectively. Each bolted point off-table is installed an acceleration sensor (Fig. 3(b)) to collect its vibrational time-series signal and total of 12 channel signals are acquired in every running. During the study, ES-15 hydraulic shaking table (Fig. 4) output a sine wave of 3 mm amplitude and 12 Hz frequency is employed in the experiment to excite the truss structure.
Fig. 3Three-story truss structure: a) overall view, b) details of the sensor installation
a)

b)
Fig. 4ES-15 hydraulic shaking table

4.2. Damage modes and data preparation
Three structural damage modes are considered in this case study and they are tabulated in Table 1. The structure was initially bolted by a dynamic wrench to work as benchmark undamaged condition. While bolt at the 1-2 point of the structure was loosed to simulate single bolt loosing damge mode 2 and both bolts at the 1-2 and 2-2 joint were released as multiple bolt loosness damge mode 3. During the tests, other factors that may have impacts on the diagnostic processes were tightly controlled to study potentials of the proposed information exergy-based method for damage identification.
Table 1Seeded damage modes
Damage mode | 1 | 2 | 3 |
Integrity | Single bolt looseness | Two bolt looseness |
During conditioning motoring process, four pieces of moment condition monitoring time series of acceleration signals were acquired. Each moment condition monitoring time series was sampled with a sampling frequency of 200 Hz and data points of 1 K with the Emerson 2130.
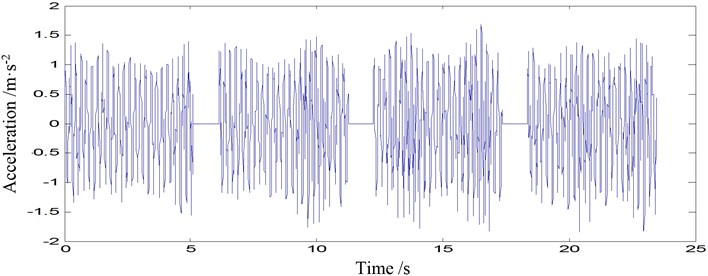
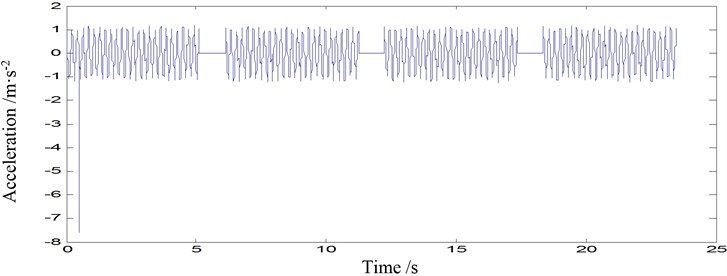
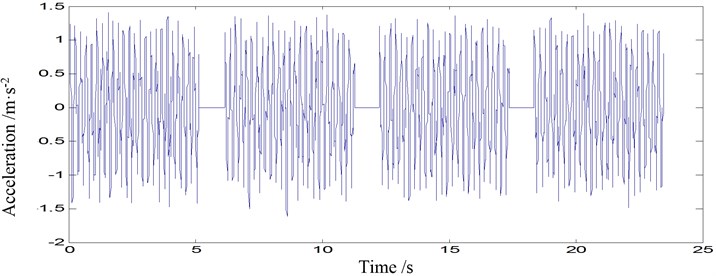
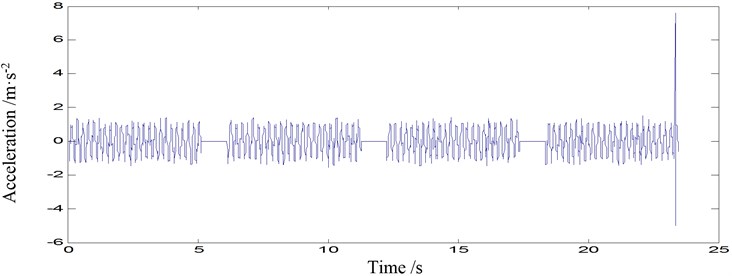
Fig. 5Acceleration time-histories of point 1-2 under three scenarios: a) damage mode 1, b) damage mode 2, c) damage mode 3
a)
b)
c)
4.3. Results and discussions
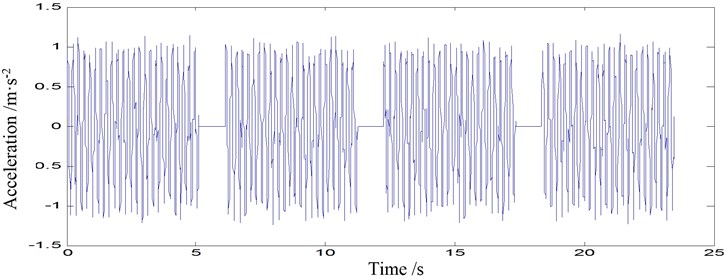
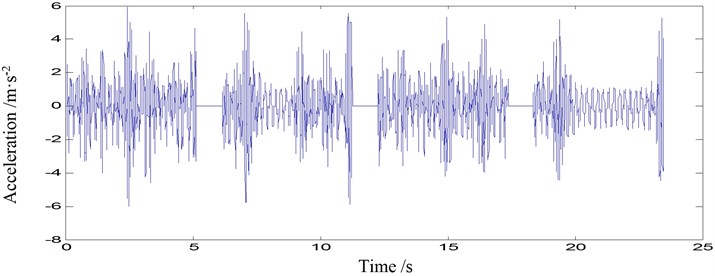
The acceleration signals of point 1-2 and point 2-2 under these three scenarios are illustrated in Fig. 5 and Fig. 6, respectively. For space reasons, the four pieces of time series of each scenario are plotted in the same subfigures with a spacing of 1 s (the corresponding flat parts).
Fig. 6Acceleration time-histories of point 2-2 under three scenarios: a) damage mode 1, b) damage mode 2, c) damage mode 3
a)
b)
c)
It is noticed that the moment time series from the same damage modes aquired consecutively demonstrated very different patterns, such as Fig. 6(a). Also, there are outliers in one of the four samples (Fig. 5(b) and Fig. 6(c)). Damage diagnosis based on these moment time series will result in uncertain or even errorous results.
4.3.1. Qualitative results with discussions
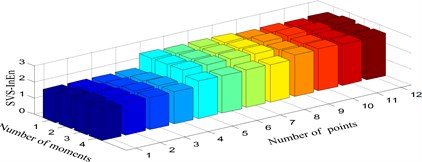
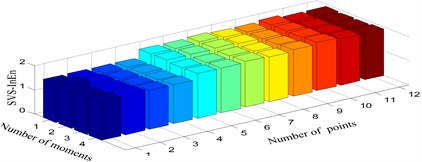
Four consecutive moment time series of the accleration of the chalked sensory points (Fig. 3) are employed for damage identification of each scenario. After data preprocesssing, the SVS-InEn and SVS-InEx features for the two bolt looseness damage modes are respectively shown in Fig. 7 and Fig. 8. Please note that the sensory pionts (1-1, 1-2, ..., 3-4, as marked in Fig. 3(a)) are sequentially denoted from 1 to 12.
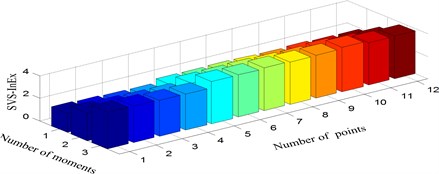
Fig. 7Singular value spectrum information entropy under three scenarios: a) Damage mode 1, b) Damage mode 2, c) Damage mode 3
a)
b)
c)
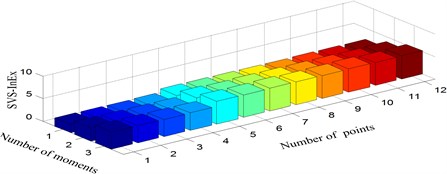
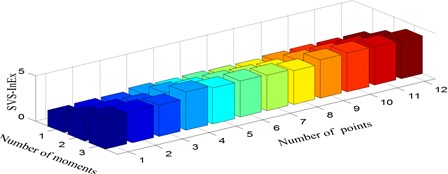
Fig. 8Singular value spectrum information exergy under three scenarios: a) damage mode 1, b) damage mode 2, c) damage mode 3
a)
b)
c)
Some results can be concluded from these two figures. Firstly, the SVS-InEn is inclined to decrease with the occurrence of bolt looseness and this is true as the less uncertainty one information source is the smaller the information entropy is. Secondly, although the SVS-InEn can differentiate damage mode 2 from damage mode 1, it can not identify the multiple bolt looseness (damage mode 3) from undamaged scenario (damage mode 1) with high confidence, because SVS-InEn of the two cases are both within almost the same range, i.e. 1~3 (Fig. 7). Thirdly, both the two damaged modes are regconized as different from the integrity mode by the SVS-InEx feature since SVS-InEx of the three senarios are varying within different ranges (Fig. 8). Finally, it is observed that the variance between damage mode 2 and damage mode 1 is much larger than that between damage mode 3 and damage mode 1, which is counter-intuition and needs further studies.
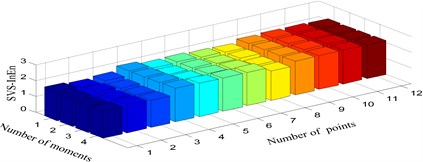
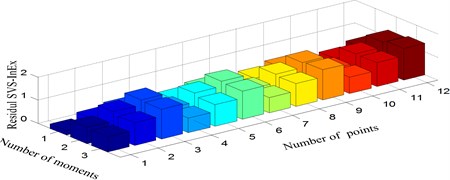
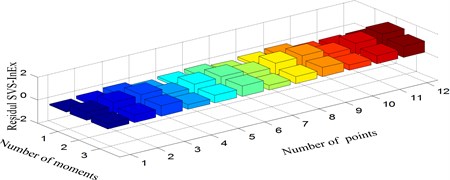
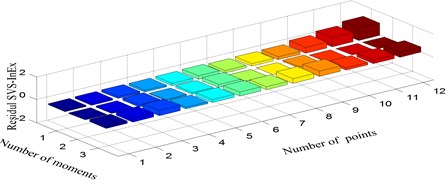
Fig. 9Residual singular value spectrum information exergy: a) damage mode 1 vs. 2, b) damage mode 1 vs. 3, c) damage mode 2 vs. 3
a)
b)
c)
4.3.2. Quantative results with discussions
To perform quantitative analysis, residual SVS-InExs (Fig. 9) are calculated firstly based on SVS-InEx of the three damage modes and then three indices are used in the similarity matching step.
The first two indices are common statistical features, i.e. absolute mean () and variance ():
where, is the entry of the residual SVS-InExs matrix. Absolute mean () and variance () of the residual SVS-InEx represents the average and fluctuation of the difference between two singular value spectrum exergy involved, respectively.
Also, the proximity () which was superior in [18] is employed here for comparing purposes:
Index demonstrates the closeness of the two SVS-InExs by interval.
Since the scenarios considered in the experimental study are not enough to perform learning and exploiting phase of the proposed damage diagnosis method individually, the same damage modes are used both in the two phases. Thus the above three extracted SVS-InExs are complied as the information exergy library in the learning phase, while in the exploiting phase they are also input as unknown structural damage mode to be classified. Damage identification results using the above three indices are presented in Table 2.
Table 2Damage diagnostic results based on SVS-InEx
Damage mode 1 vs. 2 | Damage mode 1 vs. 3 | Damage mode 2 vs. 3 | |
Absolute mean of the residual SVS-InEx (A) | 0.810 | 0.562 | 0.248 |
Variance of the residual SVS-InEx (V) | 0.126 | 0.174 | 0.048 |
Proximity of two SVS-InExs (P) | 1.480 | 1.150 | 0.478 |
All the three exergy-based indicators can discern the three damage scenarios with much margin and the largest ones of the three indices are marked bold. Similarly, the absolute mean () and proximity () indices of the SVS-InExs indicate that the biggest difference is between damage mode 1 and 2, while the variance () index captures the true severity of the bolt loosening. Thus indicator is better than in this case study.
Statistical significance tests of the performances for the proposed method and singular value spectrum exergy feature are not included in the present paper due to limited experimental data. Nevertheless, other exergy-based damage sensitive features, i.e. information exergy, wavelet packet decomposition information exergy and continuous wavelet transform information exergy are used in the damage diagnositic framework and similar promising results are obtained (see Appendix). With the increasing of samples from structural health monitoring system, thresholds for pre-warning of structural failure can be statistically defined and safety-guarantee actions can be prepared and taken beforehand.
5. Conclusions
A generic method based on information exergy for structural damage diagnostic is proposed in this paper to reduce uncertainty in the diagnosis process. Three damage modes seeded on a truss-type structure are all classified accurately both from qualitative and quantitative perspectives using information exergy method. Unlike information entropy or most other damage identification approaches, information exergy-based methods fuse muti-moment and multi-point information of a condition monitoring process to perform diagnosis, thus more reliable results can be obtained. Also information exergy feature demonstrates an increasing trend, which is desirable for structural diagnosis purposes.
Information exergy is still at its early stage of engineering applications, especially for structural engineering fieds. As the proposed method is also a quantitative analysis framework, it will apply not only to health monitoring and safety assessment of truss-type structures, but also to safety assessment of other engineering structures, such as bridges, high buildings, oil/gas pipelines and pressure vessels. Also, more factors that may have great influence on the information exergy-based damage diagnosis should be addressed in the future.
References
-
Ou J. P. Structural health monitoring in mainland China: review and future trends. Structural Health Monitoring, Vol. 9, Issue 3, 2010, p. 219-231.
-
Fan W., Qiao P. Z. Vibration-based damage identification methods: A review and comparative study. Structural Health Monitoring, Vol. 10, Issue 1, 2011, p. 83-111.
-
Yan Y. J., Cheng L., Wu Z. Y., Yam L. H. Development in vibration-based structural damage detection technique. Mechanical Systems and Signal Processing, Vol. 21, Issue 5, 2007, p. 2198-2211.
-
Ragulskis K. Some problems of nonlinear precise vibromechanics and vibroengineering (summary). Journal of Vibroengineering, Vol. 13, Issue 3, 2011, p. 590-618.
-
Lin T. K., Wang Y. P., Huang M. C., Tsai C. A. Bridge scour evaluation based on ambient vibration. Journal of Vibroengineering, Vol. 14, Issue 3, 2012, p. 1113-1121.
-
Li H. L., Deng X. Y., Dai H. L. Structural damage detection using the combination method of EMD and wavelet analysis. Mechanical Systems and Signal Processing, Vol. 21, Issue 1, 2007, p. 298-306.
-
Przytula K. W., Choi A. An implementation of prognosis with dynamic Bayesian networks. 2008 IEEE Aerospace Conference, March 1-8, 2008, Big Sky, MT, p. 1-8.
-
Sankararaman S., Mahadevan S. Uncertainty quantification in structural damage diagnosis. Structural Control and Health Monitoring, Vol. 18, Issue 8, 2011, p. 807-824.
-
Khazaee M., Ahmadi H., Omid M., Moosavian A. Vibration condition monitoring of planetary gears based on decision level data fusion using Dempster-Shafer theory of evidence. Journal of Vibroengineering, Vol. 14, Issue 2, 2012, p. 838-851.
-
Li H., Bao Y. Q., Ou J. P. Structural damage identification based on integration of information fusion and Shannon entropy. Mechanical Systems and Signal Processing, Vol. 22, Issue 6, 2008, p. 1427-1440.
-
Shannon C. E. A mathematical theory of communication. Mobile Computing and Communication Review, Vol. 5, Issue 1, 2001, p. 3-55.
-
Geng J. B., Huang S. H., Jin J. S., Chen F., Shen T., Liu W. A rotational machinery fault diagnosis method based on close degree of information entropy and evidence theory. Mechanical Science and Technology, Vol. 25, Issue 6, 2006, p. 663-666, (in Chinese).
-
Ren W. X., Sun Z. S. Structural damage identification by using wavelet entropy. Engineering Structures, Vol. 30, Issue 10, 2008, p. 2840-2849.
-
Doebling S. W., Hemez F. M. Overview of uncertainty assessment for structural health monitoring. Proceedings of the 3rd International Workshop on Structural Health Monitoring, September 17-19, 2001, Stanford, California.
-
Sankararaman S., Mahadevan S. Bayesian methodology for diagnosis uncertainty quantification and health monitoring. Structural Control and Health Monitoring, Vol. 20, Issue 1, 2013, p. 88-106.
-
Sciubba E. A brief commented history of exergy from the beginnings to 2004. International Journal of Thermodynamics, Vol. 10, Issue 1, 2007, p. 1-26.
-
George E. N., Bailey M. B., Domigan W. Health monitoring methodology based on exergetic analysis for building mechanical systems. Energy, Vol. 35, Issue 3, 2010, p. 1216-1223.
-
Chen F., Huang S. H., Yang T., Gao W., He G. Q. Information exergy diagnosis method of vibration faults of rotating machinery. Journal of Mechanical Engineering, Vol. 45, Issue 11, 2009, p. 65-71, (in Chinese).
-
Ragulskis M., Navickas Z. The rank of a sequence as an indicator of chaos in discrete nonlinear dynamical systems. Communications in Nonlinear Science and Numerical Simulation, Vol. 16, Issue 7, 2011, p. 2894-2906.
-
Kim J. B., Eun H. C. Damage detection based on the internal force or deformation variation. Journal of Vibroengineering, Vol. 14, Issue 1, 2012, p. 305-314.
-
Argatov I., Sevostianov I. Health monitoring of bolted joints via electrical conductivity measurements. International Journal of Engineering Science, Vol. 48, Issue 10, 2010, p. 874-887.
About this article

The research is supported by the National Natural Science Foundation of China (No. 51005015) and the Fundamental Research Funds for the Central Universities of China (No. 2302012FRF-TP-12-161A).
