Abstract
In order to improve the speed and accuracy of rolling bearing fault diagnosis on small samples, a method based on relevance vector machine (RVM) and Kernel Principle Component Analysis (KPCA) is proposed. Firstly, the wavelet packet energy of the vibration signal is extracted with the wavelet packet transform, which is used as fault feature vectors. Secondly, the dimension of feature vectors is reduced in order to weaken the correlation between the features. The important principal components are selected using KPCA as the new feature vectors under the criterion that the cumulative variance is greater than 95 %. Finally, the faults of rolling bearing are diagnosed through combining KPCA with RVM. Simulation experimental indicates the advantages of the presented method. Moreover, the proposed approach is applied to diagnoses rolling bearing fault. The results show that wavelet packet energy can express rolling bearing fault features accurately, KPCA can reduce the dimension of feature vectors effectively and the proposed method has better performance in the speed of fault diagnosis than the method based on support vector machine (SVM), which supplies a strategy of fault diagnosis for rolling bearing. In this paper, the performance of the proposed method is also compared with other diagnostic methods.
1. Introduction
Rolling bearings are common components in rotating machine and they are also prone to break down. Bearing faults can cause severe machine vibration and even damage the machine. About thirty percent of the rotating machinery failures are caused by the bearing fault according to statistics. Therefore, they have received much more attention in the field of condition monitoring and fault diagnosis. Mechanical vibration signals can reflect mechanical running condition and fault information [1]. Fault diagnosis based on vibration signals has been well developed for some years, and vibration signal analysis technique has been proven to be an effective approach for detecting [2, 3].The rolling bearing fault diagnosis methods mainly include two categories: (1) The methods based on signal processing technology which extract failure-frequency mainly from the bearing vibration signal, such as wavelet transform (WT) [4], Wigner-Ville transform (WVT) [5] and empirical mode decomposition (EMD) [6]; (2) Another methods to bearing diagnostics are statistical methods based on pattern recognition, namely, intelligent fault diagnosis. The different fault classes are distinguished relying on training a pattern recognition system with typical fault feature representing the different classes extracted from the bearing vibration signal, such as support vector machine (SVM) [7] and artificial neural network (ANN) [8]. They require some typical failure data for the training. In essence, intelligent fault diagnosis technology is a pattern recognition process. Fault feature extraction and intelligent classification are so important technology to mechanical fault diagnosis that they are the focus of research in the field of fault diagnosis. However, the vibration signal of rolling bearing fault is usually non stationary and non linear, so the traditional fault diagnosis methods are often difficult to achieve the desired results [9]. Fault diagnosis based on vibration signals has been well developed for some years, and vibration signal analysis technique has been proven to be an effective approach for detecting [2, 3].The rolling bearing fault diagnosis methods mainly include two categories: (1) The methods based on signal processing technology which extract failure-frequency mainly from the bearing vibration signal, such as wavelet transform (WT) [4], Wigner-Ville transform (WVT) [5] and empirical mode decomposition (EMD) [6]; (2) Another methods to bearing diagnostics are statistical methods based on pattern recognition, namely, intelligent fault diagnosis. The different fault classes are distinguished relying on training a pattern recognition system with typical fault feature representing the different classes extracted from the bearing vibration signal, such as support vector machine (SVM) [7] and artificial neural network (ANN) [8]. They require some typical failure data for the training. In essence, intelligent fault diagnosis technology is a pattern recognition process. Fault feature extraction and intelligent classification are so important technology to mechanical fault diagnosis that they are the focus of research in the field of fault diagnosis. However, the vibration signal of rolling bearing fault is usually non stationary and non linear, so the traditional fault diagnosis methods are often difficult to achieve the desired results [9]. Wavelet packets proposed by Coifman and Wicker-Hauser in 1992 is a generalized family of multi-resolution orthogonal basis [10]. Wavelet packet transform can analyze high frequency and low frequency, which is implemented by a basic two-channel filter bank that can be iterated over either a low-pass or a high-pass branch. The high frequencies information can be analyzed as well as low frequencies information in wavelet packet transform. Therefore, wavelet packet transform has been widely used in vibration signal analysis and fault feature extraction successfully [11, 12]. However, excessive decomposition levels easily lead to complexity of data processing. In addition, there is usually correlative between the features of the fault. Thereby, it is very important to extract the most sensitive fault features that reflect the fault and reduce dimension from high dimension data. For the complex and nonlinear data, the kernel principal component analysis (KPCA) is a simple and efficient method of dimension reduction [13]. KPCA is a effective tool to deal with the multivariable and nonlinear data, and its main idea is that it maps the original spatial data into high dimensional space by kernel function, transforms the original nonlinear problem to linearization one, and uses PCA to reduce the dimension.
Recently, the widely-used intelligent classification algorithms of fault types are ANN [14-16] and SVM [17-19]. Many of the studies proposed in the literatures present that these techniques can use feature vectors derived from vibration signal to classify fault types. However, these methods often need many training samples to train the classifiers. In fact, the training samples are difficult to obtain in industrial environment. The RVM is a machine learning technology based on an exploited probabilistic Bayesian learning framework similar to SVM, which was proposed by Tipping in 2001 [20]. RVM model is much sparser and require less training samples compared to SVM. Therefore, RVM is much more suitable to indentify the fault types based on the small samples. In recent years, RVM has been applied to the mechanical fault diagnostic research [21, 22], but it has not been gotten enough attention.
In this paper, a novel method based on RVM and KPCA is proposed to diagnose rolling bearing fault and obtain a higher fault diagnostic rate. The wavelet packet energy of rolling bearing vibration signal forms the feature vector utilizing ‘db’ wavelet packet. The dimension of feature vector is reduced to 2-dimensional under the standard that the cumulative variance is greater than 95 % by KPCA, which is used for classification. The experiment results demonstrate the effectiveness of the proposed method.
The rest of the paper is organized as follows. Section 2 gives the background knowledge of feature extraction. Section 3 provides a brief introduction of the kernel functions and discusses the selection of parameters. Section 4 reviews the algorithm of the RVM for classification and compares RVM with SVM. Section 5 verifies the method with artificial data set. Section 6 shows the application of the method in rolling bearing diagnosis and experimental results. The performance of the proposed method is also compared with other diagnostic methods. Finally, the conclusions and discussion follow in Section 7.
2. Feature extraction
The wavelet packet energy (WPE) is a very useful feature for signal analysis [2]. The th decomposition level and the th frequency band wavelet packet energy can be written as:
where is the th decomposition level and the th frequency band signal, is the th frequency band wavelet packet coefficient and is the number of coefficient.
The feature vector can be constructed by the wavelet packet energy of the th decomposition level:
It will bring inconvenience for the data analysis because is usually a larger value when the signal energy is stronger. So, the feature vector can be normalized:
Traditional principal component analysis (PCA) is a kind of linear transformation [23]. But, for some complicated cases in industrial environment, non-linear characteristics should be considered, such as the rotating machinery faults. PCA can't well reflect the nonlinear properties due to its linearity assumption. KPCA can efficiently compute principal components in high-dimensional feature spaces by the use of integral operator and nonlinear kernel functions [22]. Because the redundant fault features are easy to increase the classifier training time and reduce the class accuracy, it is essential to use KPCA to reduce the dimension of the feature vectors for decreasing the classifier training time and improving the class accuracy.
The definitions and formulation presented here follow closely the ones described in [13]. The reader can peruse to the reference for further details. Given a data set composed of samples , the key procedure of KPCA is computing the kernel matrix using kernel function:
where is a nonlinear mapping function and are samples in the original data. is kernel function which avoids the problem of solving nonlinear mapping.
For any testing vector , the principal component scores in the feature space can be calculated as:
where , is the number of nonlinear principal components that need to keep, is the normalized feature vector of matrix.
3. Compared RVM with SVM
The support vector machine (SVM) is widely used for fault recognition, however, it has some deficiencies [20, 24]:
1. The sparse solution of SVM is limited, and the number of support vector is sensitive to the number of error boundary as well as grows linearly with the size of training samples.
2. The output of SVM lacks the necessary information of probability, and it can not forecast the uncertainty in classification problems especially.
3. The kernel function must satisfy the Mercer condition, in other words, it must be positive definite, continuous and symmetric.
4. It is needed to estimate the trade-off parameter . It will be a waste of data as well as computation if the number of training samples is larger.
RVM can solve the above four deficiencies of the SVM effectively. RVM’s advantages rise due to its ability to yield a decision function that is much sparser than SVM, which maintains the high accuracy and favorable generalization capabilities. This may significantly reduce the computational complexity and make it more suitable for online and real-time applications. The best advantage of RVM is able to take full advantage of the less training samples which gets similar classification accuracy to the SVM. Besides, RVM can generate a probabilistic output.
For two-class classification, given a training data set composed of samples , , where is training sample target. The output of RVM can be written as:
where is the weights vector, and is the kernel function. In RVM, there is no necessity for Mercer kernels and no error/margin trade-off parameter. The classifier maps to (0, 1) by applying the logistic sigmoid link function . The data are assumed to be independently generated, and obey the Bernoulli distribution, and then the likelihood of the observed dataset can be written as:
In order to improve the generalization ability of the model, RVM adopts a separable Gaussian prior probability distribution for each weight:
where is the hyper-parameters to control the strength of the weight that controls the degree of deviation from zero mean of each weight. is the normal distribution function.
Based on likelihood distribution of sample set and prior probability distribution of weights, the posteriori probability distribution of model parameters can be calculated indirectly.
Given a training data set , the prediction distribution of the corresponding output can be written as:
Because the weight vector is difficult to use the general analytical method, it is needed to be calculated by Laplace approximation iteratively. In the iterative process, many tend to infinitesimal, so the corresponding weights can be approximated to zero and have been removed. Then a few non-zero weight vectors are remained so that the training of the RVM model is realized.
For the full details of RVM and the fast maximization method, the reader can peruse [20, 24].
4. Kernel functions
Two representative kernel functions can be chosen as follows:
• Polynomial kernel, , where is a positive integer;
• Radial basis kernel (RBF), , where is the width of the Gaussian kernel.
The parameters and are chosen a priori by the user. In general, the above kernel functions will give similar results if appropriate parameters are chosen. But appropriate parameters are difficult to be selected since we don’t know the nonlinear information of the process [22]. So, it is important to select the optimal parameters. In most cases, the radial basis function may present advantages due to its flexibility in choosing the parameter. The optimal parameter process of RBF is discussed in Section 6.
5. Simulation experiment and comparison study
In order to demonstrate the effectiveness and possible advantages of the proposed approach in this paper about dimensionality reduction and intelligent recognition in non-linear data, and illustrate the advantages of RVM compared to SVM, Iris-Fisher data set is utilized to demonstrate the properties and applications of the proposed method. Iris-Fisher data set is taken as the example of experimental analysis [25]. Iris-Fisher data set, composed of four characteristics, has three different plants data: Setosa, Virginica and Versicolor, with each plant having 50 samples. Setosa is linearity separable with the other two kinds samples but Virginica and Versicolor are nonlinear separable each other. Twenty Virginica samples and 20 Versicolor samples are selected randomly as the training samples, and remaining 30 Virginica samples and 30 Versicolor samples as the testing samples.
Before the simulation experiment, all the data have been normalized between 0 and 1 by arc-tangent function:
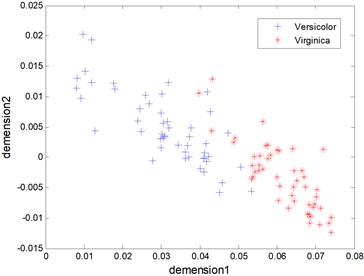
Figure 1 shows the distribution and distance in 2-dimensional space of Virginica data (as is shown with ‘*’) and Versicolor data (as is shown with ‘+’) KPCA, not the original 4-dimensional space [26, 27].
Fig. 1The kernel principal components of Virginica and Versicolor data
One classification results between Virginica and Versicolor of tesing samples that have been reduced dimension by KPCA are seen in Fig. 2 and Fig. 3, where ‘RVs’ refers to relevance vectors of training samples, ‘SVs’ refers to support vectors of training samples and ‘Acc’ refers to the accuracy of testing. The RBF is used both in RVM and SVM. It is seen that both RVM and SVM achieve identical classification accuracy, i.e. 91.33 %. However, the number of RVs is fewer than SVs’s (5 to 26).
In addition, the number of relevance vectors/support vectors, the accuracy of recognition, and the training time are compared using SVM and RVM. The results are shown in Table 1. Note that in Table 1, ‘No.RV’, ‘No.SV’, ‘Acc.Tr’, ‘Acc.Te’ and ‘Time.Tr’ denote the average number of RVs of training samples, the average number of SVs of training samples, the average accuracy of training samples, the average accuracy of testing samples, and the average training time, respectively.
Fig. 2The testing results of the RVM model (Acc = 91.33 %)
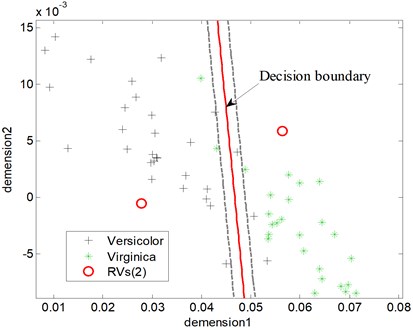
Fig. 3The testing results of the SVM model (Acc = 91.33 %)
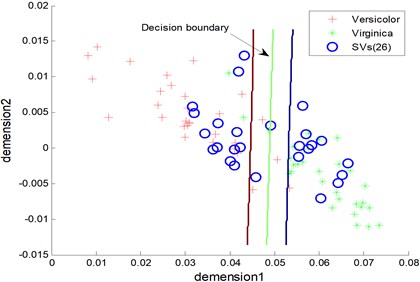
Table 1Comparison of classification performance between different methods
Method | Simulation experiment | |||
No.RV/No.SV | Acc.Tr | Acc.Te | Time.Tr (s) | |
RVM | 2.67 | 97.37 % | 93.18 % | 0.121 |
SVM | 29.21 | 97.35 % | 92.38 % | 0.004 |
RVM+KPCA | 2.51 | 97.43 % | 93.68 % | 0.028 |
From Table 1, it can be seen that the proposed approach has a little higher training accuracy, i.e., 97.43 %, which is higher than those of other methods, i.e., 97.35 % and 97.37 %. The other two methods have no dimension reduction on the data set, so the classification accuracy compared with the method proposed in this paper is relatively lower. The methods based on RVM needs much less relevance vectors than the one based on SVM. That is, the nonlinear relation between Virginica and Versicolor data is reduced by KPCA. So, the dimension-reduced data are relatively easy to be classed. Meanwhile, the testing accuracy of RVM is higher than SVM’s. Nevertheless, the training time of RVM is longer than SVM’s because RVM needs continuous iteration to construct the decision function in the process of sample training.
6. Example analysis and disccusion
Experimental data come from the Case Western Reserve University Bearing Data Center Website, which were collected from an induction motor driven mechanical system that is tested under 3 Hp loads. The bearing of the experiment is 6205-2RS JEM SKF with the sampling frequency equals to 12000 Hz and the rotating speed of shaft equals to 1774 rpm. The signals are sampled from four types of rolling element bearings and each class of data corresponds to the following bearing conditions, respectively, (i) normal status; (ii) inner raceway fault; (iii) rolling element fault; (iv) outer raceway fault. The length of each sample was 2048, so each kind of rolling bearing fault samples were 59. Twenty samples are selected randomly from each kind of bearing fault types to be training samples (80), and the rest samples are used as testing samples.
Fig. 4Block diagram of the proposed fault diagnosis stratey
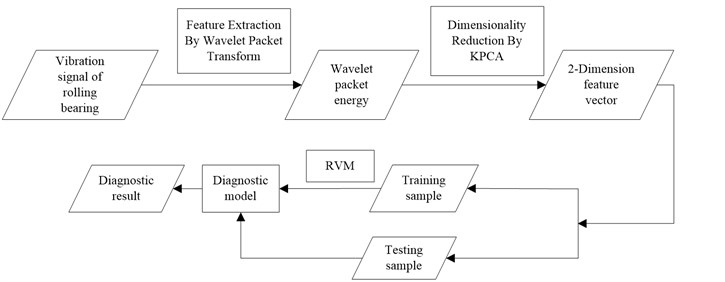
Figure 4 shows the block diagram of the proposed fault diagnosis strategy. The details of these steps are presented in the subsequent sections.
Firstly, the wavelet packet energy of all samples is extracted by ‘db16’ wavelet packet. The decomposition level and the eight decomposition frequency bands are achieved. Therefore, the dimension of the feature matrix is 236×8. Figure 1 displays the normalized wavelet packet energy of each rolling bearing type.
As shown in Fig. 5, it is obviously different among the first, second, fourth, seventh and eighth frequency band. It denotes that the wavelet packet energy of rolling bearings can be considered as the feature for classification.
Secondly, according to the discussion of Section 4, the RBF is utilized as the kernel function of KPCA. In accordance with the standard of the selection of kernel principal component mentioned in Section 1, the fault feature vector is processed with the application of KPCA. Two principal components of the fault feature are selected and form the new feature vector as input of the classifier, and the new feature matrix is 236×2. As shown in Fig. 6, four conditions of rolling bearing are distinguished intuitively.
Then, it is needed to realize the intelligent classification of rolling bearing failure using RVM. However, RVM and SVM are also proposed for two types of problems, which can not be directly applied to multi-class classification. One-against-one (OAO) and one-against-all (OAA) are the most commonly used methods. Suppose the samples have classes, the OAA method needs classifiers that the samples feature space is divided into regions. In general, the OAA strategy does not exactly get regions, but some additional regions, and the classification will be ambiguous in these regions. As shown in Fig. 7(a), the shaded part is the indecision regions. The OAO strategy needs to construct a classifier for every two classes of multi-classes. For classes, binary classifiers will be constructed. Obviously, this approach needs to construct much more binary classifiers than OAA. However, the strategy does not involve a problem that samples between two classes are uneven, and the indecision region is smaller than OAA as shown in Fig. 7(b). OAO usually performs better than OAA in classification accuracy [28]. Therefore, OAO is used here to recognize fault and six two-class classifiers are constructed.
Fig. 5Wavelet packet energy spectrum of different rolling bearing conditions
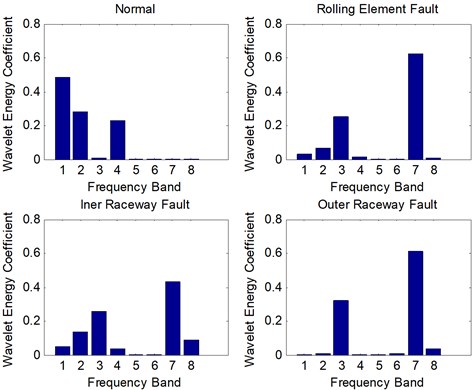
Fig. 6The kernel principal components of the fault samples
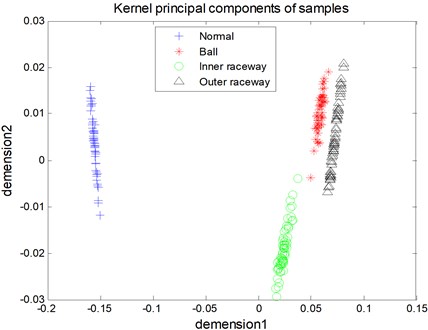
Fig. 7The possible ambiguity regions with several two-class classifiers realize multi-classes
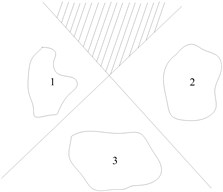
(a) OAA
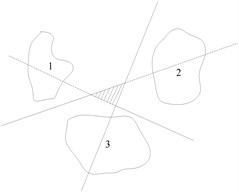
(b) OAO
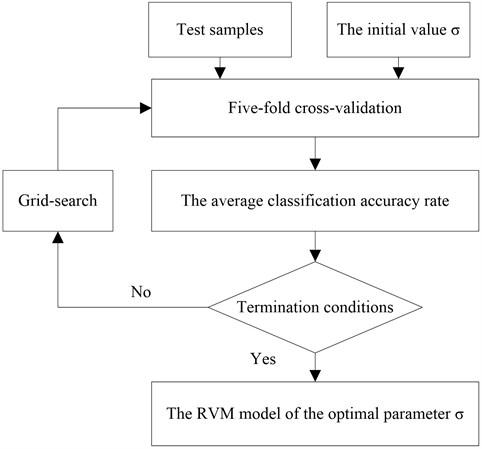
The RBF is also utilized as the kernel function of RVM. In order to improve the classification accuracy, it is needed to select proper kernel parameter of RVM. The grid-search technique and 5-fold cross-validation are used in this study to select the optimal parameter values of kernel functions. Five-fold cross-validation means: The samples are randomly divided into 5 subsets of similar size, which a subset is selected as the testing set in turn, and the remaining four subsets are training set. After 5 training-testing processes are finished, the average of five testing accuracy (the ratio of the total number of correctly classified sample and testing sample) is seen as the average classification accuracy rate, i.e., the average classification accuracy:
where is the accuracy of one testing process, , is the number of testing sample. Here . The process of optimized process of kernel parameter is shown in Figure 9.
Fig. 8The flow chart of the parameter optimization of training RVM
The classification results between ball fault and inner raceway fault of testing samples are seen in Fig. 9 and Fig. 10, where RVs refers to relevance vectors and SVs refers to support vectors. It is seen that both RVM and SVM achieve classification accuracy in 100 %. However, the number of RVs is fewer than SVs’s (5 to 14).
Some other methods are also used to diagnose rolling bearings faults with the same experiment data preparation to illustrate the advantage and disadvantage of the proposed method comprehensively. The diagnostic results using different methods are shown in Table 1. The meaning of the title in Table 2 is the same as Table 1, and ‘Time.Te’ denotes the average testing time.
Table 2Comparison of performance between different methods of rolling bearing fault
Method | Experimental results | ||||
No.RV/ No.SV | Acc.Tr | Acc.Te | Time.Tr (s) | Time.Te (s) | |
Method in this paper | 5.71 | 100 % | 100 % | 0.665 | 0.016 |
SVM+KPCA | 31.27 | 100 % | 100 % | 0.005 | 0.348 |
RVM+PCA | 7.13 | 98.69 % | 98.47 % | 1.356 | 0.183 |
Fig. 9The diagnosis result of testing samples using SVM
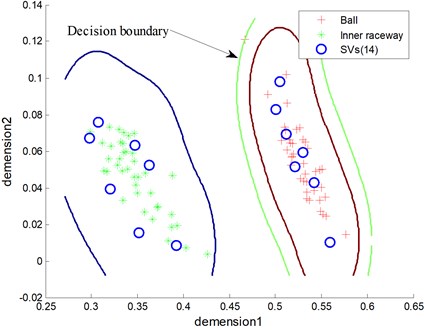
Fig. 10The diagnosis result of testing samples using RVM
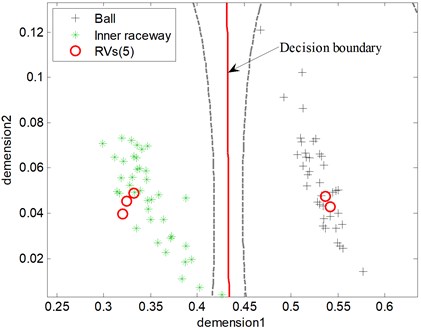
As listed in Table 2, different methods can achieve high and comparable classification accuracy. Specifically, the testing accuracy of the proposed method is 100 % and a little higher than the one combing RVM and PCA. The methods both can achieve the high diagnostic rate (100 %) based on SVM and RVM because the wavelet packet energy feature is linearly separable data after KPCA processed (Fig. 7). However, the average number of RVs is much less than the ones of SVs, i.e., 5.71 to 31.27. Theoretically, less relevance vectors lead to less computational time because the decision function of RVM is much simpler. Therefore, the proposed method has a faster testing time because of the simpler decision function. The fewer RVs imply a significant reduction in computational complexity of the decision classifier. Consequently, RVM is much more suitable in real application. The results denote that RVM not only has good generalization but also high classification accuracy. Although the proposed method needs more training time than other methods, i.e., 0.665 s, it does not affect the application in machine fault diagnosis. In engineering practice, the fault sample is relatively lack. Therefore, training time will not be too long in practical application.
In order to further illustrate the effectiveness of the proposed method in the recognition accuracy, it is also compared with other methods of rolling bearing fault diagnosis that have been proposed in the papers. Table 3 shows the different diagnosis method contains different processing technology, and the experimental data of bearing is the same. As can be seen from the table, the proposed method in this paper can obtain the highest diagnosis accuracy. In [29], the fault feature are mixed feature including WPE, wavelet package coefficients (WPC) and some statistical characteristics, while only WPE is used as the fault feature in this study and achieves a better result. In theory, the fewer features can reduce the complexity of the calculation. There is no dimension reduction of high-dimensional features in [30], and the classification ability of neural network is relatively lower, so its fault diagnosis rate is lower than other methods.
Table 3The diagnostic accuracy between different diagnostic methods of rolling bearing fault
Method | Fault feature | Feature extraction/selection | Classifier | Accuracy |
The propoesd method | WPE | KPCA | RVM | 100 % |
Ref. [29] | Mixed feature | The distance evaluation | SWM | 99 % |
Ref. [30] | WPC | None | ANN | 98.3 % |
7. Conclusions
This paper presents an integrated KPCA and RVM to realize intelligent fault diagnosis of rolling bearing using the wavelet packet energy coefficients as features, especially the problem of limited samples. To improve the performance of intelligent fault diagnosis, KPCA is utilized before classification as a pre-processing to reduce the dimension of feature. In this way, not only are the dimension of feature and the computational complexity reduced, but also the classification accuracy of RVM is improved, which makes the application of RVM more widely. The main advantages of this method are: (1) KPCA can reduce dimension effectively of non-liner and high-dimension data; (2) the samples are difficult to be acquired in real industrial environment, so RVM is much more suitable for fault diagnosis because it is much sparser than SVM. The study shows the proposed method is reliable and has the potential for use in rolling bearings fault diagnosis.
In industrial environments, because of the complexity of the rotating machine and other large equipment on the structure, it is rather common that several simultaneous faults evolve in a rolling bearing, which has brought great difficulties to diagnosis. When the simultaneous faults happen, the different and mixed fault characteristics present a nonlinear coupling relations, not a simple linear superposition relations. It is difficult to use mathematical model to describe them accurately. This paper only discusses the fault diagnosis method of single fault because we lack the sample data of simultaneous faults. We are planning to acquire the simultaneous faults data by fault simulation in the future. The future research direction is to examine the possibility of applying the method proposed here to diagnoses the simultaneous faults of rolling bearing. The simultaneous fault, such as rolling element and inner raceway fault, can be considered as one fault style and wavelet packet energy also can be the fault feature. We will also study other feature extraction technologys which reflect the fault characteristics of the differences effectively. The KPCA and RVM technology are effective on dimensional reduction and intelligent classification. Furthermore, the core problem is how to reduce the coupling between the simultaneous fault and the single fault. It is likely that the simultaneous fault problem will be overcome by the proposed method in the future.
References
-
Orhan S., Akturk N., Celik V. Vibration monitoring for defect diagnosis of rolling element bearings as a predictive maintenance tool: comprehensive case studies. NDT &E Internatonal, Vol. 39, Issue 4, 2006, p. 293-298.
-
Patil M. S., Mathew J., Rajendra Kumar P. K. Bearing signature analysis as a medium for fault detection: A review. Journal of Tribology-Transactions the Asme, Vol. 130, 2008, p. 0140011.
-
Ma H., Huang J., Zhang S. Y., et al. Nonlinear vibration characteristics of a rotor system with pedestal looseness fault under different loading conditions. Journal of Vibroengineering, Vol. 15, Issue 1, 2013, p. 406-418.
-
Kankar P. K., Sharma S. C., Harsha S. P. Rolling element bearing fault diagnosis using autocorrelation and continuous wavelet transform. Journal of Vibration and Control, Vol. 17, Issue 14, 2011, p. 2081-2094.
-
Zhou Y., Chen J., Dong G. M., et al. Wigner-Ville distribution based on cyclic spectral density and the application in rolling element bearings diagnosis. Proceedings of the Institution of Mechanical Engineers Part C-Journal of Mechanical Engineering science, Vol. 225, Issue 2, 2011, p. 2831-2847.
-
Zhu K. H., Song X. G., Xue D. X. Incipient fault diagnosis of roller bearings using empirical mode decomposition and correlation coefficient. Journal of Vibroengineering, Vol. 15, Issue 2, 2013, p. 597-603.
-
Moosavian A., Ahmadi H., Tabatabaeefar A. Fault diagnosis of main engine journal bearing based on vibration analysis using Fisher linear discriminant, K-nearest neighbor and support vector machine. Journal of Vibroengineering, Vol. 14, Issue 2, 2012, p. 894-906.
-
Jayaswal P., Verma S. N., Wadhwani A. K. Development of EBP-Artificial neural network expert system for rolling element bearing fault diagnosis. Journal of Vibration and Control, Vol. 17, Issue 8, 2011, p. 1131-1148.
-
Randall R. B., Antoni J. Rolling element bearing diagnostics-A tutorial. Mechanical Systems and Signal Processing, Vol. 25, Issue 2, 2011, p. 485-520.
-
R. R. Coifman, M. V. Wickerhauser Entropy-based algorithms for best basis selection. IEEE Trans. Inform. Theory, Vol. 38, 1992, p. 713-718.
-
He Q. B. Vibration signal classification by wavelet packet energy flow manifold learning. Jouranal of Sound and Vibration, Vol. 332, Issue 7, 2013, p. 1881-1894.
-
Ramirez-Villegas J. F., Ramirez-Moreno D. F. Wavelet packet energy, Tsallis entropy and statistical parameterization for support vector-based and neural-based classification of mammographic regions. Neurocomputing, Vol. 77, Issue 1, 2012, p. 82-100.
-
Scholkopf B., Smola A., Muller K. R. Nonlinear component analysis as a kernel eigenvalue problem. Neural Computation, Vol. 10, Issue 5, 1998, p. 1299-1319.
-
Chen C. H., Shyu R. J., Ma C. K. Rotating machinery diagnosis using wavelet packets-fractal technology and neural networks. Journal of Mechanical Science and Technology, Vol. 21, Issue 7, 2007, p. 1058-1065.
-
Niu Y. M., Wong Y. S., Hong G. S., et al. Multi-category classification of tool conditions using wavelet packets and ART2 network. Journal of Manufacturing Science and Engineering-transactions of the Asme, Vol. 120, Issue 4, 1998, p. 807-816.
-
Wu J. D., Chan J. J. Faulted gear identification of a rotating machinery based on wavelet transform and artificial neural network. Expert Systems with Applications, Vol. 36, Issue 5, 2009, p. 8862-8875.
-
Kumar H., Kumar T., Amarnath M., et al. Fault diagnosis of antifriction bearings through sound signals using support vector machine. Journal of Vibroengineering, Vol. 14, Issue 4, 2012, p. 1601-1606.
-
Widodo A., Yang B. S. Support vector machine in machine condition monitoring and fault diagnosis. Mechanical Systems And Signal Processing, Vol. 21, Issue 6, 2007, p. 2560-2574.
-
Li L. M., Wen G. R., Ren J. Y., et al. Genetic algorithm for Lagrangian support vector machine optimization and its application in diagnostic practice. Journal of Vibroengineering, Vol. 15, Issue 1, 2013, p. 1-8.
-
Tipping M. E. Sparse Bayesian learning and the relevance vector machine. Journal of Machine Learning Research, Vol. 1, Issue 3, 2001, p. 211-244.
-
Tolambiya A., Venkatraman S., Kalra P. K. Content-based image classification with wavelet relevance vector machines. Soft Computing, Vol. 14, Issue 2SI, 2010, p. 129-136.
-
Widodo A., Kim E. Y., Son J. D., et al. Fault diagnosis of low speed bearing based on relevance vector machine and support vector machine. Expert Systems with Applications, Vol. 36, Issue 3, 2009, p. 7252-7261.
-
Pearson K. On lines and planes of closest fit to systems of points in space. Philosophical Magazine, Vol. 2, 1901, p. 559-872.
-
Tipping M. E., Faul A. C. Fast marginal likelihood maximization for sparse Bayesian models. Proceedings of the Ninth International Workshop on Artificial Intelligence and Statistics, NJ, USA, 2003.
-
P. Vlachos StatLib. http://lib.stat.cmu.edu.
-
Zhou J., Dasgupta D. Augmented negative selection algorithm with variable-coverage detectors. CEC2004. Institute of Electrical and Electronics Engineers Inc., 2004, p. 1081-1088.
-
Luo, W., Wang, X., Tan, Y., et al. A novel negative selection algorithm with an array of partial matching lengths for each detector. Lecture Notes in Computer Science. Springer Verlag, 2006, p. 112-121.
-
Hsu C. W., Lin C. J. A comparison of methods for multiclass support vector machines. IEEE Transactions on Neural Networks, Vol. 13, Issue 2, 2002, p. 415-425.
-
Hu Q., He Z. J., Zhang Z. S., et al. Fault diagnosis of rotating machinery based on improved wavelet package transform and SVMs ensemble. Mechanical Systems And Signal Processing, Vol. 21, Issue 2, 2007, p. 688-705.
-
Wang G., Wang Z. L., Qin X. D., et al. Accurate diagnosis of rolling bearing based on wavelet packet and RBF neural networks. Journal of University of Science and Technology Beijing, 2007, p. 184-187.
About this article
The authors would like to thank Case Western Reserve University for their providing free download of the rolling element bearing fault data sets. This work is supported by National Natural Science Foundation of China (51175316) and the Specialized Research Fund for the Doctoral Program of Higher Education (20103108110006). The authors also thank the anonymous reviewers and the editor for their valuable comments.
