Abstract
Lamb wave testing is one of the important methods in ultrasonic nondestructive testing. One of the key technologies in the Lamb wave testing is to get a clear signal. In this paper, a signal retrieval method for the Lamb wave signal from noisy signals is presented on the basis of its wavelet ridge analysis. After the wavelet transformation, the wavelet ridge of the Lamb wave signal is extracted and the signal is reconstructed by using its ridge as the characteristic parameter. Experimental results show that the Lamb wave signal is retrieved in the case of the white noise, the transient noise and the sine noise. The proposed method can retrieve the ultrasonic Lamb wave signal effectively.
1. Introduction
Ultrasonic Lamb wave is a kind of ultrasonic plate wave which propagates in the thin layer. In comparison with the bulk wave point-by-point scanning method, Lamb wave testing is one of the important methods to detect the defects and the material acoustical property of plate structure. It has long propagation distance and allows wide detection range once [1, 2].
One of the key technologies in the Lamb wave testing is to get a clear Lamb signal. However, due to the influence of noises, the experimentally received Lamb wave signals are always mixed with all kinds of noise signals caused by the interference and other sources in practice. Those noises greatly impact the accuracy of the Lamb wave testing. A signal retrieval method is very crucial before an experimental Lamb wave signal is analyzed and explained [3].
There are a lot of scholars to study the Lamb wave signal retrieval and denoising methods [4-10]. Cawley use the 2-d Fourier transform to the Lamb wave signals [4]. The empirical mode decomposition (EMD) method decomposed a noisy Lamb signal into a series of almost orthogonal components that do not overlap in the frequency. [5]. The WT method is widely used in the field of nondestructive testing because of its advantage in signal de-noising. Siqueira processes the experimental Lamb wave signal by using the fix-threshold-value discrete wavelet transform. The wavelet coefficients less than the given threshold are omitted [6]. Lazaro uses the wavelet transform to eliminate the noise with fixed threshold and soft threshold respectively [7]. Matz analyzed the echo signal with a variety of time-frequency methods, and discussed the advantages and disadvantages of various methods [8].
To further study the denoising method in enhancing the resolution and the SNR of the Lamb wave signal, this paper presents a signal retrieval method for the Lamb wave signal with noises on the basis of the signal wavelet ridge analysis. We first perform the wavelet transformation to the signal, and then the ridge of the signal is extracted. Finally, we recover the Lamb wave signal by using its ridge as the characteristic parameter. Experimental results show that the proposed method can retrieve the ultrasonic Lamb wave signal effectively.
2. Proposed Lamb wave signal retrieval method
Lamb wave signal in the time-frequency plane exits a relatively energy concentrated, distributed more prominent position, similar to a topographic map of the ridge [11]. The ridge and the original signal are closely linked [12]. It can be used to extract parameters of the signal, and achieve the original signal reconstruction purposes. For the Lamb wave signal with noise, noise is the broadband signal, its energy distributes in the entire time-frequency plane. The noise is reflected in the time-frequency plane range and the Lamb wave signal energy is concentrated on the ridge position. So the wavelet ridge can be used to reconstruct the signal with denoising function.
Our proposed method mainly consists of three steps. Firstly, the wavelet transform is performed to the original noisy Lamb signal to obtain its decomposition in the time-scale domain. Next, the wavelet ridge of the signal is extracted. Finally, the inverse wavelet transform is used to retrieve the Lamb wave signal by using its ridge as the characteristic parameter.
Supposed a received signal Lamb wave signal is:
where denotes the time, denotes the signal amplitude, and denotes the signal phase. It is expressed as the function of the dual parameters scale , and time by using the basic wavelet functions .
Supposed and , we have:
where is a correction, which is negligible when . There is within the wavelet set. From equation 3, when , has the maximum and is wavelet ridge point. So is the amplitude of the wavelet ridge point and denotes the location. On the ridge, the corresponding ridge amplitude is:
The corresponding wavelet ridge point is deduced by the solution of the following equation:
From equations (3) and (4), the ridge shows the most similar feature to the original signal, and the scale value of ridge point location corresponds to the changes of signal instantaneous frequency. The main parameters of each signal component can be extracted from the respective ridge information. By using the ridge, the retrieval Lamb signal is:
where is the time and is the integral variable.
3. Experimental setup
To evaluate the proposed method in practical applications, it has been applied to experimentally obtained Lamb wave signals.
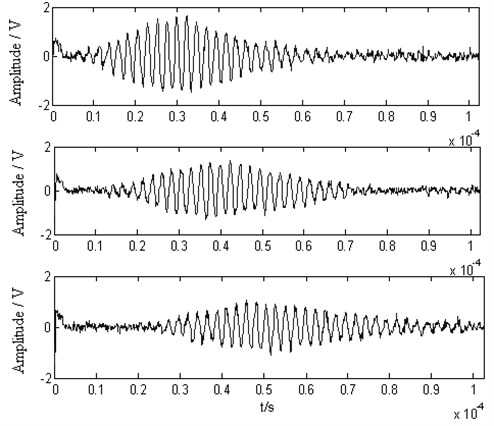
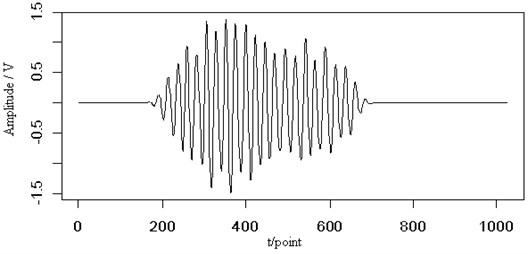
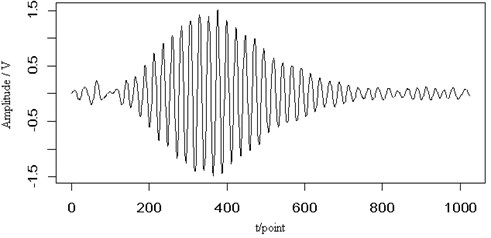
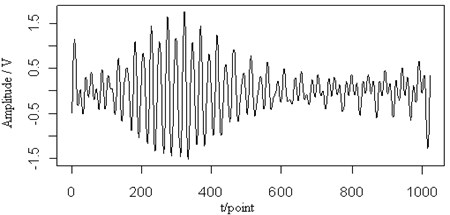
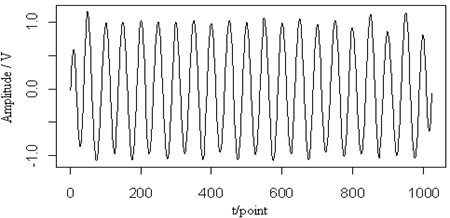
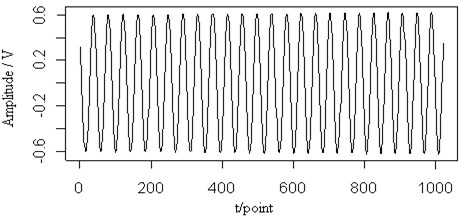
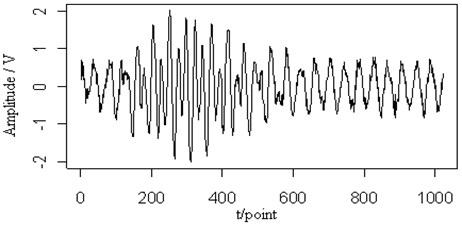
The experimental setup used in this paper is composed of the exciting transducer, receiving transducer, the RS232C interface, the digital ultrasonic compositive detector CTS-3000, and the computer as shown in the Fig. 6 of the reference 3. All experimental procedures are controlled by the compositive detector or computer. The digital ultrasonic compositive detector sends the excitation pulse signal and receives the measured ultrasonic Lamb signal. The workpiece is a stainless steel plate with a thickness of 0.97 mm. The piezoelectric oblique longitudinal transducers with the central frequency of 2.5 MHz are used to excite and receive signals. The wedge is used as the coupling between the transducers and the workpiece. The experimental data are sent to the computer via the RS232 serial interface. The software named US3000 V1.0 records and analyzes the experimental data on the computer. The data and waveforms are stored as text files for later off-line processing on the Matlab platform. Fig. 1 shows the experimental signals at the propagating distances of 3.5 cm, 5 cm, and 7 cm.
Fig. 1The experimental Lamb wave signals at the propagating distances of 3.5 cm, 5 cm, and 7 cm
4. Results and discussion
The Lamb wave signal processed in this paper has been implemented in the R environment [13]. The experimental collected Lamb signals containing little noises as shown in Fig. 1 is analyzed with the sampling frequency of 10 MHz. The central frequency is 0.42 MHz. The signals are received at the propagating distances of 3.5 cm, 5 cm, and 7 cm from the exciting source, respectively. As the increase of propagation distance, the pulse width of signals increase but the amplitudes decrease. For each signal, we use the Morlet wavelet, and then the continuous wavelet transform is computed for 1000 different values of scale.
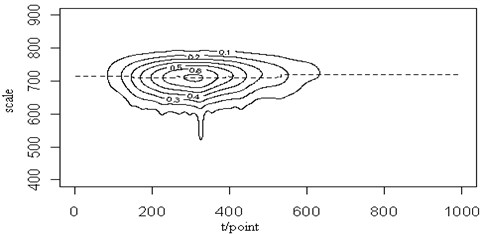
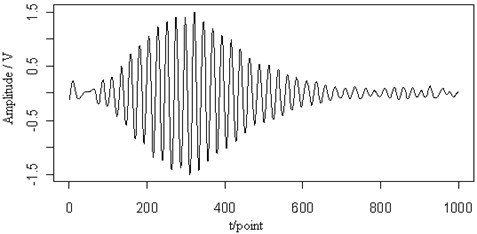
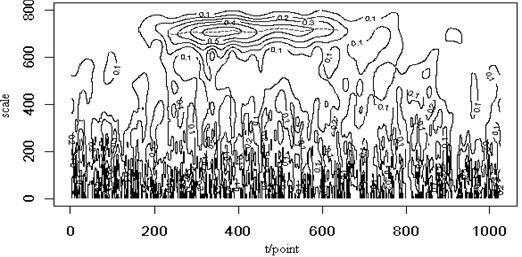
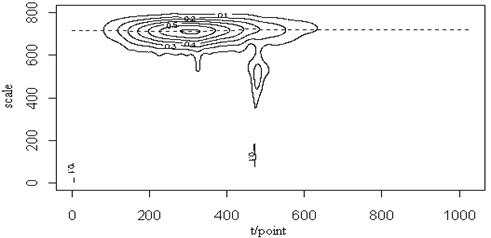
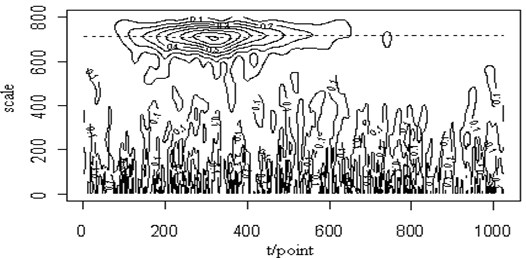
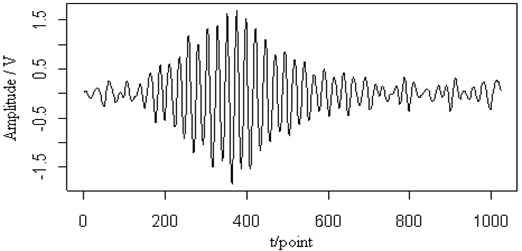
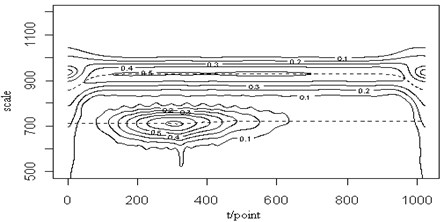
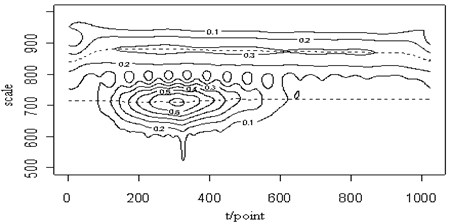
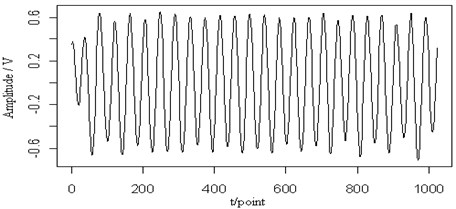
After the wavelet transform, Fig. 2(a) shows the contour map and the ridge (dotted line) of the Lamb wave signal at a propagating distance of 3.5 cm. The dotted line shows the wavelet ridge. On the basis of this ridge, the retrieved signal is shown in Fig. 2(b). In comparison with the original signal, the little noise is removed effectively. In the main pulse, the signal amplitude slightly reduced and the signal smoothness is improved. The features of the original signal can be recovered. The same conclusion can be drawn from the retrieved signals at the propagating distance of 5 cm shown in Fig. 3.
Fig. 2The contour map (a) and the retrieved signal, (b) of the Lamb wave at a propagating distance of 3.5 cm
(a)
(b)
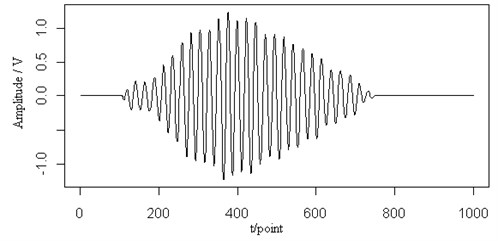
Fig. 3The retrieved Lamb wave signals at a propagating distance of 5 cm
To further evaluate the proposed method, we mixed the Lamb wave signal with different types of noises and use the proposed method to process the signal.
4.1. The white noise
In this section, it is supposed that the original signal is the Lamb signal at a propagating distance of 5 cm.
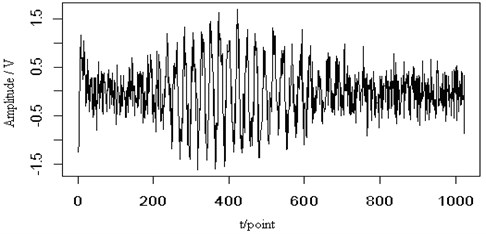
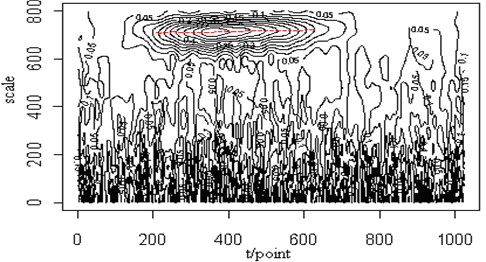
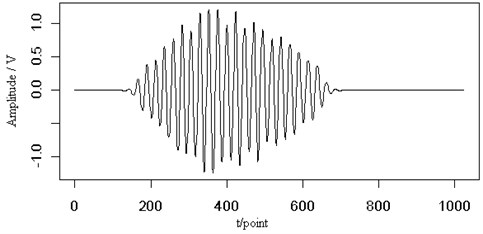
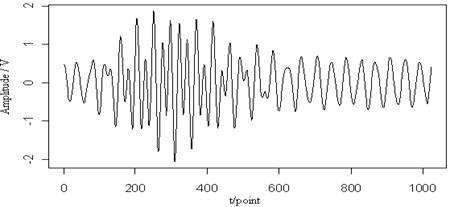
In Fig. 4(a), a white noise has been added to the original Lamb wave signal with signal-noise-ratio (SNR) 10. From the figure we can see the outline of the original signal. Fig. 4(b) shows the contour map of the continuous wavelet transform and the ridge (dotted line) of the Lamb wave signal at a propagating distance of 5 cm. Judging from the corresponding energy distribution, the noise has little effect on the Lamb wave signal and its ridge can be extracted from the contour distribution. Fig. 4(c) is the retrieved Lamb wave signal based on the ridge in Fig. 4(b). From the view of the signal amplitude and the shape, the retrieved signal is very close to the original signal. It is implied that the ridge can be extracted and the signal can be retrieved effectively from the noisy signal.
Fig. 4The noisy signal (SNR=10) (a), the contour map (b) and the retrieved signal (c) of the Lamb wave at a propagating distance of 5 cm
(a)
(b)
(c)
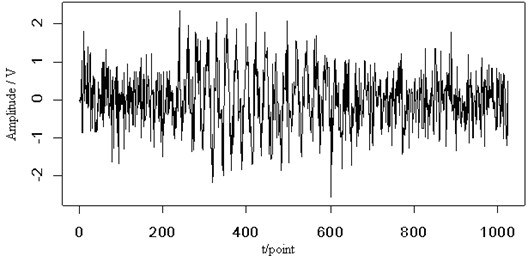
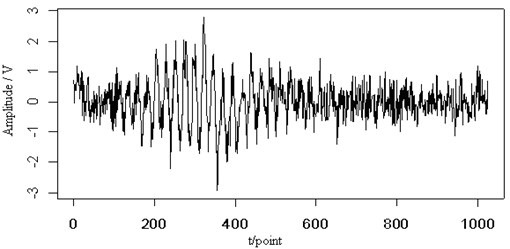
In Fig. 5(a), a white noise has been added to the original Lamb wave signal with the 5. From the figure, the original signal has overwhelmed by the noise, it is difficult to distinguish the shape of the original signal. Fig. 5(b) shows the contour map of the continuous wavelet transform and the ridge (dotted line) of the Lamb wave signal. Judging from the corresponding energy distribution, the signal is influenced by the noise and the energy distribution is the same as that of the original one. The value of the energy distribution is slightly higher than the original signal. However, The ridge of the signal is almost not affected by the noise and can clearly be extracted. Fig. 5(c) is the retrieved Lamb wave signal based on the ridge in Fig. 5(b). The retrieved signal is consistent with the original signal. There are clear signal shape changes. The signal has a certain degree of distortion. If we know in advance the characteristics of the signal extracted, such as the envelope of the Lamb wave signal, the distortion would be reduced. Anyway, the ridge can reflect the characteristics of the original signal.
Fig. 5The noisy signal (SNR=5) (a), the contour map (b) and the retrieved signal (c) of the Lamb wave at a propagating distance of 5 cm
(a)
(b)
(c)
4.2. The transient noise
In this section, it is supposed that the original signal is the Lamb signal at a propagating distance of 3.5 cm.
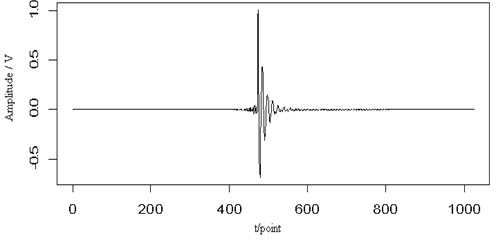
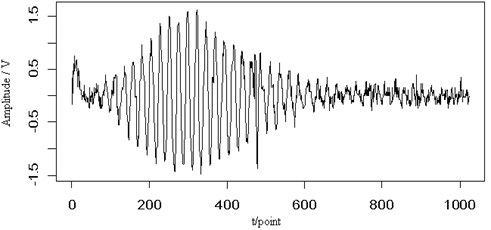
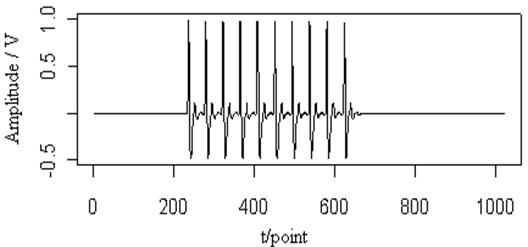
In Fig. 6(a), a transient signal is shown and has been added to the original Lamb wave signal in Fig. 6(b). From the figure we can see that some parts of the signal amplitude have been changed. Fig. 6(c) shows the contour map of the continuous wavelet transform and the ridge (dotted line) of the Lamb wave signal. Judging from the corresponding energy distribution, the transient noise has little effect on the Lamb wave signal and its ridge can be extracted from the contour distribution. Fig. 4(d) is the retrieved Lamb wave signal based on the ridge in Fig. 4(c). Although some parts of the signal amplitude changed, the energy distribution in the contour map can clear separate those two signals. The ridge of the signal is almost not affected by the noise and can clearly be extracted. The retrieved signal is still very close to the original signal. It implies that the ridge can be extracted and the signal can be retrieved effectively from the transient noise signal.
Fig. 6The transient signal (a), the mixed signal (b), the contour map (c) and the retrieved signal (d) of the Lamb wave at a propagating distance of 3.5 cm
(a)
(b)
(c)
(d)
In Fig. 7(a), multi-transient signals are shown and has been added to the original Lamb wave signal in Fig. 7(b). From the figure, when those two signals mixed, it has been difficult to identify the original signal waveform. Fig. 7(c) shows the contour map of the continuous wavelet transform and the ridge (dotted line) of the Lamb wave signal. The corresponding energy distribution is very different from that of the original signal. But its ridge is the same as that of the original one and can be extracted from the contour distribution. Fig. 7(d) is the retrieved Lamb wave signal based on the ridge in Fig. 7(c). The retrieved signal is still very close to the original signal. So the ridge can be extracted and the signal can be retrieved effectively from the multi-transient noise signals.
Fig. 7The transient signal (a), the mixed signal (b), the contour map (c) and the retrieved signal (d) of the Lamb wave at a propagating distance of 3.5 cm
(a)
(b)
(c)
(d)
Fig. 8The 0.2 MHz sine signal (a), the mixed signal (b), the contour map (c), the retrieved Lamb wave signal (d) and the retrieved sine signal (e) at a propagating distance of 3.5 cm
(a)
(b)
(c)
(d)
(e)
From the above analysis in this section, when the Lamb wave signal contains transient noise signals, the wavelet ridge can keep the characteristics of the original signal. So the original Lamb wave signal can be retrieved for the following analysis and signal processing.
4.3. The sine noise
In this section, it is supposed that the original signal is the Lamb signal at a propagating distance of 3.5 cm.
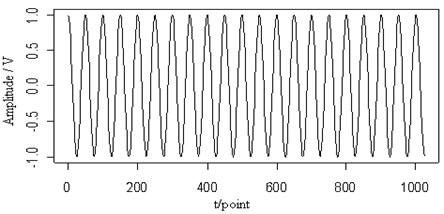
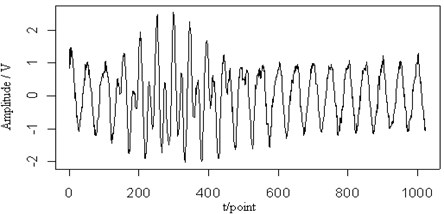
In Fig. 8(a), a sine signal with the frequency 0.2 MHz is shown and has been added to the original Lamb wave signal in Fig. 7(b). From the figure, when those two signals mixed, it has been difficult to judge the original signal waveform. Fig. 7(c) shows the contour map of the continuous wavelet transform and the ridges (dotted lines) of the mixed signal. We can see two signal components in the time-frequency plane are separate. But two signals at frequencies close to each other have already a little impact. The edge of the signal is not as smooth as that of the other parts, particularly with respect to the Lamb wave in comparison to the original signal. However, the ridges of the two signals can be extracted. Fig. 7(d) and (e) are the retrieved Lamb wave and sine signals based on their ridges in Fig. 7(c). It is shown that the Lamb wave signal is separated from the sine signal and the amplitude and waveform of the retrieved Lamb wave signal are consistent with the original signal.
In Fig. 9(a), a sine signal with the frequency 0.3 MHz is shown and has been added to the original Lamb wave signal in Fig. 9(b). Fig. 9(c) shows the contour map of the continuous wavelet transform and the ridges (dotted lines) of the mixed signal. We can see two signal distributions in the time-frequency plane are overlapped and influent each other. The ridge of the Lamb signal is different from that of the original. Fig. 9(d) and (e) are the retrieved Lamb wave and sine signals based on their ridges in Fig. 9(c). From the reconstructed signal, we can see that the sine single is retrieved well, but the Lamb wave signal is more close to the mixed signal, regardless of the amplitude or the waveform of the signal. It is shown that, when the frequency of the sine wave is close to the central frequency of the Lamb wave signal, the retrieved Lamb signal may exhibit characteristics inconsistent with the original signal.
4.4. Comparison with other methods
To more further evaluate and analyse the proposed method, we compare the proposed method with other Lamb wave signal analysis methods, including the short-time Fourier transform (STFT) method, the Wigner-Ville (W-V) method, and the EMD method. In this section, it is supposed that the signal is the Lamb signal at a propagating distance of 5 cm shown in Fig. 1.
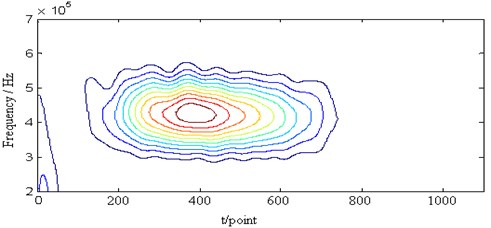
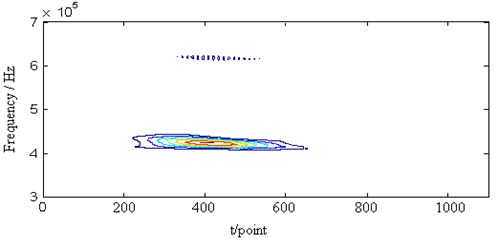
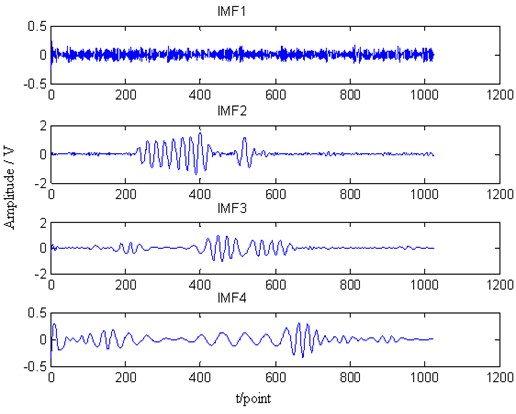
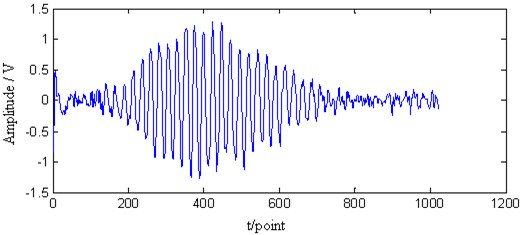
In Fig. 10(a), the STFT of the Lamb wave signal at a propagating distance of 5cm is shown. The frequency resolution is inferior to the proposed method. Fig. 10(b) shows the Wigner-Ville distribution in the time-frequency domain. The frequency resolution is better than the STFT method. However, there is an obvious cross part between the signal and the noise. Fig. 10(c) shows the intrinsic mode functions after adopting the EMD method. The IMF1 is considered as the noise. The IMF 2 to 4 is disturbed by the noise. So the denoising effect is not well as shown in Fig. 10(d) – the retrieved signal contains the obvious noise. From the above analysis, the proposed method is superior to the other methods in the Lamb wave signal retrieval.
Fig. 9The 0.3 MHz sine signal (a), the mixed signal (b), the contour map (c), the retrieved Lamb wave signal (d) and the retrieved sine signal (e) at a propagating distance of 3.5 cm
(a)
(b)
(c)
(d)
(e)
Fig. 10The STFT of the Lamb signal (a), the W-V transform of the Lamb wave signal (b), the EMD of the Lamb wave signal (c), and the retrieved Lamb wave signal (d) at a propagating distance of 5 cm
(a)
(b)
(c)
(d)
5. Conclusion
The Lamb signal in the continuous wavelet transform plane shows the ridge character. This paper retrieves the ultrasonic Lamb wave signal from different noisy signals by the wavelet ridge. The experimental results prove that the Lamb wave signal could be retrieved according to the information from the single ridge. To the multi-mode Lamb wave signals, this method is still under the research.
References
-
Chen X., Wan M. Parameter measurement of the cylindrically curved thin layer using low-frequency circumferential Lamb waves. Ultrasonics, Vol. 43, Issue 5, 2005, p. 357-364.
-
Zhou L., He Z., Sun H. Lamb wave mode conversion-based crack detection for plate-like structures without baseline information. Journal of Vibroengineering, Vol. 15, Issue 2, 2012, p. 647-657.
-
Chen X., Li J. Noise reduction for ultrasonic Lamb wave signals by empirical mode decomposition and wavelet transform. Journal of Vibroengineering, Vol. 15, Issue 3, 2013, p. 1157-1165.
-
Alleyne D., Cawley P. Two dimensional transform method for the quantitative measurement of lamb modes. Ultrasonics Symposium, Honolulu, Hawaii, USA, 1990, p. 1143-1146.
-
Pavlopoulou S., Staszewski W., Soutis C. Evaluation of instantaneous characteristics of guided ultrasonic waves for structural quality and health monitoring. Struct. Control Health Monit., Vol. 20, Issue 6, 2013, p. 937-955.
-
Siqueira M., Gatts C., Silva R., Rebello J. The use of ultrasonic guided waves and wavelets analysis in pipe inspection. Ultrasonics, Vol. 41, Issue 10, 2003, p. 785-798.
-
Lazaro J., Emeterio J., Ramos A. Influence of thresholding procedures in ultrasonic grain noise reduction using wavelets. Ultrasonics, Vol. 40, Issue 5, 2007, p. 263-267.
-
Matz V., Smid R., Starman S., Kreidl M. Signal-to-noise ratio enhancement based on wavelet filtering in ultrasonic testing. Ultrasonics, Vol. 49, Issue 10, 2009, p. 752-759.
-
Marchi L., Ruzzene M., Xu B., Baravelli E., Speciale N. Warped basis pursuit for damage detection using lamb waves. IEEE Transactions on Ultrasonics, Ferroelectrics, and Frequency Control, Vol. 57, Issue 12, 2010, p. 2734-2741.
-
Mirahmadi S. J., Honarvar F. Application of signal processing techniques to ultrasonic testing of plates by S0 Lamb wave mode. NDT & E International, Vol. 44, 2011, p. 131-137.
-
Chen X., Bao L. Wavelet ridge analysis of Lamb wave. Advanced Materials Research, Vol. 457, 2012, p. 484-487.
-
Delprat N., Escudie B., Guillemain P. Asymptotic wavelet and Gabor analysis: extraction of instantaneous frequencies. IEEE Trans. On Information Theory, Vol. 38, Issue 2, 1992, p. 644-666.
-
Carmona R., Hwang W., Torresani B. Practical time-frequency analysis: Gabor and wavelet transforms, with an implementation in S. Vol. 9, Academic Press, 1998.
-
Chen X., Wu H. Ultrasonic Lamb wave measurement and data analysis system. Advanced Materials Research, Vol. 458, 2012, p. 701-704.
About this article

This work was supported by the National Natural Science Foundation of China (10904073) and the Priority Academic Program Development of Jiangsu Higher Education Institutions.
