Abstract
Gear transmissions have been widely used in most of today’s manufacturing and production industries; however, they often suffer from deteriorations and damages on gear pairs. Severe damages of the machinery caused by the failures of gears account for 48 %, leading to significant economic losses. Therefore it is crucial to implement fault diagnosis procedure for gearboxes. The gear meshing motion is a kind of typical strong nonlinear movement, and the related vibration signals are the nonlinear mixtures of different kinds of vibration source, leading to great difficulty in the fault feature extraction and fault detection. In order to improve the fault detection of gearboxes, a new method based on the nonlinear fault feature selection and intelligent fault identification is proposed in this work. The blind source separation (BSS) procedure was firstly employed to eliminate the influence of noise signal sources. The useful information related to the fault vibration was hence separated by the independent component analysis (ICA). Then the spectral regression (SR) was used as a nonlinear feature selection technique for the separated vibration sources. Hence, distinct fault features can be obtained. Lastly, the kernel-based extreme learning machine (KELM) was applied for the pattern recognition of single and multiply faults of the gearbox. The fault vibration data acquired from a gearbox fault experimental tester was used to valuate the proposed diagnostic method. The experiment results show that useful fault vibration signals can be separated by the new method, and the fault detection rate of the proposed method is superior to the existing approaches with an increase of 4.4 % or better. Hence, this new development will produce considerable savings by reducing unplanned outages of machinery so a company can get the full benefit from condition monitoring.
1. Introduction
Gear transmissions are essential mechanisms in most of rotating machines. Due to harsh working environment, the gear pairs are prone to deteriorations and damages on their tooth [1]. These faults may cause a break-down of the machine and even loss of life [2]. In order to ensure safe operation of the machine, it is imperative to monitor the condition of gearboxes and detect potential failures in time [3]. Reliable technologies are the solid foundation of the implementation of condition monitoring and fault diagnosis (CMFD), while the feature extraction is always a key issue in CMFD, and how to address the nonlinear feature selection is still a challenging task [4].
Because of the complexity of the gear meshing motion in the gearbox, the gear vibration signal always presents strong nonlinear characteristics; moreover, strong background noise contaminates the gear vibration source. It is hence difficult to extract useful fault features from vibration signals acquired from the accelerometers. Although several effective tools, e.g. the wavelet transform [2], short-time Fourier transform (STFT) [5], empirical model decomposition (EMD) [6] etc., have been developed to extract initiate fault features from the original gear vibration signals; however, there is an amount of redundant features in the initiate fault features [7]. A feature selection processing is still needed. The feature selection means transforming the existing feature space into a lower dimensional one to avoid redundant features [8]. The principal component analysis (PCA) and its diversities are proven to be useful in the feature selection [2]. PCA is able to reduce a high dimensional space into a much lower one to extract the most representative features. Li et al. [2] employed the PCA to select one feature for multi-fault diagnosis of gearboxes. Widodo and Yang [8] used the PCA to obtain one dimensional feature in the fault diagnosis of induct motors. Applications of PCA have also been reported in [9]. Besides PCA, the factor analysis (FA) [10] and locality preserving projections (LPP) [11] are also useful feature selection techniques. FA uses statistics to correlate observed variables in terms of a potentially lower number of unobserved variables [9]. Hence important knowledge about the fault characteristics can be extracted. Côme and Oukhellou [10] adopted the FA for intelligent fault diagnosis of a railway track circuits, and accuracy detection performance was achieved. LPP takes a linear map to project the existing feature space into a low dimensional space with optimally preserving of the original intrinsic geometry structure [11]. Yu [12] employed the LPP to select distinct features of the initiate features from low dimensional space for the bearing fault detection. Although the PCA, FA and LPP contribute a manifest role in feature selection, the linear framework has limited their performance in the exploitation of the multivariate nature of the data [9]. In contrast to PCA, FA and LPP, the spectral regression (SR) [13] is a kind of manifold learning algorithm that uses the regression framework to describe multivariate nature of the data and reveal inhibit nonlinear structure of the original data in a low dimension space. By the integration of spectral graph and regression the SR only needs to solve a set of regularized least squares problems to provide an efficient and effective way for regularized subspace learning. Thus the SR can be applied to a large scale data set. Owing to these advantages, the SR has been used in sensor nodes [14], Human action recognition [15], facial image retrieval [16], EEG signals [17], etc. However, in the field of mechanical diagnosis, very limited work has been done to address the nonlinear feature selection problem using SR. It is reasonable to evaluate the performance and outcomes of SR in the fault diagnosis of gearboxes.
Before using the SR for the gear fault diagnosis, it is essential to extract initiate feature space. The more reliable the initiate features, the more effective the SR selection. However, most of the existing methods ignore the fact that a measured gear vibration signals is heavily corrupted by a large amount of perturbations due to the vibration sources caused by the shafts, bearings and body base of the gearbox [4]. All these disturbed noise signals will be mixed with the gear vibration signals, and thus make the gear meshing vibration distorted severely from theory analysis. Hence, if one wants to extract reliable initiate fault features, it demands to eliminate the disturbed vibration sources from the measured sensor signal. This problem is called blind source separation (BSS) problem [18]. The independent component analysis (ICA) algorithm [18] is competent for solving the BSS problem. The ICA is able to separate the noise sources of the gear vibrations from multi-channel sensor measurements [4, 19]. This work will validate the outcomes of ICA for fault detection and diagnosis in gearboxes.
To construct a complete technique for fault diagnosis of gearboxes, it needs a fault classifier following the feature extraction and selection. Two very important and widely used techniques in the literature are artificial neural networks (ANNs) [20, 21] and support vector machines (SVMs) [22, 23]. BP neural network (BP NN) is the most popular training algorithm [23]. It has strong ability to adaptively learn nonlinear functions between the inputs and outputs; however, BP NN suffers from several disadvantages, including the local minima, over fitting and slow convergence [24]. The SVM is very efficient for small sample learning while it needs to set the kernel function and penalty coefficient, etc. It is difficult to select proper parameters and needs to consume a lot of time to adjust the parameters [24]. In order to overcome the mentioned shortcomings of ANN and SVM, the extreme learning machine (ELM) is proposed as an emergent technique for various learning problems [25]. ELM is a kind of feed-forward neural network with a single hidden layer (SLFN). Hence, ELM only needs to set up the number of hidden layer nodes but no need of adjusting the input weights and hidden layer biases [25]. Therefore, ELM has the advantages of fast learning speed and strong generalization performance. By replacing the activation function of the SLFN with ELM kernels it forms KELM. The KELM inhibits the advantages of ELM and overcomes the disadvantages of local minima, over fitting, parameter setting, etc. As a result, the KELM achieves better generalization performance than SVM and ANN [24, 25]. In this work, the KELM has been introduced as the fault classifier in the condition monitoring and fault diagnosis of gearboxes.
The aim of this work is to investigate the fault diagnosis technique of single and multiply faults of the gearbox using nonlinear feature selection and KELM classifier. Unique to existing approaches [4, 9, 20-23], this paper not only adopts the ICA-SR based nonlinear feature extraction and selection procedure, but also a KELM fault classifier to enhance the fault detection performance. Hence it has more powerful ability to the fault diagnosis of gearboxes. A series of experimental tests have been carried out to verify the efficiency and feasibility of the proposed fault diagnosis technique.
2. The proposed fault diagnosis technique
2.1. The independent component analysis (ICA) algorithm
The basic mathematical model of ICA can be described as [18]:
where is an mixing matrix, is a measured vector, and is independent sources contained in x. The aim of ICA is to find the inverse matrix of to recover the independent sources by:
where is the estimation of . Hyvärinen [18] proposed the FastICA algorithm to calculate . FastICA adopts the maximum entropy criterion, which can be expressed below:
where and is the whitening of ; is the zero mean Gaussian variables with variance of 1; is a nonlinear function and usually adopts the following types:
With the orthogonality restriction of , an estimation of can be obtained by maxmized Eq. (3).
It can be seen from the deduction that ICA has the ability to find different source components excited by different vibration sources. This means the fault related vibration components can be effectively extracted by the ICA analysis.
2.2. The spectral regression (SR) algorithm
The SR has been proven to be more efficient in nonlinear feature selection against PCA, FA, and some common manifold techniques [13]. Since the SR adopts least square rather density matrix to compute the projection direction, the calculation speed is very fast. A detailed introduction of the SR algorithm for dimensionality reduction is given as follows [13].
Let be an initiate feature space. It mainly takes 4 steps for SR to realize the dimensionality reduction of .
(1) Construct adjacency graph: Let be a graph with vertices, each vertex denotes a class. Let denote the weight matrix of the edge joining vertices:
(2) Solve the eigen-problem:
where is a diagonal matrix and ; the eigenvectors with respect to the maximum eigenvalues .
(3) Do least squares regularization: calculate vectors of the solution of the following regularized least squares problem:
where is the th element of .
(4) Implement the embedding:
where . Then, the initiate feature space has been reduced into () dimension space .
2.3. The kernel-based extreme learning machine (KELM)
In general, the training of a feed-forward network relies on the dependencies of all connections of different layers (i.e. weights and biases) [24]. The BP NN is the most used learning structure to tune all parameters. However, the training speed is always very slow or the training convergence is easy to fall into a local minimum. To overcome these problems, ELM is proposed for single-hidden layer feed-forward neural networks (SLFNs) [24]. The distinct characteristic of the ELM is that the hidden layer is not tuned. This characteristic will significantly simplify the training of the SLFN and hence to avoid any local minimum in the training [25]. The detail of the ELM algorithm is given as follows [24-26].
For given samples , where is the feature vector and is the class label vector, a SLFN is used to identify the sample classes and its mathematical model can be express as:
where is the number of hidden neuron; is the output of th sample; is the activation function; is the threshold of the hidden neuron; and are the input and output weight vectors, respectively. It is expected that the output of the SLFN can approximate the target with arbitrary precision. Ideally, if no error between and there should be the following equation:
Eq. (12) can be written compactly as:
where:
However, there may not exist such parameters to make . Then the ELM approach aims to find a least squares error solution of :
where is the Moore-Penrose generalized inverse of . For the case where the samples is far more than the feature dimensionality, can be replaced by to make a stable solution of :
where is a positive constant. It should be noted that the activation function is usually unknown or hard to determine. For convenience one can incorporate kernel functions in . This is the so called kernel-based EML, KELM [26]. By introducing a kernel matrix to substitute in mathematically, the output of the SLFN can be derived as:
In this paper, the radial basis function (RBF) kernel is used:
where is the width of RBF.
2.4. The proposed technique for gearbox fault diagnosis
The proposed gear defect detection processing are described as follows:
Step 1: collect the raw vibration signals of the gearbox using multi-channel vibration sensors.
Step 2: separate useful source signals that derectly related to the fault vibration by ICA processing.
Step 3: decompose the separated sources into several intrinsic mode functions (IMFs) using the ensemble empirical mode decomposition (EEMD) [27], and extract the time-frequency stastistics of the IMFs to form the initiate feature space.
Step 4: select destinct features from the initiate feature space via SR analysis and then treat the new feature space as inputs of the KELM to train and test the performance of the proposed gear fault detection technique, and provide the test result as the base for a valid management decision.
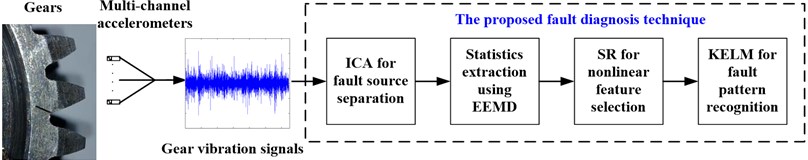
A diagram block of the proposed gear fault detection method is illustrated in Fig. 1.
Fig. 1The block diagram of the proposed gear fault diagnosis technique
3. Experimental results and discussion
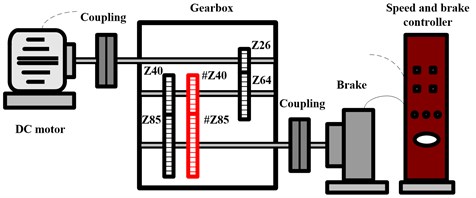
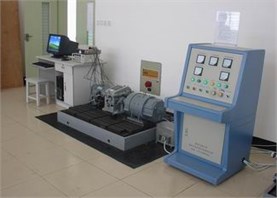
In order to evaluate and validate the proposed gear fault diagnosis technique, a series of experimental tests have been carried out in this work. An experimental setup simulating a two-stage gear transmission has been conceived for the investigation of various gear defects. The experimental setup is illustrated in Fig. 2. A variable speed DC motor with a speed up to 3000 rpm is the basic drive. Several accelerometers are mounted on the flat surfaces of the gearbox in different directions to collect the gear vibration signals.
Fig. 2The diagram and picture of the experimental gear transmission system
a)
b)
Typical gear faults, i.e. the cracked gear, worn gear, broken gear tooth, and thier compounds have been set on the gear teeth of gear pair of #Z40 and #Z85 in the experimental tests. The vibration was measured under six different gear conditions: 1-normal, 2-single crack, 3-single wear, 4-single tooth broken, 5-compound fault of worn and broken teeth, and 6-compound fault of cracked and broken teeth, respectively. The single faults were all set on gear #Z40. The vibration data were acquired under 1000 rpm of the drive speed. The sampling frequency was 10.000 Hz and data length of each sample was 10.240.
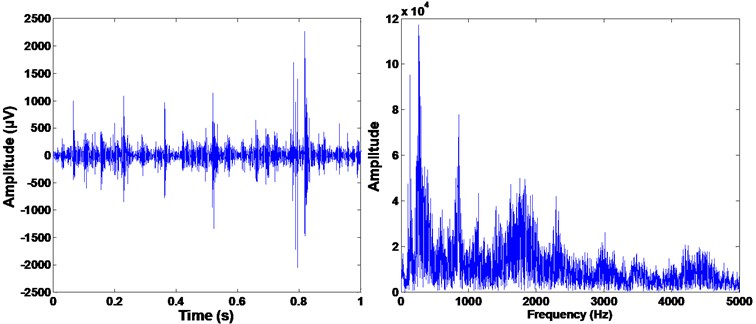
We have prepared 50 samples for each gear condition and there are 300 samples in total. Figs. 3-8 show the time and frequency spectra of every gear operating condition. From the spectra one can note that the vibration data of different operating conditions have been corrupted by heavy noise; except the single cracked gear condition, there is no significant difference in the time and frequency spectra between other gear operating conditions. Therefore, it is unfeasible to detect different gear faults through the time-frequency spectra [28]. Thus the new approach based on ICA-SR-KELM is applied to the single and multiple faults diagnosis of the gearbox.
Fig. 3The time and frequency spectra of the normal gear pair
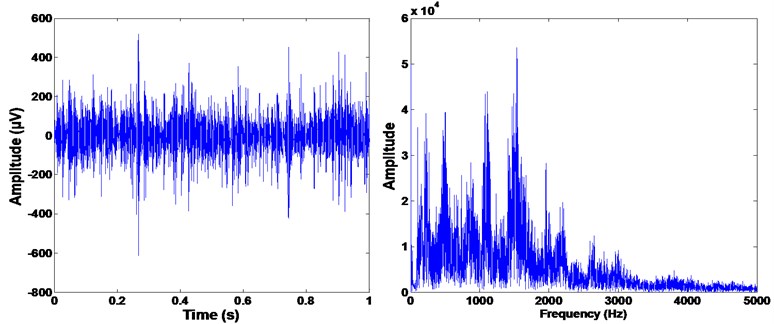
Fig. 4The time and frequency spectra of the single worn gear
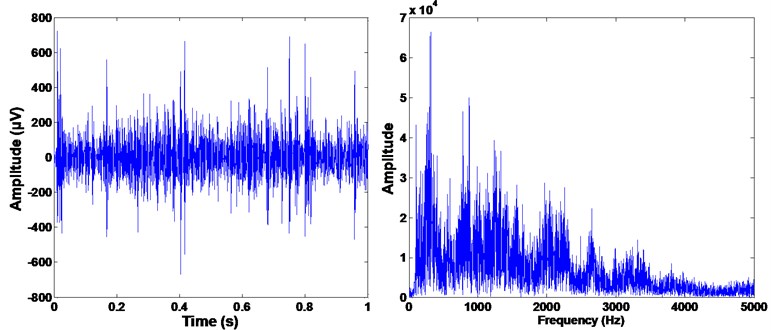
Fig. 5The time and frequency spectra of the single cracked gear
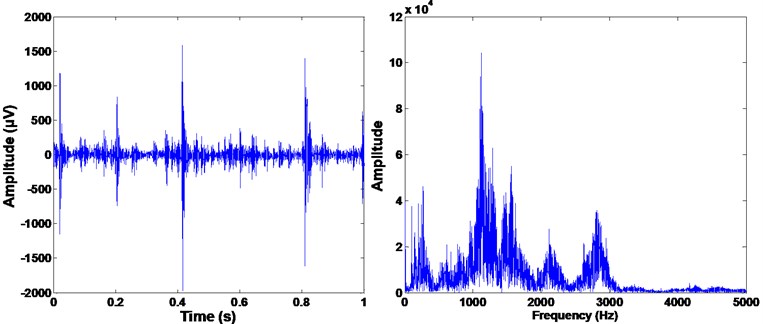
Fig. 6The time and frequency spectra of the single broken tooth
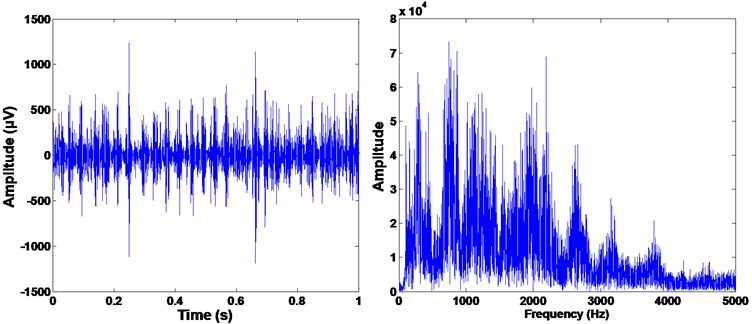
Fig. 7The time and frequency spectra of the compound of worn and broken teeth
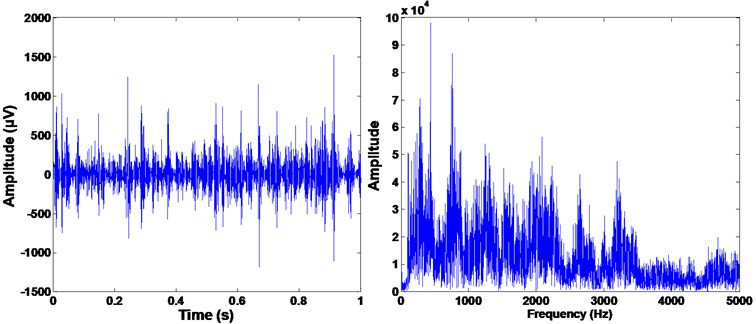
Fig. 8The time and frequency spectra of the compound of cracked and broken teeth
3.1. The ICA separation processing
From the time and frequency spectra of the raw data of the gear vibration it can be seen that strong background noise has interfered the fault detection. The ICA is hence employed to eliminate the noise components and extract useful information about the faulty gears. Before the ICA processing we need address the basic characteristics about the vibration of the gear meshing motion of interest. According to the structure of the gear transmission shown in Fig. 2, when the drive speed is 1000 rpm the rotating speed of the second shaft is 6.77 Hz and 3.18 Hz for the third shaft. The meshing frequency of gear pair of #Z40 and #Z85 is 203 Hz. Theoretically, when the gear pair operates in normal situation the meshing frequency and its harmonics are dominant frequencies in the vibration signal [2]. When failures happen in gear #Z40 then and its harmonics becomes the dominant frequencies or and its harmonics when defects only appear in gear #Z85 [2]. Bearing this in mind we adopt the ICA to analyze its separation performance in the case of gear fault diagnosis.
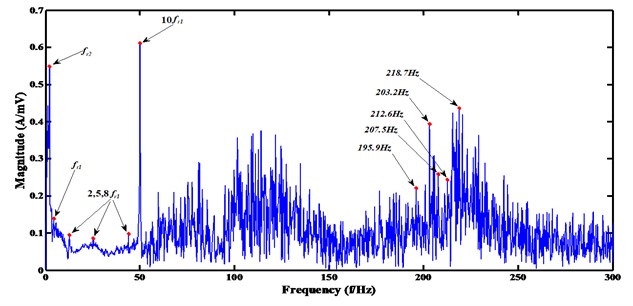
Four sensors have been used to record the gearbox vibration in vertical and horizontal directions of the second and third shafts in the experiments. Then ICA has been adopted to separate the four-channel signals into useful and noise sources. Figs. 9 and 10 shows the separation results of the single broken gear tooth condition. Two source components have been separated by ICA. In source two in Fig. 10, it can be seen that evident peak appears at 203.2 Hz (almost equal to the gear meshing frequency ); side frequencies (195.9 Hz, 207.5 Hz, 212.6 Hz, and 218.7 Hz, etc.) emerge around 203.2 Hz and the interval between these side frequencies is very close to the fault frequency of gear #Z40, (5.08 Hz). More important is that there exists the two largest peaks locating on and , and several harmonics of present in the frequency band [1-50 Hz]. These are direct envidence to the occurence of failure on gear #Z40. However, these important fault information can not observed in Fig. 9. As a result, source one can be regarded as noise source and very useful information about the fault characteristics has been perserved in the separated source two. Great benifits are hence generated for reliable feature extraction.
Fig. 9The frequency spectrum of the separated source one
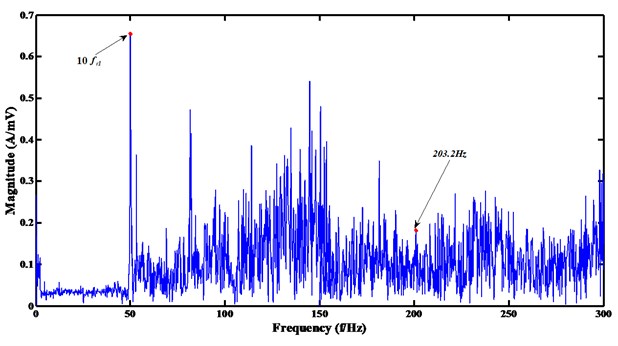
Fig. 10The frequency spectrum of the separated source two
3.2. The SR feature selection
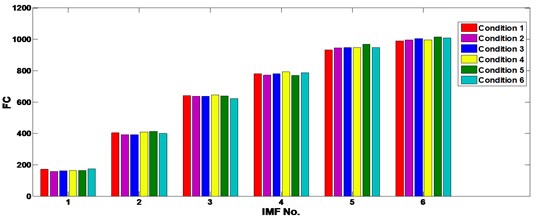
Herein we use the ICA to process all the recorded samples to eliminate noise sources. Then the EEMD is employed to decompose the separated sources into 6 IMFs. The time domain statistics (i.e. root mean square (RMS), kurtosis, skewness, crest factor (CF), shape factor (SF)), frequency domain statistics (i.e. frequency center (FC), frequency RMS (FRMS) and frequency root variance (FRV)), and time-frequency domain statistics (i.e. energy) of each IMF are calculated as the initiate features. For every sample there are 54 feature elements and the initiate feature space is . Figs 11-13 show a portion of the kurtosis, CF and FC of the separated gear vibration signals after EEMD processing. One can be noticed from the figures that the kurtosis may be a good fault indicator because in each IMF there are differences when the gear working condition varies; the FC performs terrible because of similarities of the FC values in every IMF. Hence, it indicates that in the initiate feature space there exist some useless feature elements which increase the dimensionality of the feature space and may decrease the fualt detection performance.
Fig. 11The kurtosis value of the 6 IMFs of the ICA processed gear vibrations under different conditions
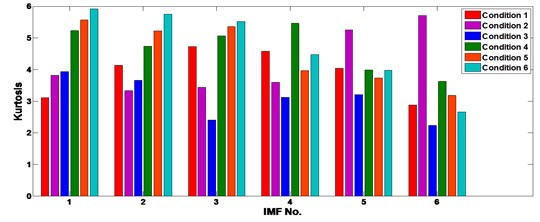
Fig. 12The CF of the 6 IMFs of the ICA processed gear vibrations under different operating conditions
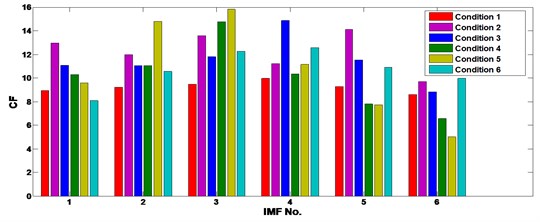
Fig. 13The FC of the 6 IMFs of the ICA processed gear vibrations under different operating conditions
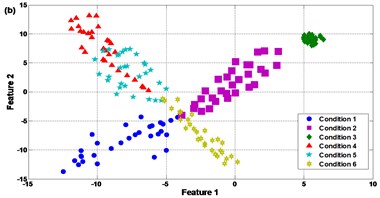
In order to eliminate the negative effect of redundant features and hence improve the fault diagnosis rate, the SR is used to reduce the initiate feature space and select new features that are more sensitive to the change of the gear operating condition than the original ones. To illustrate the nonlinear feature selection ability against the PCA, FA and LPP, the feature selection performance of SR has been compared with its rivals. Fig. 14 shows the comparison of the 4 methods.
Fig. 14Comparison results of the feature selection: (a) SR, (b) PCA, (c) FA, and (d) LPP
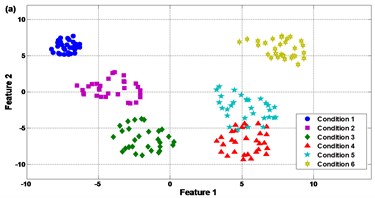
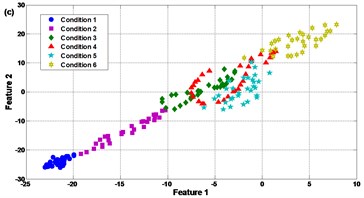
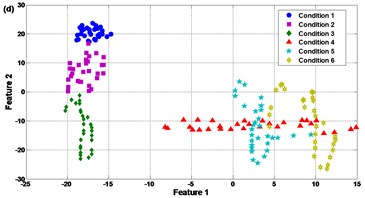
It can be seen in Fig. 14(a) that the SR presents good feature selection performance. The new feature space can approximately group the samples into 6 classes except only a little overlap between condition 4 and condition 5, i.e. the single tooth broken and compound fault of worn and broken teeth. This is because the worn gear is a common but slight fault type in the gear transmission. Even in new gearbox after putting into application the gears will be worn more or less. In some cases the slight worn gears could be regarded as normal ones. As a result, the fault characteristics of condition 4 and condition 5 will be very similar and it is difficult to identify these two kinds of failures.
Contrast to SR, it is notable in Fig. 14(b)-(d) that the PCA, FA and LPP can only separate the experimental samples into 3 clusters or less. For PCA in Fig. 14(b), condition 4 and condition 5 are corrupted with each other seriously. There also exist slight mixing of condition 2 and condition 6, i.e. single cracked gear and compound fault of cracked and broken teeth. In Fig. 14(c), conditions 3, 4, 5 and 6 are mixed and difficult to be recognized. In Fig. 14(d) conditions 4, 5 and 6 are mixed. The reason for the large amount of overlap between different gear faults when using PCA, FA and LPP may be that the compound faults contain weak vibration components presenting the coupled effect of two faulty gears in the meshing motion; the compound faults increase the nonlinearity of the meshing motion such that it is unfeasible to use linear based feature selection techniques to sense the hidden weak components [2]. This explains why the SR can improve the feature selection performance and is superior to PCA, FA and LPP in this case. Since the clearer the clusters of the feature space, the more robust the fault classifier, the comparison in Fig. 14 approves that distinct features can be extracted effectively by SR to improve the fault pattern recognition.
3.3. The KELM based fault pattern recognition
The effective training ability of the KELM is introduced into the gear fault diagnosis. The learning scheme of KELM is much faster than traditional gradient-based learning algorithms [26]. In this work we have compared the fault pattern recognition efficacy of KELM, BP NN and SVM.
In the experiments, the hidden layer neuron number of the KELM was set to 30, the RBF kernel parameter . The BP NN adopted 30 hidden layer neurons, and the SVM used RBF kernel with . The inputs of the classifiers are the new selected features via SR. Herein we have considered the influence of the selected feature number. We have selected 2, 3, and 10 features in the feature selection processing. Table 1 lists the comparison results on the fault detection rate between BP NN, SVM and the KELM using different feature selection numbers. It can be seen in the table that the detection precision of the KELM is the highest among the 3 classifiers when using 3 and 10 input feature dimensionalities; when the input feature dimensionality selects 2, the KELM and SVM both obtain the best fault detection rate, 91.3 % while the training time of the KELM is much faster than the SVM. Hence, it can be noticed by table 1 that the KELM not only increases the convergence speed in the training process but also the genelization ability. Moreover, the detection rates of the BP NN, SVM and KELM using 2 or 3 of the feature dimensionality are obvious better than that using 10 of the feature dimensionality. This is because with the increase of dimensionality the redundant features are more likely to be introduced into the feature space. Keeping a suitable feature dimensionality will help to enhance the fault detection.
Table 1Comparison results between BP, SVM and the KELM using different feature selection numbers
Feature number | BP NN | SVM | KELM | |||
Detection rate | Training time | Detection rate | Training time | Detection rate | Training time | |
2 | 90.7 % | 0.635 s | 91.3 % | 0.145 s | 91.3 % | 0.017 s |
3 | 90.3 % | 0.689 s | 90.3 % | 0.218 s | 90.7 % | 0.021 s |
10 | 87.7 % | 0.758 s | 88.3 % | 0.276 s | 88.7 % | 0.027 s |
Table 2 gives the comparison results on the fault detection rate between BP NN, SVM and the KELM using different feature selection methods, where the feature selection number is 2. It can be seen in the table that the SR based method scores higher in the detection precision than the rest. Once again, the comparison results prove that the SR based feature selection has more powerful ability than PCA, FA and LPP in the gear fault diagnosis. It also can note from Tables 1 and 2 that the comprehensive detection performance of the proposed new technique is superior to its rivals. Thus the new gear fault diagnosis technique could provide satisfactory performance in the detection of single and multiple faults of gearboxes.
Table 2Comparison results between BP, SVM and the KELM under different feature selection methods
Feature selection method | BP NN | SVM | KELM |
Detection rate | Detection rate | Detection rate | |
PCA | 87.3 % | 87.7 % | 88.3 % |
FA | 86.3 % | 86.7 % | 86.7 % |
LPP | 85.7 % | 86.3 % | 86.7 % |
SR | 90.7 % | 91.3 % | 91.3 % |
4. Conclusions
The vibration signals of incipient faults in the gearbox are often heavily corrupted by inference noise. Reliable fault extraction and fault identification technique is therefore crucial for the condition monitoring and fault diagnosis of gearboxes. This work has presented an effective technique for single and multiply gear faults detection through novel integration of independent component analysis (ICA), spectral regression (SR), and kernel extreme learning machine (ELM). It could be the first time to apply the nonlinear feature selection and KELM to fault diagnosis of gearboxes. A series of experimental tests have been carried out to evaluate the new technique. Comparison work has also been implemented to verify the efficacy of the proposed technique against its rivals, including the linear based feature selection methods and traditional intelligent classifiers. The analysis results demonstrate that: (a) the fault related vibration sources can be separated directly by ICA, (b) the ICA-SR based feature selection approach can provide more efficient performance than PCA, FA and LPP methods in the extracting of distinct features, and (c) the fault pattern recognition of the KELM is superior to the BP NN and SVM. The experiments have proven the effectiveness of the proposed fault diagnosis technique. The newly proposed technique in this work may provide promising alternative for fault diagnosis of gearboxes. Future research is planned to further investigate the practical utilities of the proposed gear fault diagnosis technique in manufacturing industry.
References
-
McFadden P. Examination of a technique for the early detection of failure in gears by signal processing of the time domain average of the meshing vibration. Mechanical Systems and Signal Processing, Vol. 1, 1987, p. 173-183.
-
Li Z., Yan X., Yuan C., Peng Z., Li L. Virtual prototype and experimental research gear multi-fault diagnosis using wavelet-autoregressive model and principal component analysis method. Mechanical Systems and Signal Processing, Vol. 25, 2011, p. 2589-2607.
-
Jardine A., Lin D., Banjevic D. A review on machinery diagnostics and prognostics implementing condition-based maintenance’. Mechanical Systems and Signal Processing, Vol. 20, 2006, p. 1483-1510.
-
Li Z., Yan X., Tain Z., Yuan C., Peng Z. Blind vibration component separation and nonlinear feature extraction applied to the nonstationary vibration signals for the gearbox multi-fault diagnosis. Measurement, Vol. 46, 2013, p. 259-271.
-
Li Z., Yan X., Guo Z., Zhang Y., Yuan C., Peng Z. Condition monitoring and fault diagnosis for marine diesel engines using information fusion techniques. Elektronika ir Elektrotechnika, Vol. 7, Issue 123, 2012, p. 109-112.
-
Huang N., Wu M., Long S., Shen W., Qu W., Gloersen P., Fan F. A confidence limit for the empirical mode decomposition and Hilbert spectral analysis. Proceedings of the Royal Society of London A, Vol. 459, Issue 2037, 2003, p. 2317-2345.
-
Xia Z., Xia S., Wan L., Cai S. Spectral regression based fault feature extraction for bearing accelerometer sensor signals. Sensors, Basel, Vol. 12, Issue 10, 2012, p. 13694-13719.
-
Widodo A., Yang B. Application of nonlinear feature extraction and support vector machines for fault diagnosis of induction motors. Expert Systems with Applications, Vol. 33, 2007, p. 241-250.
-
Li W., Shi T., Liao G., Yang S. Feature extraction and classification of gear faults using principal component analysis. Journal of Quality in Maintenance Engineering, Vol. 9, Issue 2, 2003, p. 132-143.
-
Côme E., Oukhellou L., Denoeux T., Aknin P. Fault diagnosis of a railway device using semi-supervised independent factor analysis with mixing constraints. Pattern Analysis and Applications, Vol. 27, 2012, p. 313-326.
-
He X., Niyogi P. Locality preserving projections. Proceedings of Advances in Neural Information Processing Systems, Vol. 16, 2003.
-
Yu J. Bearing performance degradation assessment using locality preserving projections. Expert Systems with Applications, Vol. 38, 2011, p. 7440-7450.
-
Cai D. Spectral regression: a regression framework for efficient regularized subspace learning. PhD Thesis, Department of Computer Science, UIUC, 2009.
-
Wang C., Chen J., Sun Y. Sensor network localization using kernel spectral regression. Wireless Communications and Mobile Computing, Vol. 10, Issue 8, 2010, p. 1045-1054.
-
Lin G., Zhu H., Fan Y., Fan C. Human action recognition based on random spectral regression. Lecture Notes in Computer Science, Vol. 7004, 2011, p. 451-461.
-
Zhang B., Gao Y. Spectral regression dimension reduction for multiple features facial image retrieval. International Journal of Biometrics, Vol. 4, Issue 1, 2012, p. 77-101.
-
Yaqub M., Gondal I., Kamruzzaman J. Inchoate fault detection framework: adaptive selection of Wavelet nodes and cumulant orders. IEEE Trans. Instrumentation and Measurement, Vol. 61, 2012, p. 685-695.
-
Hyvärinen A., Karhunen J., Oja E. Independent component analysis. John Wiley and Sons Inc, New York, 2001.
-
Roan M., Erling J., Sibul L. A new, non-linear, adaptive, blind source separation approach to gear tooth failure detection and analysis. Mechanical Systems and Signal Processing, Vol. 16, 2002, p. 719-740.
-
Li Z., Yan X., Yuan C., Zhao J., Peng Z. Fault detection and diagnosis of the gearbox in marine propulsion system based on bispectrum analysis and artificial neural networks. Journal of Marine Science and Application, Vol. 10, Issue 1, 2011, p. 17-24.
-
Li H., Zhang Y., Zheng H. Gear fault detection and diagnosis under speed-up condition based on order cepstrum and radial basis function neural network. Journal of Mechanical Science and Technology, Vol. 23, Issue 10, 2009, p. 2780-2789.
-
Cheng J., Yu D., Yang Y. A fault diagnosis approach for gears based on IMF AR Model and SVM. EURASIP Journal on Advances in Signal Processing, Vol. 2008, 2008, p. 1-7.
-
Li Z., Yan X. Study on data fusion of multi-dimensional sensors for health monitoring of rolling bearings’. Insight – Non-Destructive Testing and Condition Monitoring, Vol. 55, Issue 3, 2013, p. 147-151.
-
Huang G., Zhu Q., Siew C. Extreme learning machine: Theory and applications. Neurocomputing, Vol. 70, 2006, p. 489-501.
-
Huang G., Chen L. Enhanced random search based incremental extreme learning machine. Neurocomputing, Vol. 71, 2008, p. 16-18.
-
Huang G., Wang D., Lan Y. Extreme learning machines: a survey. International Journal of Machine Leaning and Cybernetics, Vol. 2, Issue 2, 2011, p. 107-122.
-
Huang N., Wu Z. Ensemble empirical mode decomposition: a noise-assisted data analysis method. Advances in Adaptive Data Analysis, Vol. 1, Issue 1, 2009, p. 1-41.
-
Sheng C., Wu T., Zhang Y. Non-destructive testing of marine diesel engines using integration of ferrographic analysis and spectrum analysis. Insight: Non-Destructive Testing and Condition Monitoring, Vol. 54, Issue 7, 2012, p. 394-398.
About this article

This project is sponsored by the grants from the National Natural Sciences Foundation of China (No. 51139005) and the Foundation for Young Talents in College of Anhui Province (No. 2012SQRL182).
