Abstract
Parametric atom decomposition provides the chance of adaptation for the non-stationary signals decomposition. However, the parametric atoms, whether Fourier atoms or wavelet atoms preset artificially, are regular. These atoms do not have enough match degree to the practical signals which are non-stationary and irregular. Therefore, the coefficients of the parametric atom decomposition may be dense and their physical interpretation is difficult to determine or ambiguous. Extraction of impact features is the key problem for the fault diagnosis of rolling element bearings. According to the cyclo-stationary nature of the fault signal, authors extract basic atoms from the analyzed signal instead of artificially giving the regular basis, hence the match degree is improved and the coefficients of the decomposition have more explicit physical meaning. Compared with wavelet packet atom decomposition, the non-parametric atom decomposition captures the integrity of the impact and represents the fault signal more sparsely and has more intelligible interpretability. While compared with the spectral correlation density function, the non-parametric atom decomposition better emphasizes the main information of the fault and the frequency resolution of the novel method is irrelevant to the length of the analyzed signal.
1. Introduction
Rolling element bearings (REBs) are widely used in machines and their failures may lead to a train of faults of the mechanical system. Periodic maintenance certainly would cause two situations. In the first situation, the REBs work well in the scheduled time of maintenance, which would cause economic waste. In the second situation, the REBs may fail before the scheduled time of maintenance, which would cause economic damage and personal safety due to suddenly breaking. Therefore, the state monitoring of the REBs is very important.
The most common mode of failure in the rolling element bearings is spalling or pitting in the races or the rolling elements. Once the defect exists, an impact vibration will be caused when a running roller passes over the surface of a defect. Therefore, vibration signal analysis is an effective method for bearing fault detection [1]. The aim of signal analysis is to find a simple and effective transform to the original signals so that the dominant features of the signals can be shown for fault diagnosis. Hitherto, many signal analysis methods have been used for REB’s fault diagnosis, among which fast Fourier transformation (FFT) is the most fundamental and conventional signal processing method. However, FFT sometimes cannot successfully diagnose the REB’s fault due to the vibration signal being non-stationary. Hence, advanced signal processing techniques are needed. The wavelet is able to concentrate on frequency domain and time domain, so the wavelet transformation can well catch the non-stationary character of the analyzed signal and is more suitable for the analysis of non-stationary signals [2]. Over the past twenty years, wavelet theory and its applications have been researched extensively.
But, some reasons confine the applications of the wavelets in the fault diagnosis [2]. For example, there is no standard method to select the most appropriate wavelet basis from kinds of wavelet families and determine the range of scales for different purpose of the signals analysis [3]. Selecting different wavelet functions may obtain different analysis results, which will make not only new learners of wavelets but also many engineers confused. Once the wavelet and scale are selected inappropriately, the wavelet transform would cause some meaningless results, which will mislead the fault diagnosis [4, 5]. In addition, the results of the wavelet transform have no straightforward physical implications. Therefore, it is difficult to obtain useful information directly from the results of the wavelet transform.
In reality, wavelet transformation is based on the windowed FFT, i.e. wavelet transformation decomposing the analyzed signal to a set of time-scale coordinate systems is based on the artificially assigned sinusoids. In addition, wavelet transformation is usually in a set of complete basis and has only one representation to the signal. Thus, this assigned regular coordinate system cannot always suit the practical analysis purpose and obtain easily interpretative results.
Atom decomposition represents signal approximately using some basis which is selected from an over-complete dictionary. Due to the over-completeness and the proximity, atom decomposition can provide multitudinous representations to the analyzed signal, thus atom decomposition possesses the possibility of adaptation and the users may choose the most suitable representations for their purpose, such as obtaining the sparsest representation and the higher resolution or possessing reasonable physical interpretation for the analysis signal [6].
Although most research of atom decompositions is based on parametric basis, a few researchers have attempted to apply the non-parametric basis to the field of fault diagnosis. Hong Fan and Qingfeng Meng [7] try to represent the signal by the nonparametric waveforms which are evolved from an arbitrary simple waveform. In the evolution, compare the given simple waveform with the narrow-band signal from the analyzed signal and then rectify their difference gradually. The adaptive adjustment of template signals makes it unnecessary for the method to require priori information, thus the method has better flexibility and adaptability. However, this method needs to modify each given simple signal in order to obtain the suitable non-parametric basis (the narrow-band template signal). In addition, this method decomposes the signal to narrow-band signals artificially, and is still based on decomposing the analyzed signal to sinusoids functions, which certainly will destroy the integrity of the needed features.
Wang Guodong et al. [8] extract some waveforms from the sample signals based on time waveforms and then train those waveforms using a given algorithm to obtain the representative waveforms, each of which indicates a kind of REB fault. The representative characteristic waveforms are considered as basic atoms. A dictionary is composed of the basic atoms and their translated waveforms. Pattern recognition is conducted through one-order matching analysis in the pattern matching dictionary. This dictionary only includes a characteristic waveform for each kind of fault, so it would confine the method’s recognition capability due to the non-determinacy of the impact signals. In addition, this method needs enough known fault samples, which is in fact difficult.
Qingbo He and Xiangxiang Wang [9] select an integrated impact as a template from the time-frequency distribution which is considered as an image. Then the ridge coefficients are obtained by using the matching method. Periodic fault is identified from the analysis to the ridge. This method ignores the difference among the impacts i.e. the non-determinacy of the impact signals. Although the initial selected template is non-parametric, the method is essentially based on the classical spectral analysis.
Literature [10] and [11] indicate that the signal of the REB fault is cyclo-stationary, i.e. the part of the signal is similar to the other part. According to this similarity, the authors expect to refer to the approximate expression theory of the atom decomposition and apply the algorithm of matching pursuit to realize the REB fault diagnosis. The set of atoms are extracted from the analyzed signal instead of presetting artificially, which makes the decomposition result more sparse and interpretable. The frequency resolution is irrelevant to the length of the analyzed signal due to the Fourier transform being not needed. The paper is organized as follows: in Section 2, the theories of atom decomposition and matching pursuit are briefly introduced. Section 3 describes the method of abstracting the basis of impact from the REB fault signal and constructing the non-parametric atom dictionary. In Section 4, the results of the REB fault diagnosis based on the nonparametric atom decomposition are compared with the wavelet packet atom decomposition and the cyclo-stationary method. Some conclusions and prospects are presented in Section 5.
2. Atom decomposition and matching pursuit
2.1. Brief theory of atom decomposition
Instead of just representing signals as superposition of the complete basis, atom decomposition allows the signals to be approximately represented selectively using a part of the available dictionary collection of parameterized waveforms. Each such dictionary is a collection of waveform , with parameter. Each waveform is called an atom, which is a normalized function. A signal can be precisely decomposed as:
or approximately represented as:
where is the set of all indices, and is the dictionary size, i.e. the number of the atoms in the dictionary. is the coefficient of the th selected atom and is the residue of the signal except the linear summation of the selected atoms.
Approximate representation may ignore the useless information to our purpose and consequently the needed information will appear more clear and flexible. Some algorithms of atom decomposition have been researched, such as the method of frames (MOF), matching pursuit (MP), basis pursuit (BP), and the best orthogonal basis (BOB). At present, MP is a kind of efficient algorithm that has been widely applied.
2.2. The procedure of matching pursuit
Matching pursuit (MP), proposed by Mallat [12], is an iterative process of local optimization. Initially, the residue is equal to the original signal. In each iteration step, the most matching atom to the residue of the previous matching is selected and a new residue signal is produced. The new residue is then used as input to the next iteration. The residue at iteration is obtained by using the following equations:
where is the inner product, and is the atom whose inner product with the residue is at a maximum:
After iterations, the decomposed signal can be written in terms of the successively matched atoms as:
The iteration is stopped when the coefficient satisfies the given condition.
3. The non-parametric basic waveform estimation and the atom dictionary establishment
The purpose of the development of wavelets is to accommodate non-stationary signals. However, parametric waveforms of wavelets sometimes cannot match the real signal well which is usually not regular like the parametric function. This causes the results of the transformation based on the wavelet basis have no understandable physical interpretation. Therefore, finding more coincident basis to the features of the real signals will contribute to the extracting features.
At a constant speed, the impact of the REB fault caused by the spalling should be cyclic. In addition, the system of the bearing unavoidably has some manufacture or assembly errors which will result in the randomness of the impact signal. In practice, each impact waveform is impossible to be absolutely similar. Therefore, the approximate expression of atom decomposition based on the non-parametric atoms, which come from the signal features, should better adapt to the analysis of the real signals. In order to apply the non-parametric atom decomposition, the appropriate basis and dictionary are important. The following paragraphs will introduce the procedure of the non-parametric atom dictionary establishment, taking an outer race fault signal for example.
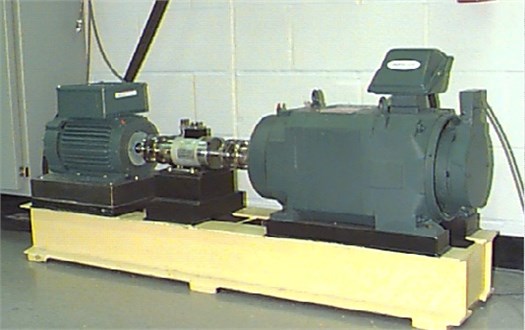
In this paper, the analyzed signals come from the Case Western Reserve University Bearing Data Center Website [13]. As shown in Fig. 1, the test stand consists of a 2 hp motor (left), a torque transducer /encoder (center), a dynamometer (right), and control electronics (not shown). The test bearing supports the motor shaft at the end of the motor. Single point faults were introduced to the test bearing using electro-discharge machining. Accelerometer was placed at the drive end of the motor housing. The bearing of the experiment is 6205-2RS JEM SKF with sampling frequency () equal to 12000 Hz and the rotating speed of the shaft equal to 1797 r/min (rotating frequency of the shaft is 29.9 Hz). The characteristic frequency () of the outer race fault in the REB can be calculated as 107.4 Hz. The experiment is based on single axis and has no effect from the other device and has few noises. Therefore, the preprocessing, for example denoising and signal separation, is not needed. Fig. 2 shows the acceleration signal of the outer race fault and the corresponding spectrum. The time waveform presents an evident impact feature. However, without further analysis, one cannot judge the specific fault directly whether from the time signal or from the spectrum.
Fig. 1The picture of the test stand
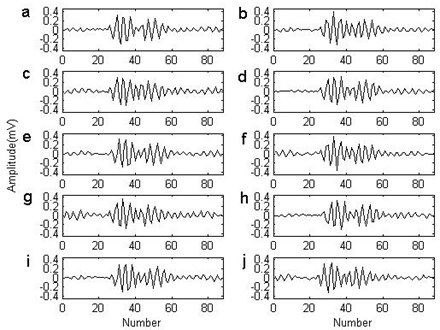
While the impact comes up, the local energy of the signal would obviously increase, thus the authors consider the local energy as the criterion of selecting the basis. The frequency of the inner race fault is the highest among the REB faults and the impact period is the lowest. In order to include only one integrated impact waveform in each searching scope, half of the theoretical impact period of the inner race fault is set to identify the impact waveforms and 1.5 times of the period is set as the each searching scope. In the searching scope, the energy of each given identification length of the signal is calculated from left to right step by step and the maximal energy location is considered as the center of the impact. In order to let the dictionary include all impact waveforms as far as possible, the total searching scope should experience more than a rotation at least. Fig. 3 illustrates the searching scope for the successive ten impact waveforms. Since the location of the first impact cannot be determined in advance, the first searching scope should be lengthened properly then the preset single searching length. Fig. 4 shows the energy changing tendency during the first impact waveform searching procedure. The maximum determines the location of the basis. Once the location of the previous impact is determined, the next searching initiates from the ending of the previous impact. Fig. 5 enumerates the ten selected impact waveforms, which shows that each impact waveform is similar and different. The non-parametric atom dictionary is constructed with these waveforms as the basis.
Fig. 2The waveform and the spectrum of the outer race fault signal
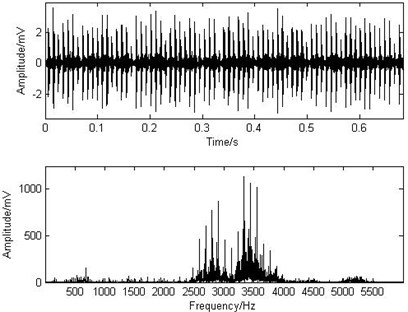
Fig. 3The demonstration of the searching range
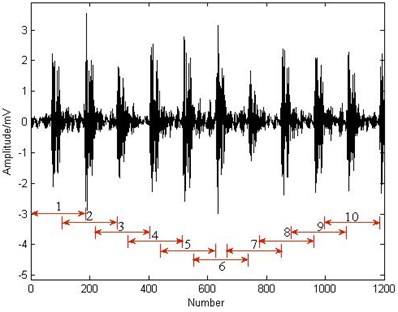
Fig. 4The demonstration of the location of the basis selecting
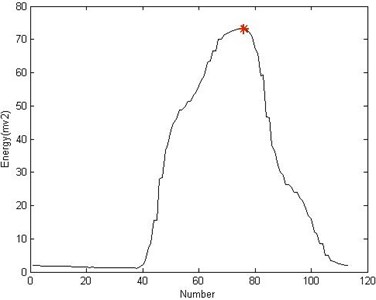
Fig. 5The basis of the non-parametric atom from the outer race fault signal
The atoms should have the same length with the analyzed signal. The values of each atom, except the locations of the impact waveform, are padded with zero. The atoms based on the same basis are called a group, which is constructed by translating the impact waveform from left to right point by point and showed as the Eq. (7):
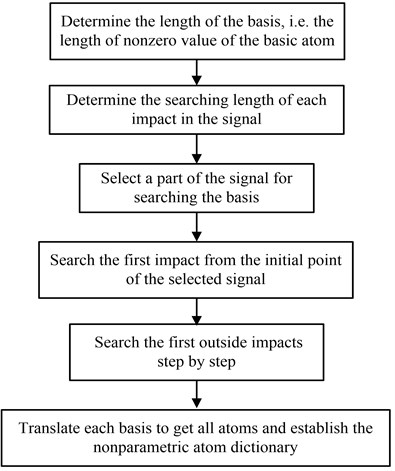
where, is the th selected basis. The dictionary of the non-parametric atom is consisted of all the atom groups and expressed as . Fig. 6 illustrates the flow chart of the construction of the non-parametric atom dictionary.
Fig. 6The flow chart of establishment of the nonparametric atom dictionary
4. The diagnosis effect of the non-parametric to the rolling element bearings
4.1. Compared with the wavelet packet atom matching
In order to test the performance of the non-parametric atom decomposition, the authors analyze another part of the previous outer race fault signal by using the non-parametric atom matching (NPAM) pursuit and the wavelet packet atom matching (WPAM) pursuit. Fig. 7 is the initial signal and the results of the first four matching of the non-parametric dictionary and Fig. 8 is the results of the fifth to ninth matching. These show that each matching exactly subtracts an integrated impact from the previous residue. After the ninth matching, the analyzed signal has no obvious impact again and the residue is weak enough to be ignored to our purpose. Fig. 9 is the results of the first four wavelet packet atom matching and Fig. 10 is the results of the fifth to ninth matching (the wavelet packet dictionary of Coiflet3 is used). These show that each matching does not subtract an integrated impact exactly. After the ninth matching, the nine impacts are still obvious and the residue is powerful. Fig. 11 and Fig. 12 are the nine matched atoms of the non-parametric dictionary and the wavelet dictionary respectively. It is more evident that the locations and the waveforms of the first nine matched non-parametric atoms are just the nine impacts in the signal, which shows that the physical interpretation is simple and clear. But the impact locations of the first nine matched wavelet atoms have repetition and omission to the impact locations in the signal. In addition, the matched waveforms of the wavelet packet atoms are different from the impact wavelet in the signal, which results in the ambiguity of the physical interpretation.
Fig. 7The matching pursuit of the non-parametric atom (1-4)
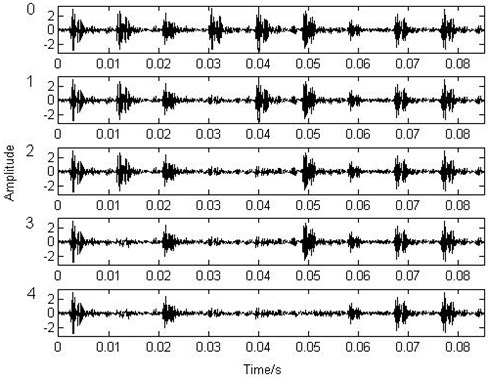
Fig. 8The matching pursuit of the non-parametric atom (5-9)
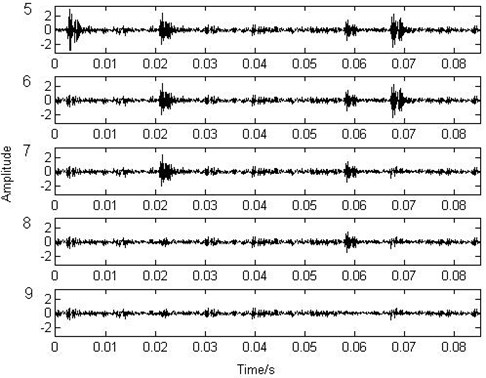
Fig. 9The matching pursuit of the wavelet packet atom (1-4)
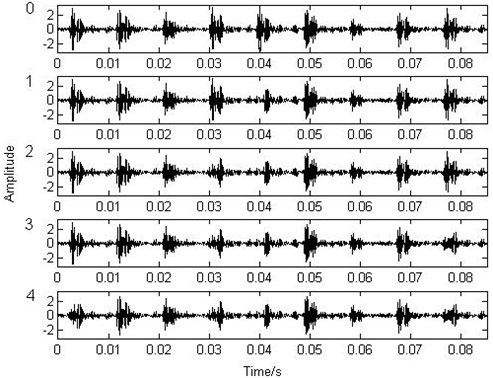
Fig. 10The matching pursuit of the wavelet packet atom (5-9)
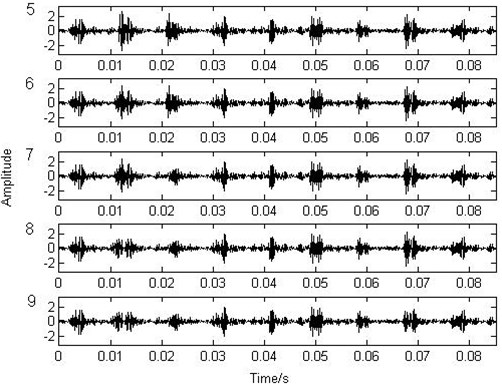
Fig. 11The first nine matched atoms of the non-parametric atom decomposition
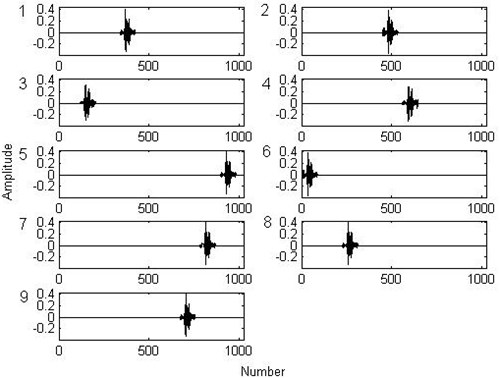
Fig. 12The first nine matched atoms of the wavelet packet decomposition
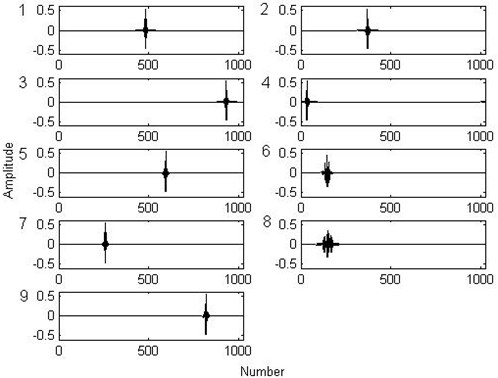
Fig. 13 illustrates the energy change of the residues during the two matching procedures. The black star line is the energy change procedure of the NPAM and the red ring line is that of the WPAM. The energy of the first nine residues of the non-parametric descends rapidly. The energy of the ninth residue reaches 9.8 % of the initial signal. However, the energy of the ninth residue of the WPAM is more than 50 % of the initial signal. Define the energy ratio of the matched atoms to the analyzed signal as the matching degree, i.e. , where is the energy of the residue and is the energy of the analyzed signal. The matching degree of the first nine matched atoms of the NPAM reaches 90.2 %, but that of the WPAM reaches 50 %. Until the 57th matching, the matching degree of the WPAM reaches 90.2 %. The NPAM stops iteration at the108th residue. At this moment, the energy of the residue reaches 2 % and the matching degree reaches 98 %. But the WPAM reaches this degree at the 170th residue.
Fig. 13Comparison of the matching degree of the two atom matching pursuits
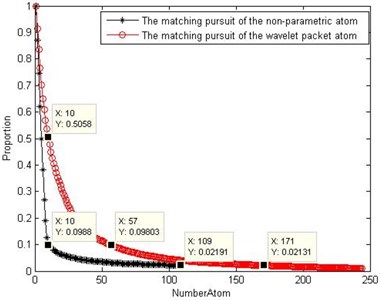
Fig. 14Comparison of the coefficients of the two atom matching pursuits
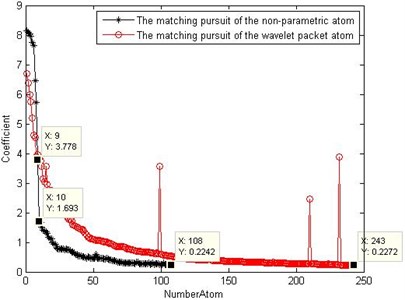
Fig. 14 shows the coefficients of the NPAM and the WPAM. The black star line is the coefficients change procedure of the NPAM and the red ring line is that of the WPAM. The change tendency of the first nine coefficients of the NPAM is steep. The other coefficients descend slowly without obvious transition. The front part of the coefficients of the WPAM change tendency is slower than that of the NPAM and some sudden transitions emerge in the later stage, which confuses the physical interpretation. The 108th coefficient satisfies the iteration stop condition in the NPAM, but not the 243rd coefficient in the WPAM.
Finding the fault feature from the results is the purpose of the analysis of the REB fault signal. In this paper, the authors find the feature by the time intervals of the impacts or the fault frequency, which can be obtained from the structural feature of the dictionary. The non-parametric atom dictionary is constituted by translating some basic atoms. The atoms that originated from the same basic atom are considered as a group which exactly corresponds to all impact locations in the signal. Thus, the impacts locations in the signal can be obtained according to the locations of the matched atoms in the dictionary. By sorting the locations of the impacts in the first nine matching atoms, the time intervals of the two adjacent impacts are obtained. Fig. 15 shows the sorted locations of the first nine impacts. The black line represents the NPAM and the red line represents the WPAM. The black line is nearly a straight line. This indicates that the intervals of each two adjacent impacts in the first nine matched atoms of the NPAM are nearly equal. But, the red line has two obvious transitions because the first nine matched atoms do not match the impact waveform of the fault caused by the outer race fault of the REB. The first transition indicates that two impacts in the wavelet packet atoms are at the same location and the second transition indicates that an impact is omitted. This phenomenon of the transitions coincides with Fig. 11.
Table 1 shows the impact locations in the first nine matched atoms which are obtained by using the two atom matching pursuits and Table 2 shows the intervals of each two adjacent impacts. The mean impact interval of the NPAM is 111.5, from which the impact frequency of 107.6 is calculated. From the mean impact interval of the WPAM 112, the impact frequency of 107.1 is calculated. Both of the atom decompositions obtain the feature frequency closed to the theoretical fault frequency 107.4 Hz of the outer race. However, the NPAM decomposition has clear and intuitionistic interpretation i.e. each matched atom represents a whole impact and the fault identification feature is based on the frequency of the whole impact, while the WPAM decomposition is difficult to be interpreted.
Fig. 15The sorted impact locations in the first nine matched atoms
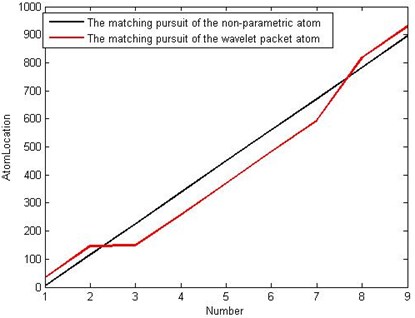
Table 1The impact locations in the first nine matched atoms
Number | 1 | 2 | 3 | 4 | 5 | 6 | 7 | 8 | 9 |
Non-parametric | 338 | 450 | 115 | 560 | 896 | 4 | 782 | 226 | 671 |
Wavelet packet | 482 | 370 | 930 | 34 | 594 | 146 | 258 | 149 | 818 |
Table 2The impact intervals in the first nine matched atoms
Number | 1 | 2 | 3 | 4 | 5 | 6 | 7 | 8 |
Non-parametric | 111 | 111 | 112 | 112 | 110 | 111 | 111 | 114 |
Wavelet packet | 112 | 3 | 109 | 112 | 112 | 112 | 224 | 112 |
4.2. Compared with the cyclo-stationary method
The idea of this paper is inspired by the cyclo-stationary method. The spectral correlation density (SCD) function is the important part in the theory of cyclo-stationary, which can demodulate the modulating signals and has been applied in the bearing fault identification [14-15]. In order to further examine the diagnosis effect of the NPAM to bearings, the authors compared it with the results of the spectral correlation density function.
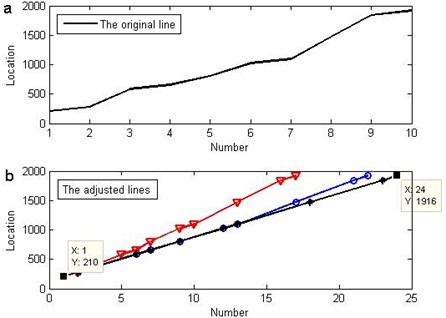
An inner race fault signal is considered as the test signal. The type of the bearing is similar with the previous out race fault bearing and the conditions of the experiment are same. The theoretical feature frequency of the inner race is 162.2 Hz. Fig. 16 is the waveform and the spectrum of the inner race fault signal. The impacts in this signal are different with the impacts in the outer race fault signal because the strength of the impacts of inner race fault is affected by the location of the defect which periodically changes with the inner race rotating. In order to select the most representative impacts as the bases, the authors select ten stronger impacts, which are maybe not consecutive, from a part of the inner race fault signal. The ten bases are shown in Fig. 17. The non-parametric dictionary is established according to the introduced method in Section 3. Then another part of the fault signal is matched with the dictionary. Fig. 18(a) shows the locations of the first ten matched atoms. Since the selected bases are not consecutive in the signal, the original line of the number-location is not straight line. In order to make the line visualized and test the effectiveness of the method of NPAM, the authors adjust the number according to the location of the matched atoms in the dictionary supposing the defect was on the outer race, inner race or ball respectively. In Fig. 18(b), the red triangle line is based on supposing the defect on the outer race, the black star line is based on the inner race and the blue circle line is based on the ball. The black line is straight but the red line and the blue line present a broken line, which indicates that the frequency of the impacts coincides with the feature frequency of the inner race. Thus the defect may be on the inner race. Calculating the fault frequency would verify the estimate. The impacts frequency can be obtained according to the slope of the straight line and the sampling frequency, i.e. Eq. (8):
The feature frequency is calculated as 161.8 Hz, whose error rate to the theoretical feature frequency 162.2 of the inner race fault is 0.25 %. The method of the NPAM obtains the result by comparing the similarity between impacts. The Fourier transform is not needed in the method. Therefore, the frequency resolution of the NPAM is not affected by the analyzed length of the signal.
Fig. 16The waveform and the spectrum of the inner race fault signal
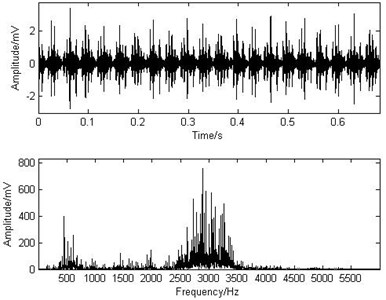
Fig. 17The ten bases from the inner race fault signal
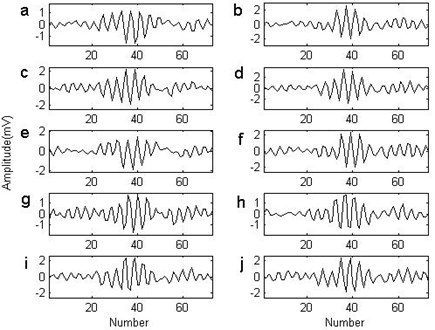
Fig. 18The sorted impact locations in the first ten matched atoms of the inner race fault signal
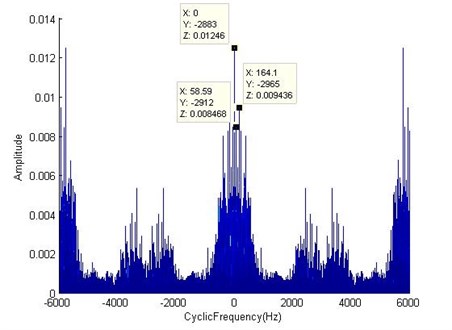
In this paper, the cyclic periodogram algorithm is used to calculate the SCD function. Fig. 19 is the projection of the SCD of the inner race fault signal on the Cylcic Frequency-Amplitude surface. In the figure, 164.1 is considered as the fault frequency, whose error rate to the theoretical feature frequency is 1.7 % which is greater than the error rate of the NPAM. In addition, in the low frequency part, there are times frequency of the axis rotation frequency 29.9 Hz and corresponding side frequencies beside the fault feature frequency. Therefore, there is a number of redundant information in SCD. But the axis rotation frequency is not obvious due to the low frequency resolution decided by the algorithm. In order to improve the resolution, the length of the signal must be extended, which will increase the calculating time greatly.
Fig. 19The projection of the spectral correlation density function of the inner race fault signal on the cyclic frequency-amplitude surface
5. Conclusions and prospects
The multi-scale of wavelet packet atom decomposition provides the adaptation to the non-stationary signal. However, the given regular waveforms of the wavelet packet atoms do not match the practical impacts well. So the WPAM breaks the integrity of the impact and decomposes the impact as multiple parts, which leads to the dense decomposing results and the ambiguity physical implication. The atoms of non-parametric are extracted from the analysis signal, which capture the impact features of the REB fault signal more perfectly than the parametric basis of the wavelet packet. Each atom of the non-parametric represents an intact impact. The fault signal is cyclo-stationary i.e. the impacts of the REB fault are cyclo-similar. The proximity of the atom decomposition makes the NPAM capture the main information while neglecting some irrelevant information to the processing purpose. Therefore, the NPAM can express the fault signal more sparsely and has a more explicit physical interpretation. Although the non-parametric method has the similarity with cyclo-stationary, it better emphasizes the main information of the fault. In addition, the frequency resolution of the non-parametric method is irrelevant to the length of the analyzed signal, which is different to SCD.
The experiment in this paper is based on a single shaft system and the fault signals are hardly contaminated by the other equipment vibration and environment noise. However, the bearings are usually not isolated in a working machine in real-world applications. There exist numerous sources of noise and vibrations – gear boxes, shafts, noise from environment. Thus, further research should focus on increasing the adaptation to the bearings work in complex equipment or in noisy environment full of external sources of vibrations. Authors expect to improve the adaptation of the method from three aspects.
1) Selecting the impact atoms correctly is a precondition of the diagnosis. Thus, the decision of the non-parametric atoms in complex signals needs further research by exploring the features of the impacts in the time and frequency domain.
2) The proper matching algorithm is beneficial to improve the rate of identification. The classical matching method only takes into account the energy accumulation and neglects the differences of the waveforms of the two matched signals. Improving the matched degree from the waveform view is also an intention of the authors.
3) Choosing the most effective information from the analysis results is important to the identification fault. Exploring suitable strategies to identify the serviceability of the information from the result of the NPAM is also our research subject.
In addition, the NPAM utilize the similarity between the different parts in the signal, which is similar to the principle of Wigner-Ville and cyclo-stationary. For the next step, authors intend to refer to the theory of the latter two to perfect the theory and the application of the NPAM.
References
-
Robert B. Randall, Jérôme Antoni Rolling element bearing diagnostics – a tutorial. Mechanical Systems and Signal Processing, Vol. 25, 2011, p. 485-520.
-
Peng Z. K., Chu F. L. Application of the wavelet transform in machine condition monitoring and fault diagnostics: a review with bibliography. Mechanical Systems and Signal Processing, Vol. 18, 2004, p. 199-221.
-
Staszewski W. J. Wavelet based compression and feature selection for vibration analysis. Journal of Sound and Vibration, Vol. 211, 1998, p. 735-760.
-
Paya B. A., Esat I. I., Badi M. N. M. Artificial neural network based fault diagnostics of rotating machinery using wavelet transforms as a preprocessor. Mechanical Systems and Signal Processing, Vol. 11, 1997, p. 751-765.
-
Ruqiang Yan, Robert X. Gao, Xuefeng Chen Wavelets for fault diagnosis of rotary machines: a review with applications. Signal Processing, Vol. 96, 2014, p. 1-15.
-
Scott Shaobing Chen, David L. Donoho, Michael A. Saunders atomic decomposition by basis pursuit. Society for Industrial and Applied Mathematics, Vol. 20, Issue 1, 1998, p. 33-6.
-
Fan Hong, Meng QingFeng, Zhang YouYun, et al. Matching pursuit based on non-parametric waveform estimation. Digital Signal Process, Vol. 19, 2009, p. 583-595.
-
Wang Guo-dong, Li Min, Yang Jian-hong, Xu Jin-wu Fault pattern recognition of rolling bearings based on characteristic waveform sparse matching. Journal of University of Science and Technology Beijing, Vol. 32, Issue 3, 2010, p. 390-396.
-
Qingbo He, Xiangxiang Wang Time-frequency manifold correlation matching for periodic fault identification in rotating machines. Journal of Sound and Vibration, Vol. 332, 2013, p. 2611-2626.
-
Antoniadis I., Glossiotis G. Cyclostationary analysis of rolling element bearing vibration signals. Journal of Sound and Vibration, Vol. 248, Issue 5, 2001, p. 829-845.
-
Kankar P. K., Satish C. Sharma, Harsha S. P. Fault diagnosis of rolling element bearing using cyclic autocorrelation and wavelet transform. Neurocomputing, Vol. 110, 2013, p. 9-17.
-
Mallat S. G., Zhang Z. F. Matching pursuit with time-frequency dictionaries. IEEE Trans Signal Process, Vol. 41, Issue 12, 1993, p. 3397-3415.
-
http://csegroups.case.edu/bearingdatacenter/pages/download-data-file.
-
Bi Guo Study on weak fault characteristics extraction of rolling element bearing and gear based on cyclostationarity. Shang Hai Jiao Tong University, 2007.
-
Zhou Fuchang Research on the fault diagnosis method of rolling element bearing based on cyclostationary signal processing. Shang Hai Jiao Tong University, 2006.
About this article

This work is supported by National Natural Science Foundation of China (Grant No. 51175316), the Specialized Research Fund for the Doctoral Program of Higher Education (Grant No. 20103108110006), the Fundamental Research for Key Programs from Shanghai Committee of Science (Grant No. 11jc1404100), and Shanghai Talent Development Fund (Grant No. 047).
