Abstract
The research object is based on the 1.5 MW large offshore wind turbine blade. A theoretical model for describing the geometrical non-linearity vibration behavior under the condition of fluid structure interaction (FSI) was established, the entity modeling of the wind turbine blade was achieved by using Pro/E, and the numerical simulation under unidirectional FSI (UFSI) and bidirectional FSI (BFSI) was carried out at different wind speeds by ANSYS and CFX softwares. The results indicate that the high pressure region and low pressure region respectively appear on the windward side and the leeward side of the blade, and the strength of wind pressure distribution under BFSI is lower than the one under UFSI. It is also found that the maximum brandish displacement locates in the blade tip and the maximum Mises stress occurs in the middle of blade at different wind speeds. Furthermore, the effect of BFSI on the wind blade vibration is much more obvious with the increase of wind speed. Finally, compared with the amplitude calculated by UFSI, the analytical method of BFSI truly reveals the aeroelastic characteristics of the blade under complex offshore wind conditions.
1. Introduction
With the development of human society and the advancement of technology, the reserve of fossil fuel on earth is diminishing, which causes global warming and energy crisis to aggravate. Wind energy has been paid more and more attention due to its feasibility, economy and pollution-free [1]. With the prosperity of offshore wind power business, power of the wind turbine has been increased from the original KW-class to MW-class [2]. As the core component of energy conversion, wind turbine blade accounts about 22 % costs for the entire wind turbine system. Therefore, the reliability of the blade structure directly determines safety performance and economic efficiency of the entire wind turbine.
Currently, most of the offshore large-scale wind turbine blades are modified from onshore ones, and the analysis of mechanical properties for the blade seems inadequate by using traditional experience design methods. It is found that some strong coupling effect exists between the offshore airflow and blades, which produces severe vibration, or even results in damaging of the whole wind turbine [3]. So, fluid structure interaction (FSI) analysis on the blade has to be taken into account in order to objectively describe the vibration characteristics of the wind turbine blades. Sternel et al. [4] developed the FSI iterative calculation with the aid of an implicit partitioned arbitrary Lagrangian-Eulerian approach, and optimized FSI solving process. Benra et al. [5] studied the pump impeller by using FSI simulation technology, and the results calculated by FSI were closer to the real work conditions of the pump wheel. Liu et al. [6] investigated the nonlinearly aeroelastic stability of wind turbine blade with bending-bending-twist coupling for composite thin-walled structure with pretwist angle. Jin et al. [7] analyzed the flutter problem of blowing at large incidence angles for the S809 wind turbine airfoil by the FSI method. Hu et al. [8] carried out the FSI analysis on the blade of a 5 MW, and numerical results showed the increase of attack angle was the main reason for the increase of torque. Hsu et al. [9] employed a nonmatching interface discretization approach to solve the interaction problem of wind and flexible blades, and found that the coupling FEM and isogeometric analysis in this manner were efficient and accurate for wind turbine FSI. Jeong et al. [10] performed the fluid-structure interaction analyses of wind turbine blades, and investigated torsional stiffness effects on the dynamic stability. Cai et al. [11] simulated extreme wind loads which were unidirectional coupled to the FE-model in CFD by considering a 50-year extreme gust. Thus it can be seen, the aero-elastic research with a focus on the effects of inflow wind speed on FSI of offshore large-scale wind turbine blades is still at the initial stage currently, and the comparative analysis on the flow field distribution and the structural dynamic characteristics under the action of UFSI and BFSI has not been reported so far. Therefore, the FSI analysis on the blade under different wind speeds is urgently needed to be carried out to further reveal the characteristics of the flow field distribution and the structural vibration.
In this work, the geometrical non-linearity vibration of 1.5 MW wind turbine blade was simulated under FSI by using ANSYS and CFX softwares, and average wind speeds at 12 m/s, 16 m/s and 20 m/s were selected as three different working conditions to carry out FSI analysis. In comparison with the numerical result by unidirectional FSI (UFSI), the dynamic characteristics of maximum brandish displacement and maximum Mises stress with bidirectional FSI (BFSI) considered was much closer to the one under real working conditions, which provides theoretical basis and technical guidance for design and optimization of the MW-class blade.
2. Theoretical models under FSI
2.1. Physical model
Fig. 1Coupling schematic diagram between three dimensional flow field and structure
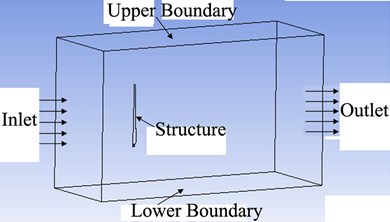
FSI problems are mainly divided into UFSI and BFSI. The mechanism of BFSI is that the fluid generates pressure on solid surface, and the pressure results in deformation, which conversely affects the fluid flow at the same time. In other words, the interaction includes both the force effect and the deformation occurrence. The mechanism of UFSI is that the fluid action force on structure at the fluid-solid interface can be obtained by the calculation of fluid domain, and then the deformation of solid is calculated by applying the fluid action force to structure. The FSI model of three dimensional flow field is shown in Fig. 1.
2.2. Control and discrete equations of fluid domain
The basic conservation laws of fluid domain include the mass conservation law, the momentum conservation law and the energy conservation law. The general form of governing equations is established to analyze the above equations conveniently and solve them by the same calculation program. Denote as the general variable which represents the directions of velocity components , , , and then one can get [12]:
where , and are respectively the air density, the generalized diffusion coefficient and the generalized source term. Eq. (1) is solved for (continuity equation), (momentum equation, and stand for velocity components in each direction, and the indexes of and range from 1 to 3), and ( two-equation turbulence model). and are determined according to .
After the discretization of the governing Eq. (1) is conducted by using finite volume method, integral operation is done in the control volume and at time foot according to the computational grid. By further applying Gauss divergence theorem, the general form of the discrete equations can be obtained as [12]:
where is adjacent nodes, , is a coefficient, and can be got from the source term.
Iterative solution of Eq. (2) is carried out to obtain the velocity field which satisfies the continuity equation, so that one can calculate the pressure distribution on the surface of blade.
2.3. Nonlinear dynamic equations
The motion equations of the blade with geometric nonlinear taken into account can be written as [13]:
where is stress tensor, is displacement vector, is material density, and is body force vector. The constitutive equation and the relation between displacement and strain for the geometrical nonlinear elastic body are respectively expressed as:
where and respectively stand for shear modulus and Lame coefficients, and is unit tensor.
Generally, the discrete differential motion equation of structure domain is written as [14]:
where and represent mass matrix and damping matrix respectively, , calculated by data transfer of dynamic mesh is column vector of the wind load related to the wind pressure distribution of the blade at time . In addition, the nonlinear term of the equation can be expressed as:
in which, is the tangential stiffness matrix computed by nodal displacements at time .
For Eq. (6), the displacement, the velocity and the acceleration at corresponding to the blade dynamic response are solved by Newmark method [15] and Newton-Raphson iterative method.
3. Solid modeling and mesh generation
3.1. Solid modeling and parameter settings
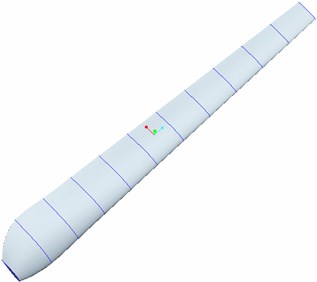
In the process of finite element analysis by using ANSYS, the establishment of solid model is the key link which directly affects the accuracy and the reliability of the numerical results. In this study, the design parameters for 1.5 MW wind turbine are listed in Table 1. The simplified solid model of the blade was set up by Pro/E, as shown in Fig. 2.
Fig. 2The solid model of 1.5 MW wind turbine blade
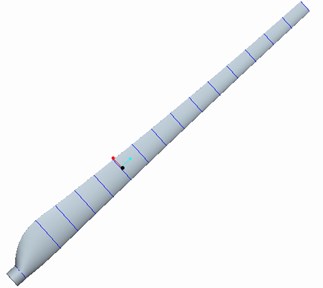
Table 1Main parameters of wind rotor
Diameter | Blade number | Rated wind speed | Blade section airfoil |
86 m | 3 | 7.93 m/s | NACA44 |
Currently, the glass-fiber reinforce plastic (GRP) is mainly applied to the commercial wind turbine blade, which has the characteristics of light weight, high strength and good rigidity etc. Specific material parameters are shown in Table 2 [16].
Table 2Material parameters of GRP
Elastic modulus (Pa) | Poisson’s ratio | Shear modulus (Pa) | Density (kg/m3) |
1.76×10¹⁰ | 0.17 | 2.08×10⁹ | 1.70×10³ |
3.2. Finite element mesh generation
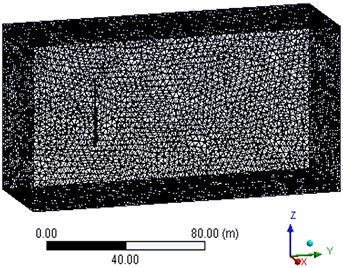
The basis of differential equation discretization and numerical solution is model meshing, which directly affects the accuracy of the subsequent numerical calculation. The overall mesh generation including fluid domain and structure domain can be seen in Fig. 3.
Fig. 3The meshing generation of fluid field and structure field
4. Numerical calculation procedure
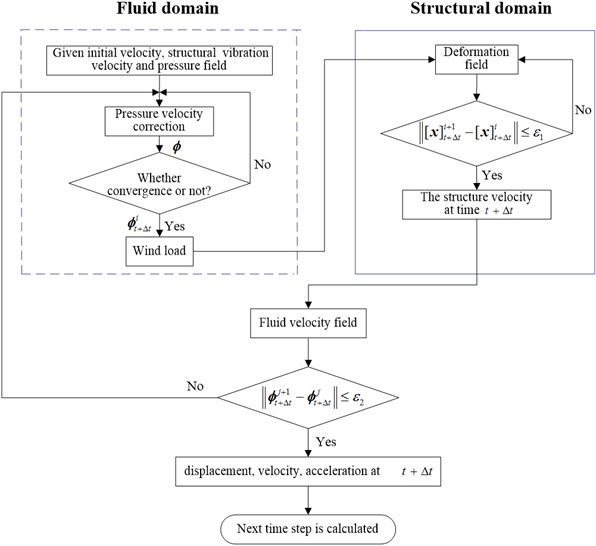
The pressure velocity correction, geometric nonlinearity and FSI, which respectively exist in fluid domain, structural domain and dynamic grid domain, are all solved by Newton-Raphson iterative algorithm, and the specific calculation procedure is plotted in Fig. 4.
Fig. 4The solving diagram by BFSI algorithm
5. Numerical results and discussion
5.1. Model verification
To demonstrate the reliability of the theory, solid modeling and finite element simulation method, the experimental model in reference [17] is chosen to carry out the verification calculation. 3D model and numerical results are respectively shown in Fig. 5 and Fig. 6.
Fig. 5The verification model of wind blade
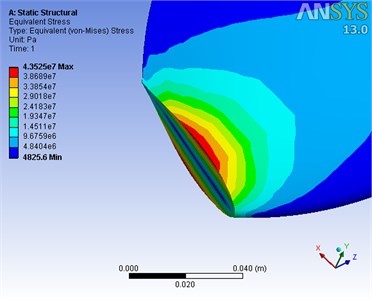
When the numerical program in this work is degenerated into the same blade structure as reference [17] in which the maximum Mises stress at the blade root is 42.70 MPa, the simulated result is 43.53 MPa. The relative error is only 1.94 %, which confirms the validities of our model.
Fig. 6The contour of maximum Mises stress
5.2. Grid-independent verification
With the increase of mesh density and grid unit of fluid domain and structural domain, the maximum brandish displacement listed in Table 3 is convergent. In this study, on the premise that the precision and the speed of calculation are ensured, grid unit numbers in fluid domain and structural domain are respectively set as 430,847 and 9656 in the end.
Table 3Grid independent verification of fluid field and structure field
Domain | Number of grid cells | Maximum displacement (m) | Relative error |
Structural domain | 9656 | 1.109 | – |
12320 | 1.105 | 0.36 % | |
16020 | 1.103 | 0.18 % | |
Fluid domain | 430847 | 1.109 | – |
454282 | 1.107 | 0.18 % | |
483263 | 1.108 | 0.09 % |
5.3. Wind pressure distribution on the blade
In the process of displacement response calculation under BFSI, it is found that the maximum displacement occurs at the time of 1.3 s. Therefore, the wind pressure distribution, displacement and stress distributions in this study all occurred at this moment.
Under condition that wind turbine stops and that inflow wind speed is 20 m/s with FSI considered, the pressure distributions in cross section of the blade middle part at 1.3 s are plotted in Fig. 7. It can be seen that pressure distribution away from the blade structure is almost not affected by the blade vibration. Moreover, the flow field near the blade is more complicated, high region and low region of wind pressure respectively appears at windward side and leeward side, while high pressure region moves downstream to low pressure region gradually. After comparing Fig. 7(a) and (b), it is found that the influence region of the pressure distribution under UFSI is much larger, and the maximum value of wind pressure under UFSI is higher than the one under BFSI.
Fig. 7Wind pressure distribution in cross section of the blade middle part at 1.3 s
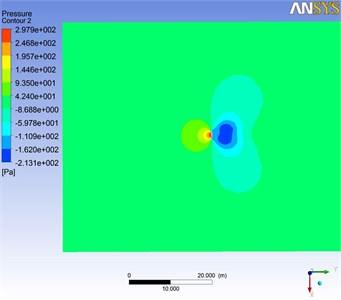
a) BFSI
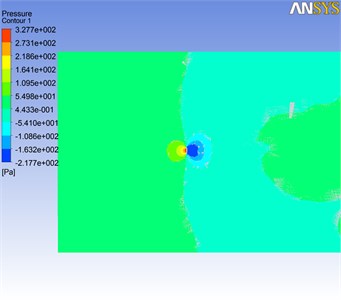
b) UFSI
5.4. The influence of FSI on displacement and stress
According to reference [12], the vibration of wind turbine blade under stationary state is mainly concentrated in brandish direction. Therefore, the vibration analysis in the direction of brandish is carried out in this work, and we take 20 m/s average wind speed as an example.
5.4.1. Response analysis on displacement and stress
The response curves of maximum displacement and maximum Mises stress under UFSI and BFSI are compared, as shown in Fig. 8(a) and (b). As it can be seen, the variations of displacement and stress over time identically present attenuated trend. In addition, the peak values of displacement and stress under BFSI are both less than the ones obtained from UFSI, which results from the additional damping generated by BFSI.
Fig. 8Compared curves under BFSI and UFSI
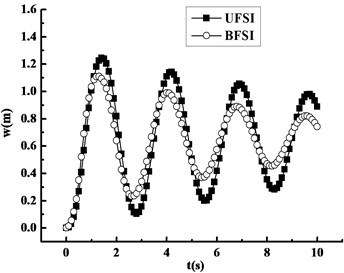
a) Displacement response
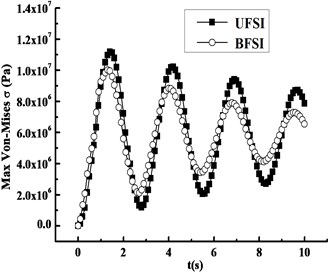
b) Mises stress response
5.4.2. Distribution of displacement and stress
Fig. 9 displays the displacement distribution of the blade at 1.3 s under UFSI and BFSI. It is easy to find that maximum displacement both occurs at the blade tip. By comparison, the peak value of maximum displacement under BFSI is lower.
Fig. 10 exhibits variation curves of maximum displacement of the blade airfoil along span direction under the same conditions as used in Fig. 9. It can be found from Fig. 10 that two curves both increase non-linearly along span direction, and the displacement difference between BFSI and UFSI is becoming greater from the root to the tip.
Fig. 9Displacement distribution of the blade at 1.3 s
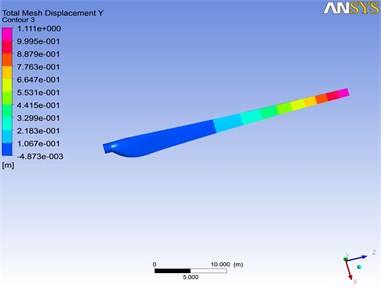
a) BFSI
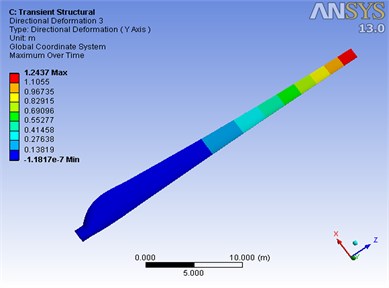
b) UFSI
Fig. 10Variation curves of displacement along the span direction under FSI at 1.3 s
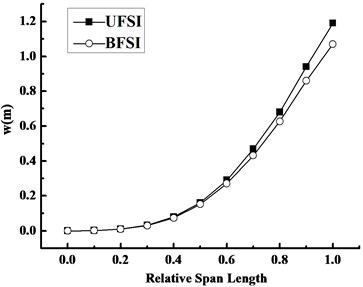
Fig. 11Mises stress distribution of the blade at 1.3 s
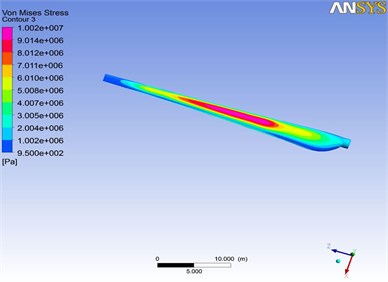
a) BFSI
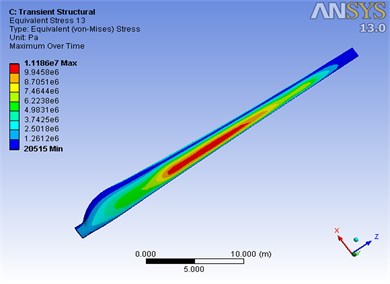
b) UFSI
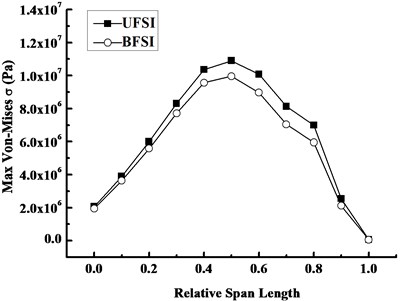
Fig. 11 and 12 give the distributions of Mises stress and the variation curves of maximum Mises stress along the span direction under the same conditions as Fig. 9 and 10 respectively. From Fig. 11, the maximum Mises stress under UFSI is relatively bigger, while the maximum Mises stress concentrates in the middle region of the blade rather than the root, and the reason is that section modulus in bending of the blade varies from root to tip. From Fig. 12, the Mises stress along span direction almost shows logarithmic normal distribution trends, namely, the stress is diminishing respectively from the peak point of the blade middle region to both sides.
Fig. 12Variation curves of Mises stress along the span direction under FSI at 1.3 s
6. The influence of inflow wind speed on displacement and stress
6.1. Comparative analysis of displacement and stress response
Fig. 13 plots the response curves of displacement and stress of the blade under FSI at inflow wind speeds 12 m/s, 16 m/s and 20 m/s. As can be seen from Fig. 13(a), the maximum displacement of the blade increases with inflow wind speed, the displacement difference between three different kinds of inflow wind speeds are 0.01 m, 0.05 m and 0.13 m respectively, and the increased amplitude which show rapidly non-linear increasing trend, which implies that the effect of BFSI on the blade displacement increases obviously with inflow wind speed. It is found from Fig. 13(b) that maximum Mises stress also increases with inflow wind speed, and the difference between three conditions are respectively 0.11 MPa, 0.47 MPa and 1.17 MPa, which indicates that BFSI also has a significant impact on the blade stress response with the increase of inflow wind speed.
Fig. 13Compared response curves under FSI at different wind speeds
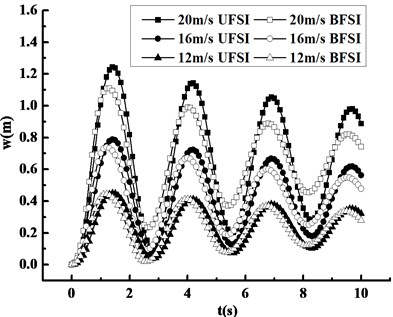
a) Displacement
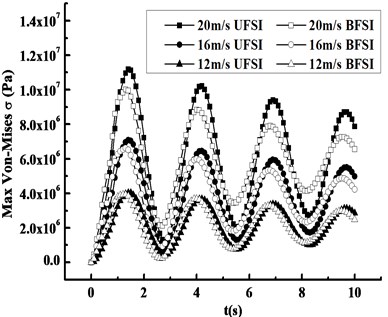
b) Mises stress
6.2. Distribution of displacement and stress
Fig. 14 reveals the distribution laws of maximum displacement and maximum Mises stress along the span direction of the blade under FSI at different inflow wind speeds. It can be observed from Fig. 14(a) that the maximum displacement rises non-linearly from the root to the tip, the effect of FSI on the displacement increases with inflow wind speed. Fig. 14(b) shows that Mises stress presents the non-linearly decreasing trend and the FSI effect is gradually reducing from the middle region to both sides of the blade, and that the effect of BFSI on stress response is also significant with increasing inflow wind speed.
Fig. 14Compared curves along the span direction at 1.3 s under FSI at different wind speeds
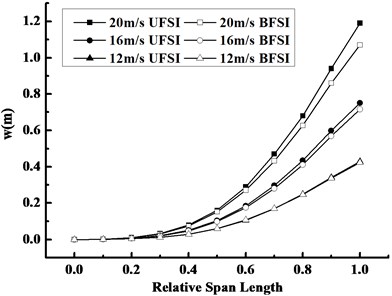
a) Maximum displacement
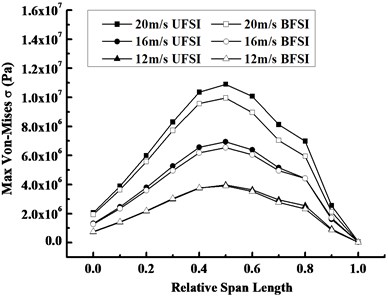
b) Maximum Mises stress
7. Conclusion
In this study, under condition that a simplified solid model of large-scale offshore wind turbine blade is selected as a research object, the effects of UFSI and BFSI on vibration characteristics of the blade at different inflow wind speeds were explored. The following conclusions can be summarized.
1) Pressure gradient appears in the surrounding area of the blade, the wind pressure at the windward side is greater than the one at leeward side, and the pressure under BFSI is weaker than that under UFSI.
2) The maximum and minimum displacement occur in the tip and the root of the blade respectively, and maximum Mises stress focuses on the blade middle region. Furthermore, the maximum displacement shows a non-linearly increasing trend along the span direction, while the maximum Mises stress almost submits to a normal distribution.
3) The peak values of displacement and stress under BFSI are both less than the ones under UFSI. FSI effect for the maximum displacement along the blade span direction at a certain time increases with the distance from the root, while FSI effect for the corresponding maximum Mises stress respectively decreases from the middle region to both sides of the blade.
4) The influences of BFSI effect on displacement and stress of the blade increase significantly with inflow wind speed, which indicates that the BFSI effect should be taken into account to faithfully simulate the vibration characteristics of the actual running blade.
References
-
Joselin H. G. M., Iniyan S., Sreevalsan E., et al. A review of wind energy technologies. Renewable and Sustainable Energy Reviews, Vol. 11, Issue 1, 2007, p. 1117-1145.
-
Lv J., Liu Z., Zhao L., et al. Large-scale wind turbine aeroelastic responses analysis. Acta Aerodynamica Sinica, Vol. 30, Issue 1, 2012, p. 125-129.
-
Xing J., Zhou S., Cui E., et al. A survey on the fluid-solid interaction mechanics. Advances in Mechanics, Vol. 27, Issue 1, 1997, p. 19-38.
-
Sternel D. C., Schfer M., Heck M., et al. Efficiency and accuracy of fluid-structure interaction simulations using an implicit partitioned approach. Computational Mechanics, Vol. 43, Issue 1, 2008, p. 103-113.
-
Benra F. K., Dohmen H. J. Comparison of pump impeller orbit curves obtained by measurement and FSI simulation. ASME Pressure Vessels and Piping Division Conference, 2007.
-
Liu T., Ren Y., Yang X. Nonlinear aeroelastic stability analysis of wind turbine blade with bending-bending-twist coupling. Journal of Fluids and Structures, Vol. 42, Issue 6, 2013, p. 488-502.
-
Jin Y., Yuan X. Aeroelastic analysis on an airfoil's flutter and flutter control technique of blowing. Acta Energiae Solaris Sinica, Vol. 23, Issue 4, 2002, p. 403-407.
-
Hu D., Zhang Z., Sun K., et al. Computational analysis of wind turbine blades based on fluid-structure interaction. Proceeding of the CSEE, Vol. 33, Issue 17, 2013, p. 98-104.
-
Hsu M. C., Bazilevs Y. Fluid-structure interaction modeling of wind turbines: simulating the full machine. Computational Mechanics, Vol. 50, Issue 6, 2012, p. 821-833.
-
Jeong M. S., Lee I., Yoo S. J., et al. Torsional stiffness effects on the dynamic stability of a horizontal axis wind turbine blade. Energies, Vol. 6, Issue 4, 2013, p. 2242-2261.
-
Cai X., Pan P., Zhu J., et al. The analysis of the aerodynamic character and structural response of large-scale wind turbine blades. Energies, Vol. 6, Issue 7, 2013, p. 3134-3148.
-
Zhang J., Pan L., Hu D., et al. Influence of offshore average wind speeds on dynamic responses of the wind turbine blade. East China Electric Power, Vol. 39, Issue 4, 2011, p. 636-639.
-
Bai X. Magnetoelasticity, thermal-magneto-elasticity and their applications. Advances in Mechanics, Vol. 26, Issue 3, 1996, p. 390-406.
-
Zhang J., Yan Z., Dai Y. Thermo-elastic coupling vibration of geometric nonlinearity conductive thin plate in magnetic field. Journal of Mechanical Strength, Vol. 33, Issue 2, 2011, p. 159-164.
-
Newmark N. M. A method of computation for structural dynamics. Journal of the Engineering Mechanics Division, ASCE, Vol. 85, 1959, p. 67-94.
-
Zong N. Design and FE analysis of the blade for small horizontal axis wind turbine. Shanghai, Shanghai Jiaotong University, 2009.
-
Cao R., Liu D. Experimental investigation on static structrual characteristics of a horizontal axis wind turbine. Acta Energiae Solaris Sinica, Vol. 22, Issue 4, 2001, p. 436-439.
About this article

This work was supported in part by Program of Shanghai Subject Chief Scientist (B type) (13XD1425200); Foundation of Shanghai Committee of Science and Technology, China (11160500600, 11dz2281700); Innovation Program of Shanghai Municipal Education Commission (14ZZ154, 13ZZ130); Key Fund of Shanghai Science Technology Committee (13160501000); National Natural Science Foundation of China (50706025, 51201097); the “085 Program” Project Foundation of Shanghai University of Electric Power; National Scholarship Foundation of China.
