Abstract
The hydraulic pump is the heart of the hydraulic system. Therefore, monitoring the condition of such a pump in real time is crucial to the reliability of the entire system. In this study, a method that assesses the performance of and diagnoses faults in hydraulic pumps is proposed. This method is based on wavelet packet transform (WPT) and a self-organizing mapping (SOM) neural network. First, WPT is used to decomposes the vibration signal into components. The energy of each component is then extracted and normalized to form feature vectors. Second, the SOM neural network, which is trained by normal data only, maps feature vectors into minimum quantization errors, which are then normalized into confidence values (CVs). Performance is assessed by tracking CV trends. Finally, SOM, which is trained by both normal and faulty samples, classifies faults into different groups when they occur. These groups represent the various fault modes of the hydraulic pump. In addition, Taguchi method is employed to reduce the number of redundant features and extract the principal components, thereby ensuring the effectiveness of the approach. A case study based on the vibration dataset of the rig of a test plunger pump is conducted to demonstrate the ability of the proposed method to assess the performance of a hydraulic pump and suitably diagnose faults.
1. Introduction
The hydraulic pump is a crucial component in hydraulic systems. Its performance directly determines hydraulic pressure, which reflects the status of the entire system. Unexpected pump faults often cause enormous losses. However, a condition monitoring-based process can provide a pre-warning so that repairs or replacements can be made at the earliest or most convenient time with minimum loss in productivity.
The faults of hydraulic pumps are generally accompanied by changes in vibration signal. Thus, vibration diagnosis is important in this field and is also the foremost topic of interest for researchers. Considering the complexity of the hydraulic pump and the working conditions, data-driven methods are typically applied to online fault diagnosis. Currently, several data-driven methods exist for condition monitoring, such as principal component, discriminant, and cluster analyses, as well as artificial neural networks.
The self-organizing mapping (SOM) network is a data-driven neural network proposed by Kohonen [1]. It is broadly used in diagnostic applications dealing with data classification. The minimum quantization error (MQE) calculated by SOM is a suitable method to assess performance. The advantages of SOM are as follows: (1) its training process has a favorable recognition rate with respect to unknown signals, and (2) the topology of its network is self-adaptive; thus, it is self-stabilizing and immune to interference.
However, sending the original vibration signal of a hydraulic pump into SOM requires complicated computation and usually generates unsatisfactory results. Therefore, a feature vector that carries substantive signal characteristics is needed in this approach. Traditional signal processing techniques, including time- and frequency-domain analyses, are based on the assumption that processing signals are stationary and linear. However, the vibration signals of abnormal hydraulic pumps are both nonlinear and non-stationary. An effective way to process such signals is by wavelet packet transform (WPT), which was introduced by Coifman [2]. WPT repeatedly decomposes a signal into successive low- and high-frequency components by a recursive filter-decimation operation. After decomposition, the energy of each component is extracted and normalized to form feature vectors, which represent the status of the hydraulic pump.
To ensure the effectiveness of the approach and eliminate the well-known “garbage in, garbage out” problem, the Taguchi method is employed to determine the key features from the initial feature set and eliminate unsuitable features.
This study mainly aims to propose a method to assess the performance of and diagnose faults in hydraulic pumps using WPT and SOM. In this method, WPT and energy extraction are combined to extract the features. SOM-based MQE, which is optimized using the Taguchi method, is then employed to calculate confidence value (CV). CV indicates the performance of the hydraulic pump. Finally, SOM, which is trained by both normal and faulty samples, is employed to classify faults into different fault modes when they occur.
This paper is organized as follows: Section 2 introduces WPT, SOM, the Taguchi method, and the proposed method for fault diagnosis and performance assessment. Section 3 describes the case studies conducted to validate the method. Section 4 presents the conclusions and several directions for future research.
2. Methodology
2.1. Signal processing by WPT
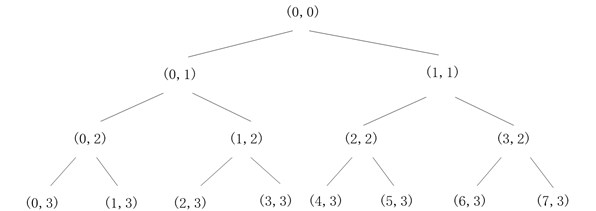
WPT, which was first introduced by Coifman, Meyer, and Wickerhauser [3], is considered as a generalization of the wavelet transform. Both the low- and high-frequency components of any waveform are decomposed by a recursive filter-decimation operation [4]. Wavelet packets consist of a family of usual wavelet functions that are linearly combined. The binary tree of a time-domain signal up to the third level of wavelet packet decomposition (WPD) is shown in Fig. 1.
Fig. 1Tree structure of WPT
After the th level is decomposed, the original signal can be constructed by the sum of components as:
where is the component signal of the wavelet packet that can be expressed by a linear combination of wavelet packet functions as:
where , , and are integers defined as the modulation, scale, and translation parameter, respectively. Wavelet packet coefficients can be obtained from:
The wavelet packet function is defined as:
where and . The first is called the mother wavelet function, and several of these are available for selection. In this study, wavelets are defined by the relations as:
where and are quadrature mirror filters associated with the scaling and the mother wavelet functions [5].
The WPD tree can be considered as the output of a filter that is tuned to a particular basis function. On top of the WPD tree, where the decomposition level is low, the time domain can be effectively resolved, but frequency domain resolution is poor. At the bottom of the WPD tree, where decomposition level is relatively high, the frequency domain is effectively resolved, but the resolution in the time domain is poor. Effective resolution in the frequency domain is more important than that in the time domain for health monitoring; thus, a high WPD level is often required to detect minor signal changes [6].
2.2. Feature extraction by energy extraction
In this study, features are obtained by energy extraction. Each component is processed with:
where is the energy of each component, which is normalized as follows:
where is the normalized feature vector that carries signal information. It can be used to classify signals and assess performance status.
2.3. Fault classification and MQE calculation by SOM network
SOM, which is a competition neural network, typically forms a two-dimensional regular lattice, and each neuron is represented by a dimensional weight vector. The map neurons are connected to adjacent neurons by a neighborhood relation, which indicates the map topology [7].
During training with vector as an example, the distances between this vector and all of the SOM weight vectors are computed by using distance measure. The neuron with a weight vector closest to is called the best matching unit (BMU) [8]. The weight vector of BMU, as well as that of its neighbors, is enhanced by the learning rule:
where is the weight vector, is the learning rate at a range of , and is the neighborhood function determined by the distance between BMU and its neighbor.
Fig. 2Trained SOM topology
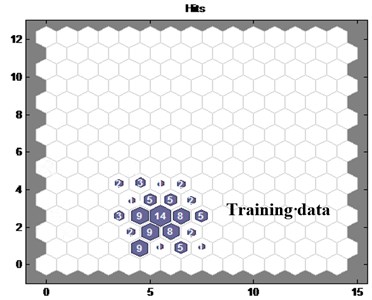
After training, the neurons are grouped in clusters based on structural distance to form a new kind of topology. When a test vector is inputted, it is compared with the weight vectors of all of the map units in the SOM. The topological structure of SOM determines the fault mode. Therefore, fault classification can be accomplished by compare the topological structure of each status.
Then, depending on the extent to which current data deviates from the trained data, a quantitative assessment index can be obtained by calculating the [7]. value is determined by:
where is the input data vector and is the BMU weight vector. In this study, datasets of the normal hydraulic pump are used as training data. Therefore, reflects the extent to which current pump status deviates from the normal data. By following the trends, performance of hydraulic pumps can be quantified and visualized. According to SOM principles, a normal pump gains features similar to those of the trained dataset; therefore, normal samples gather around the normal cluster that should have a minimum value. values increase while the faulty pumps differ from the trained data.
2.4. Feature optimization by Taguchi method
The Taguchi method is an important tool for robust design, which optimizes the product and process conditions that are minimally sensitive to the causes of variation. Meanwhile, the method can also be applied to the development of factorial experiments and the analysis of their associated outcomes.
To date, the Taguchi method is a well-recognized approach to analyze interaction effects while ranking and screening various controllable factors. This method can solve different problems involving continuous, discrete, and qualitative design variables [9]. The method is applied to optimize the feature vector, starting with the normal and faulty feature vectors. is calculated using the formula presented in the previous section. The Taguchi method then creates a standard orthogonal array (OA) that depends on the number of required factors and levels.
Table 1Orthogonal array
Level | Factor | |||||||
1 | 2 | 3 | 4 | 5 | 6 | 7 | 8 | |
1 | 1 | 1 | 1 | 1 | 1 | 1 | 1 | 1 |
2 | 1 | 1 | 1 | 1 | 1 | 2 | 2 | 2 |
3 | 1 | 1 | 2 | 2 | 2 | 1 | 1 | 1 |
4 | 1 | 2 | 1 | 2 | 2 | 1 | 2 | 2 |
5 | 1 | 2 | 2 | 1 | 2 | 2 | 1 | 2 |
6 | 1 | 2 | 2 | 2 | 1 | 2 | 2 | 1 |
7 | 2 | 1 | 2 | 2 | 1 | 1 | 2 | 2 |
8 | 2 | 1 | 2 | 1 | 2 | 2 | 2 | 1 |
9 | 2 | 1 | 1 | 2 | 2 | 2 | 1 | 2 |
The OA easily determines optimum experimental conditions. In the OA, features have two levels: Level-1 represents the presence of a feature, and level-2 denotes its absence. In this study, nine MQEs are calculated given a combination of the features dictated by the OA. The larger-the-better signal-to-noise ratio (SNR) is calculated as follows:
where is the SNR for the th OA run and is the sample size of each abnormality. Average SNRs at levels 1 and 2 of each feature are obtained, and the gain is determined as follows [10]:
According to principle, features with positive gain are selected for the performance assessment, and the rest are discarded.
2.5. Performance assessment by
In this approach, , which was proposed by Qiu et al. [11], is an index that evaluates performance status. It can be formulated as:
where is the under the monitoring data when SOM is in operation. is the scale parameter determined by the under the normal state and the predetermined .
The CVs of hydraulic pumps under normal conditions are expected to be close to 1. This value is defined as and is mainly determined by experts in the field. typically ranges from 0.99 to 0.90 and can be denoted as follows [12]:
where is the average of all MQEs under normal conditions. Thus, can be calculated as follows:
In this study, the signals of normal hydraulic pumps with features similar to those of the trained dataset gather around the normal cluster, which should have a minimum value relative to those of other faulty states. Signal features increasingly vary from those of the trained data with pump operation. Therefore, their MQEs increase. is inversely proportional to ; thus, normal pumps have higher CVs than faulty ones.
2.6. Flow of the proposed method
The proposed method assesses performance and diagnoses faults as summarized in Fig. 3.
Fig. 3Flow of the proposed method
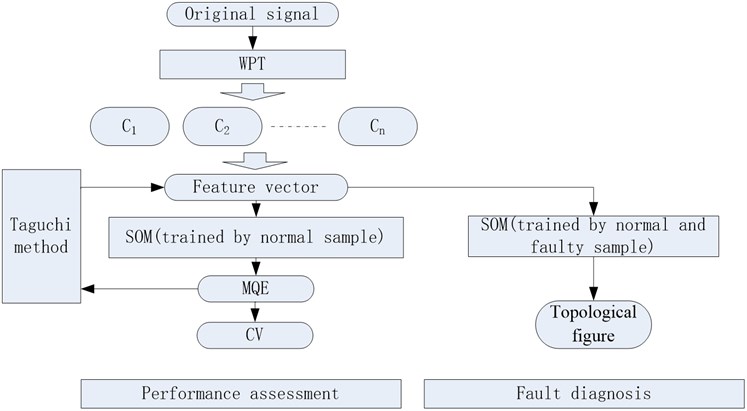
The procedure can be divided into three parts:
1) Feature extraction. WPT decomposes the vibration signal into components. The energy of components is extracted to form feature vectors.
2) Performance assessment. Feature vectors from normal hydraulic pumps train the SOM, and the Taguchi method optimizes the feature vectors. The optimized vector then retrains SOM. The trained SOM calculates the MQEs of current pumps, which are normalized into CVs. The performance of the hydraulic pump can be assessed by tracking the CV trend.
3) Fault classification. SOM is trained by both normal and faulty samples, which form a topological structure. With the trained SOM, the fault modes of the current pumps can be classified based on their positions in the topological figure.
3. Experimental verification
3.1. Experiment setup
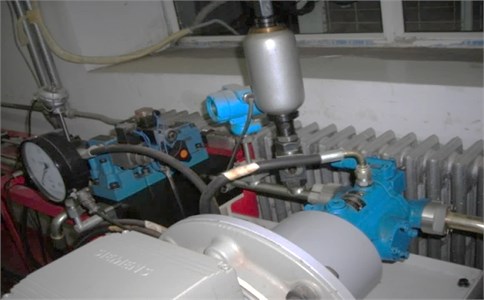
In this study, a plunger pump was tested and analyzed to verify the presented method. The vibration signal was acquired from the end face of the plunger pump at a stabilized motor speed of 528 r/min and a sampling rate of 1000 Hz, as depicted in Fig. 4. Two commonly occurring faults in the plunger pump, namely, swash plate and rotor wear, were set. Therefore, three status of hydraulic pump is researched in this experiment, which is normal, swash plate and rotor wear.
Fig. 4Test plunger pump rig
3.2. Experiment results and discussion
3.2.1. Feature extraction
The original vibration signal of a hydraulic pump is displayed in Fig. 5. In this study, WPT is employed to decompose the vibration signal into components.
Fig. 5Sample of WPT results for hydraulic pump signal
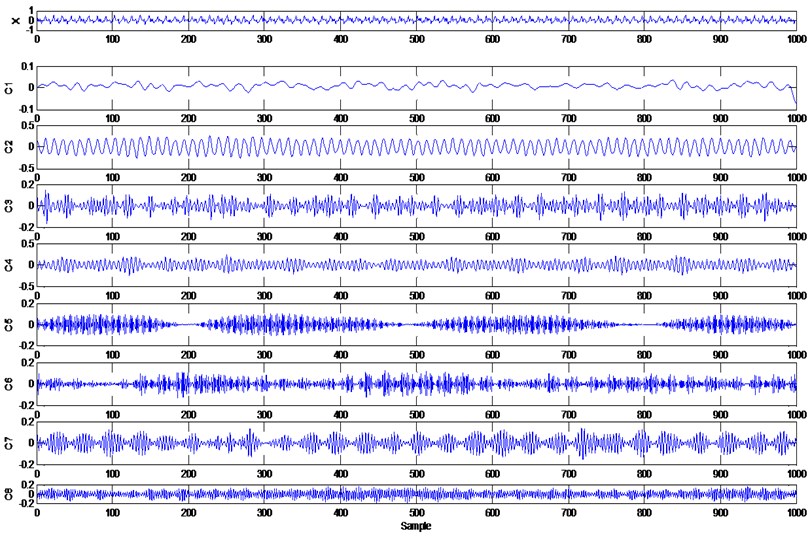
Then, the energy of components is extracted and normalized to form feature vectors. Vibration signals from three status are used to extract feature vectors, take the vectors extracted from normal hydraulic pump for example, Table 2 shows 10 vectors generated from the normal ones.
Table 2Feature vectors
No. | ||||||||
1 | 0.3393 | 2.5319 | 0.8789 | 1.6472 | 1.0084 | 0.8393 | 0.8632 | 1.2736 |
2 | 0.3478 | 2.5081 | 0.8403 | 1.6266 | 0.8638 | 1.0336 | 0.8560 | 1.2394 |
3 | 0.3441 | 2.5544 | 0.8547 | 1.6328 | 1.0271 | 0.8498 | 0.8260 | 1.2399 |
4 | 0.2998 | 2.5475 | 0.8050 | 1.6295 | 0.8677 | 0.9842 | 0.8373 | 1.2632 |
5 | 0.2746 | 2.5443 | 0.8867 | 1.6499 | 0.9887 | 0.8384 | 0.8893 | 1.2999 |
6 | 0.3646 | 2.5096 | 0.8442 | 1.5906 | 0.8659 | 0.9996 | 0.8187 | 1.3576 |
7 | 0.3171 | 2.5314 | 0.8504 | 1.5450 | 0.9480 | 0.9248 | 0.8309 | 1.4178 |
8 | 0.3420 | 2.4554 | 0.7721 | 1.5553 | 0.9031 | 0.9380 | 0.7934 | 1.4749 |
9 | 0.3630 | 2.5726 | 0.8263 | 1.5265 | 0.9263 | 0.9830 | 0.7235 | 1.4745 |
10 | 0.3230 | 2.4265 | 0.7846 | 1.5236 | 0.9257 | 0.9358 | 0.8623 | 1.2754 |
3.2.2. SOM-based MQE calculation using the Taguchi method
SOM is trained by the vector from normal samples. With the trained SOM, the MQE of each vector can be calculated. The Taguchi method is then used to optimize the feature vectors. The results are presented in Table 3.
Table 3Results of Taguchi method
Factor | |||||||||
1 | 2 | 3 | 4 | 5 | 6 | 7 | 8 | ||
1 | 1 | 1 | 1 | 1 | 1 | 1 | 1 | 1 | 0.54 |
2 | 1 | 1 | 1 | 1 | 1 | 2 | 2 | 2 | –3.36 |
3 | 1 | 1 | 2 | 2 | 2 | 1 | 1 | 1 | 0.02 |
4 | 1 | 2 | 1 | 2 | 2 | 1 | 2 | 2 | –4.52 |
5 | 1 | 2 | 2 | 1 | 2 | 2 | 1 | 2 | –0.27 |
6 | 1 | 2 | 2 | 2 | 1 | 2 | 2 | 1 | –3.29 |
7 | 2 | 1 | 2 | 2 | 1 | 1 | 2 | 2 | –0.15 |
8 | 2 | 1 | 2 | 1 | 2 | 2 | 2 | 1 | –2.39 |
9 | 2 | 1 | 1 | 2 | 2 | 2 | 1 | 2 | –3.39 |
–1.81 | –1.45 | –2.68 | –1.37 | –1.56 | –1.03 | –0.78 | –1.28 | ||
–1.97 | –2.69 | –1.22 | –2.27 | –2.11 | –2.54 | –2.74 | –2.34 | ||
Gain | 0.16 | 1.24 | –1.47 | 0.90 | 0.55 | 1.51 | 1.97 | 1.06 | |
According to the rules of the Taguchi method, factor-3 with negative gain should be discarded. The remaining factors constitute final vectors.
3.2.3. Performance assessment
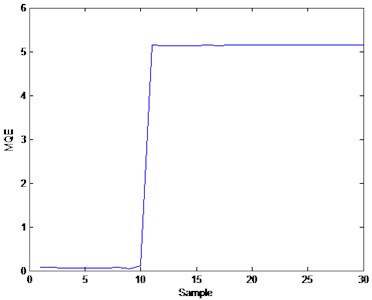
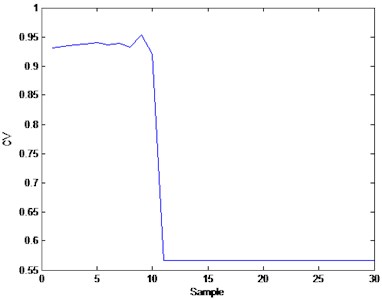
In this experiment, 30 samples from normal and two faulty pump modes are assessed. The SOM network is trained by the normal samples. Given the trained SOM, the MQEs and CVs of the test samples are calculated. The trends of and are exhibited in Fig. 6.
The blue curve in the figure shows the trend. In this approach, normal pumps, with similar signals to the training data, should get a higher , which represents well-performance. With the operation of pumps, the performance get worse as well, when the of pumps under a given threshold value, fault occurs. The threshold value is determined by former engineering experience and fault tolerance of the pump.
In this experiment, the first 10 samples from the normal pumps show high CVs above 0.9, indicating that the hydraulic pumps are in good health. With the operation of pumps, the CVs of the last 20 samples from faulty pumps are lower and below the threshold value of 0.6, representing that faults are likely to occur in this pump, and maintenance work should be taken to the pump. correspondingly presents hydraulic pump performance and distinctly proves that this approach to performance assessment is feasible.
Fig. 6MQE and CV of hydraulic pump
a)
b)
3.2.4. Fault classification
After faults occur, the trained SOM is used to classify faults into two modes. In this study, 300 samples from normal and two faulty pump modes train SOM. The topological structure is shown in Fig. 7.
Fig. 7Topological structure of trained SOM
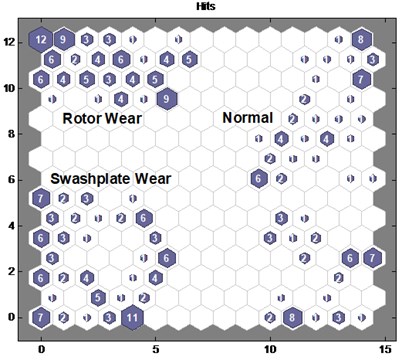
Three state modes of the hydraulic pump gather in separate areas in the topological structure. With the trained SOM, datasets from three pump modes are employed to diagnose faults. The result is depicted in Fig. 8.
As the figure indicates, the samples from three modes are severally mapped in the topological structure that represents normal, rotor wear, and swash plate wear. The fault modes of the hydraulic pumps can be directly determined by the topological figure. The result reveals the effectiveness of the approach.
Fig. 8Results of fault classification: a) normal, b) rotor wear, and c) swash plate wear
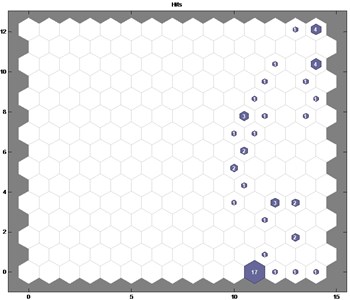
a)
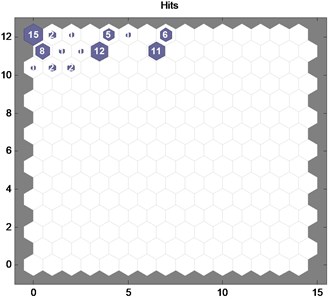
b)
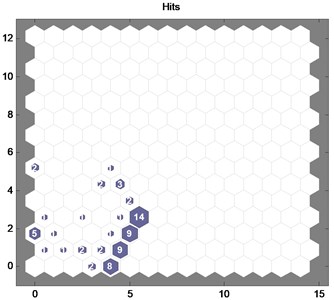
c)
4. Conclusions
This study proposes an approach to assess the performance of hydraulic pumps and diagnose faults in them. WPT effectively processes nonlinear and non-stationary vibration signals. An SOM-based MQE chart classifies modes, and MQE is normalized into . By tracking trends, the performance of the hydraulic pump is assessed. Meanwhile, the topological figure of the SOM, which is trained by both normal and faulty samples, classifies the faults into different fault modes. The Taguchi method enhances the accuracy of the result and optimizes the feature vector to reduce computations, which is meaningful in real-time assessment.
However, the method must be validated further in wider applications in future work. The process of determining threshold CVs is also an issue because it can reflect health conditions accurately.
References
-
Kohonen T., Hynnine T., Simula O., Visa A., Kangas J. Engineering applications of the self-organizing map. Proceedings of the IEEE, Vol. 84, 1996, p. 1358-1384.
-
Peng X. L., Hao H., Li Z. X. Application of wavelet packet transform in subsea pipeline bedding condition assessment. Engineering Structures, Vol. 39, 2012, p. 50-65.
-
Chen H. X., Patrick S. K. Chua, Lim G. H. Fault degradation assessment of water hydraulic motor by impulse vibration signal with wavelet packet analysis and Kolmogorov-Smirnov Test. Mechanical Systems and Signal Processing, Vol. 22, 2008, p. 1670-1684.
-
Walid G. Morsia, El-Hawaryb M. E. Novel power quality indices based on wavelet packet transform for non-stationary sinusoidal and non-sinusoidal disturbances. Electric Power Systems Research, Vol. 80, 2010, p. 753-759.
-
Coifman R. R., Wickerhauser M. V. Entropy-based algorithms for best basis selection. IEEE Trans Inform Theory, Vol. 38, 1992, p. 713-718.
-
Hassen Keskesa, Ahmed Brahama, Zied Lachirib Broken rotor bar diagnosis in induction machines through stationary wavelet packet transform and multiclass wavelet SVM. Electric Power Systems Research, Vol. 97, 2013, p. 151-157.
-
Gang Cheng, Yu-long Cheng, Li-hua Shen Gear fault identification based on Hilbert-Huang transform and SOM neural network. Measurement, Vol. 46, Issue 3, 2013, p. 1137-1146.
-
Jian-Bo Yu, Shijin Wang Wavelet analysis of sensor signals for tool condition monitoring: A review and some new results. Computers & Industrial Engineering, Vol. 57, 2009, p. 1300-1312.
-
Taguchi G., Jugulum R. The Mahalanobis-Taguchi strategy: a pattern technology system. Wiley, New York, 2002.
-
Zhan-Yi Wu, Homg-Wen Wu, Cheng-Han Hung Applying Taguchi method to combustion characteristics and optimal factors determination in diesel/biodiesel engines with port-injecting LPG. Fuel, Vol. 117, Part A, 2014, p. 8-14.
-
Qiu H., Lee J., Lin J., Yu G. Robust performance degradation assessment methods for enhanced rolling element bearing prognostics. Advanced Engineering Informatics, Vol. 17, 2003, p. 127-140.
-
Qiu H., Lee J., Lin J. Wavelet filter-based weak signature detection method and its application on roller bearing prognostics. Journal of Sound and Vibration, Vol. 289, 2006, p. 1066-1090.
About this article

This research was supported by the National Natural Science Foundation of China (Grant Nos. 61074083, 50705005 and 51105019), as well as the Technology Foundation Program of National Defense (Grant No. Z132013B002).
