Abstract
In this study, a method based on impact tests was designed in order to determine undamaged and broken glasses. By means of using an impact pendulum, impact was applied on glasses and the generated sounds were transferred to the computer using a microphone. The sound signals were decomposed into 128 components by using Discrete Wavelet Packet Transform (DWPT) at the seventh level. 16 of the 128 components that characterized the properties of undamaged and broken glasses were chosen as inputs for the designed Artificial Neural Network (ANN). The designed ANN model was tested with real-time simulation, and it was observed that the proposed method could determine undamaged and broken glasses with high precision. This method, which is based on analyzing the sounds generated after the impact, can detect defects that the conventional visual methods can detect; however, it can also be used as supplement to these methods.
1. Introduction
People have been using glass in different areas since ancient times. Nowadays, glass is used in many areas such as home, workplaces, factories, schools, vehicles, electronics, etc. The glass materials have become an easily accessible and cheap item with product development, mass production and glass automation. As in all fields, the production quality of kitchenware such as bottles, glasses, plates are very important. The glass materials which are designed in various shapes and colors require a large number of defect controls. The defects in glass materials can occur during production, as well as human errors during shipping and handling [1, 2].
Defects that are frequently encountered in glass materials are impurities in glass, areas with low contrast and different colors, various cracks and chips, bubbles in glass, holes and dirt on surface, and edge defects [3, 4]. In order to determine these defects, besides Ultrasonic Vibration Resonance (RUV) that can detect defects in real time [4], digital signal digital processing methods, which are based on visual instruments, are used. The pictures of glass are decomposed with 2D wavelet decomposition, and the sub pictures are obtained. The defects can be determined by using artificial neural network or fuzzy logic with the sub pictures [5]. Another method is determining structural defects by using RGB to color space conversion and segmentation algorithm [3]. One other method is the determination of the glass defect characteristics using Binary Feature Histogram (BFH) and then using AdaBoost method for classifying the defects [2].
In this study, an analysis method based on audio in order to determine structural defects in glass is proposed. Instead of visual equipment, cheaper instruments such as an impact pendulum and microphone were used. Since the microphone could be directly connected to the PC, no other data acquisition card was necessary.
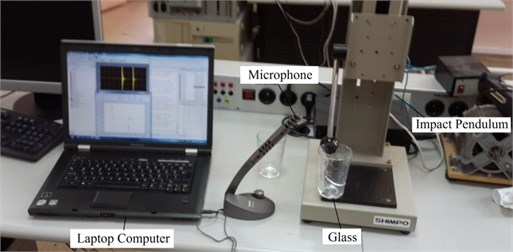
In order to differentiate the broken and undamaged glasses, impact sounds were made with an impact pendulum, and the impact sounds were transferred to the computer with a microphone. The impact pendulum was used in order to obtain the same force for every test [6-10]. The angle of the pendulum was kept small, so the pendulum was able to hit the glass once without oscillating (Fig. 1).
Fig. 1Data acquisition system
2. Discrete wavelet packet transform (DWPT)
DWPT is a signal analysis method which is commonly used in many branches of science [11, 12]. DWPT provides for separating a sampled signal into its lower resolution components. This process is done by cascaded analysis filter banks and dawn sampling processes. Depending on the chosen main wavelet, the signal of length is filtered through high pass filter () and low pass filter () to obtain the first level analysis of the discrete signal [12, 13]:
and filtered again through high pass and low pass filters, thus are decomposed into a higher number of components at second level [12, 13]:
Similar procedure is applied to the second level components to obtain third level components [12, 13]:
with denoting the number of levels, every level has components. So at the seventh level the number of components will be 128 [12, 13]:
3. Artificial neural network (ANN)
Artificial Neutral Networks are computer systems developed for the purpose of realize automatically capabilities such as creating new information via learning which is a feature of human brain, forming and discovering new information without getting any assistance.
Nowadays, ANN has been getting used prevalently in almost all research fields for prediction purposes. Especially for the non-linear time series, more superior success of ANN in comparison with traditional methods have an important factor so as for this method to be preferred. The most used type of ANN is the multi-layer back-propagating neural networks [10, 14-18].
On the entry level, the relation between the output () and input () of the neuron is given in the equation below:
The neural inputs on the output level can be obtained by using Eq. (7) [10, 14]:
in this equation ; and denotes the connection weight between the neurons, and denotes the number of neurons at the input and output. Neuron outputs can be found by using the equation below [10, 14]:
, denotes the threshold of the neuron, denotes the activation function. The relations for the input and output to neurons within the hidden layers are shown in Eq. (7)-(8).
During the training of the algorithm, the algorithm attempts to minimize the error function between the input and output data sets by updating the interneural connection weight at every iteration. is used in the equation below in order to show the total error for the square of every pattern [10, 14]:
, is the target output neuron, is the output of neuron output:
here, is total error, is the number of input-output patterns, at the training set [10, 14].
4. Proposed method
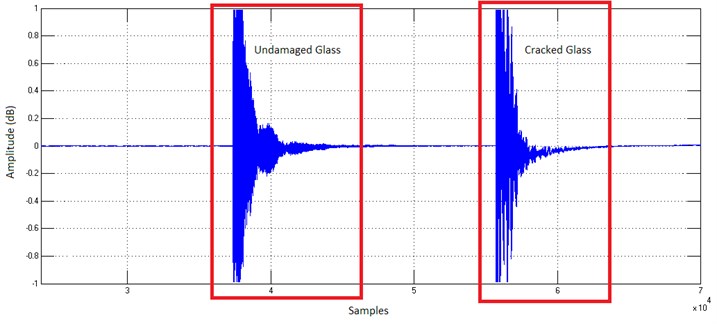
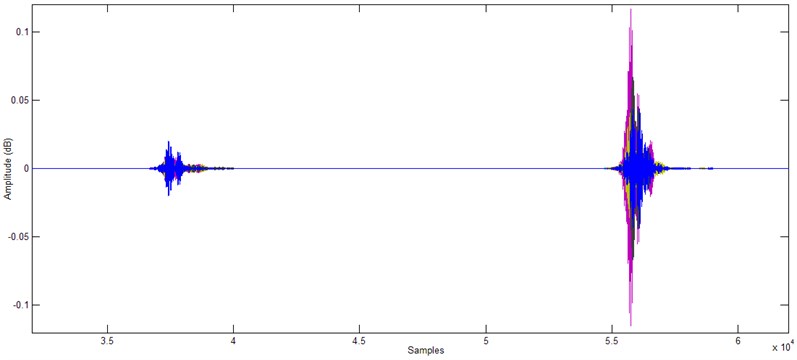
Initially, the system shown in Fig. 1 is used to record the impact sound. The data regarding the undamaged and broken glasses are shown in Fig. 2. The sampling frequency of the microphone was 44100 Hz, and has recorded and amount of 88200 data in two seconds.
Fig. 2Noise plot of undamaged and cracked glass
For feature extraction regarding the undamaged and broken glasses, the seventh level discrete wavelet package transform was applied using the wavelet filter banks in the Matlab Simulink environment. db20 was preferred, which is commonly used for the harmonic analysis (Fig. 3). At the analysis of every level, the data number will decrease by half due to down sampling, therefore the frequency of the signal will be halved. Thus, 128 components with different frequency ranges were obtained (Table 1). When Table 1 is analyzed, it can be seen that the component with the highest frequency is with a frequency range of 21877.73-22050 Hz, and the component with the lowest frequency is with the frequency range of 0-172.27 Hz [12, 19, 20].
Table 1Wavelet packet decompositions and frequency range
Decomposition | Frequency range (Hz) | Center frequency (Hz) |
21877.73-22050 | 21963.87 | |
21705.47-21877.73 | 21791.60 | |
21533.20-21705.47 | 21619.34 | |
21360.94-21533.20 | 21447.07 | |
… | … | … |
516.80-689.06 | 602.93 | |
344.53-516.80 | 430.66 | |
172.27-344.53 | 258.40 | |
0-172.27 | 86.13 |
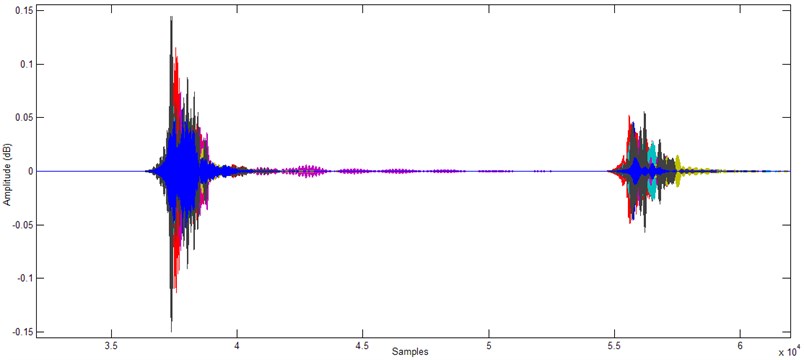
In order to make the classification more successful, it would be more appropriate to use 16 components for both undamaged and broken glass, rather than use all of the 128 components. , , ,, , , and were chosen as the inputs of ANN model for detection of the undamaged glass determination because they take high values for the undamaged glass and low values for the cracked glass. , , , , , , , were chosen as the inputs of ANN model for detection of the cracked glass determination because they take high values for the cracked glass and low values for the undamaged glass (Fig. 4 and 5).
Fig. 3DWPT transformation by using wavelet filter bank
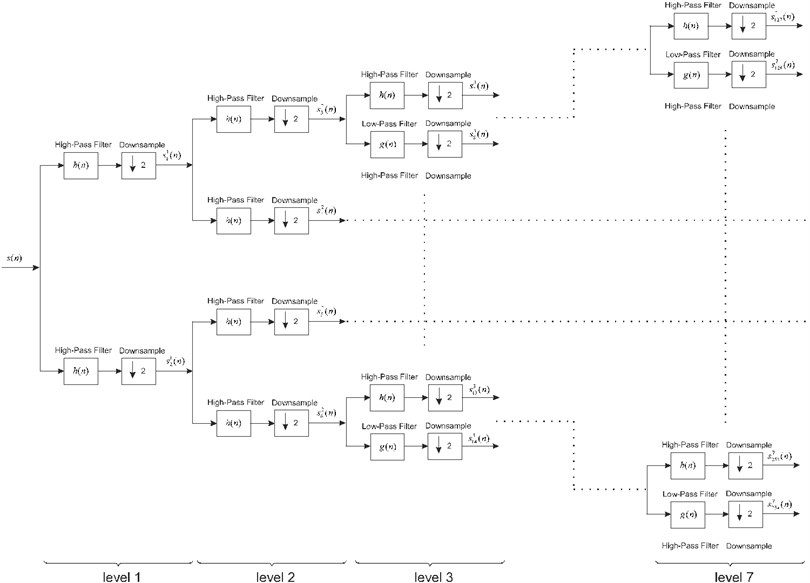
Fig. 4Chosen DWPT decompositions for undamaged glass
In order to increase the classification performance, signal enveloping for the 16 components is needed. To achieve this, discrete Hilbert transformation was applied in order to convert the signals into analytical expressions. The imaginary part of the analytical signal is the 90° shifted version of the real part. The analytical expression of the periodical and symmetrical ’s expression ’s are expressed with the equation below:
with Eq (12), the absolute value of is taken, and thus it realizes enveloping. This makes the negative values positive [21-24].
Fig. 5Chosen DWPT decompositions for cracked glass
To have smooth changing, the chosen components are filtered with a second level butter low pass filter whose cut off frequency is of 0.0029 π·rd/sample so inputs are ready for ANN (Fig. 6) [24].
Fig. 6Inputs of ANN for training
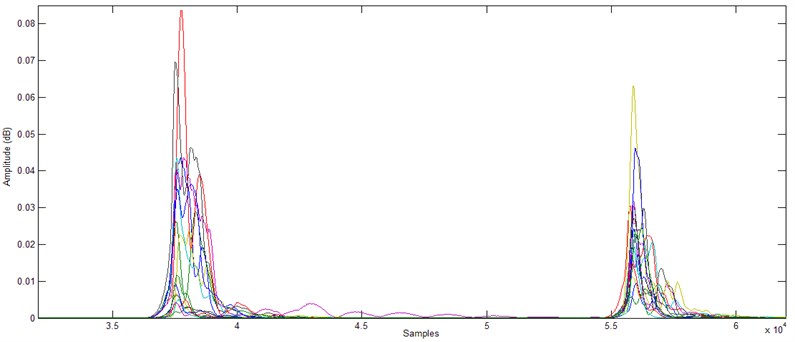
Fig. 7Target of ANN for training
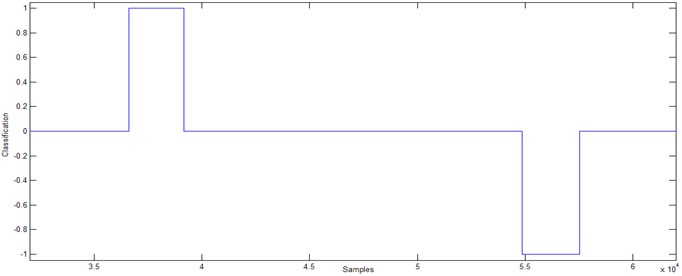
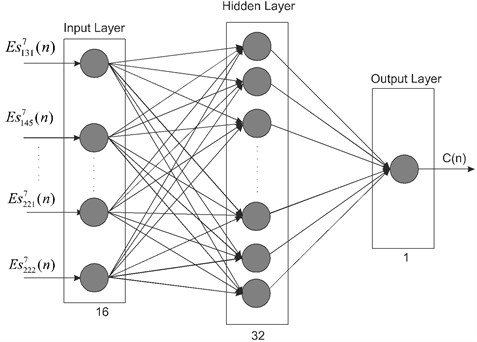
The designed ANN has 16 inputs and neurons on the input layer (Fig. 7). According to test results it was decided that 32 neurons should be used on the hidden layer. There is one neuron on the output layer. For all layers, hyperbolic tangent sigmoid function was chosen as the activation function. Target had three values for ANN training. These values are 0, 1 and –1. 0 means “no glass is present”, 1 denotes “undamaged glass”, and –1 denotes “broken glass”. In order to avoid confusion in the intermediate values, target was chosen as a negative value for damaged glass (Fig. 7). The proposed ANN model is shown in Fig. 8.
Fig. 8Proposed ANN model
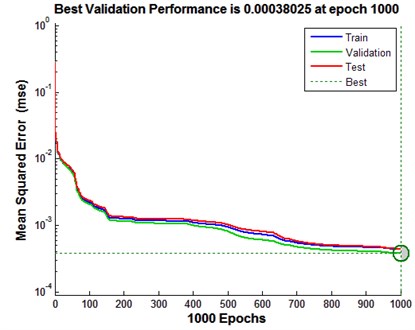
The ANN model was trained according to Levenberg-Marquardt (back propagation) method. 70 % of the samples (61740 samples) were used in training, 15 % (13230) was used in validation, and the remaining 15 % was used for testing. The best validation performance was obtained at epoch 1000 (Fig. 9).
Fig. 9Performances of proposed ANN model
After the training step, when the linear regression between the ANN output and target was analyzed, a quite good correlation was seen between the target and output (Fig. 10).
Table 2Results of ANN model
Samples | MSE | RMSE | R | |
Training | 61740 | 4.36318×10⁻⁴ | 0.02088 | 0.9963220 |
Validation | 13230 | 3.80252×10⁻⁴ | 0.01950 | 0.996710 |
Testing | 13230 | 4.41117×10⁻⁴ | 0.02100 | 0.9962768 |
Table 2 shows that the ANN model was trained successfully. The Mean Squared Error is (MSE) 4.36318×10⁻⁴. After training, the validation and test regressions showed that ANN classified defects of the glasses very successfully. The all regression is 99.627 %. The target and ANN model output can be seen on Fig. 11.
Fig. 10Regression analysis results
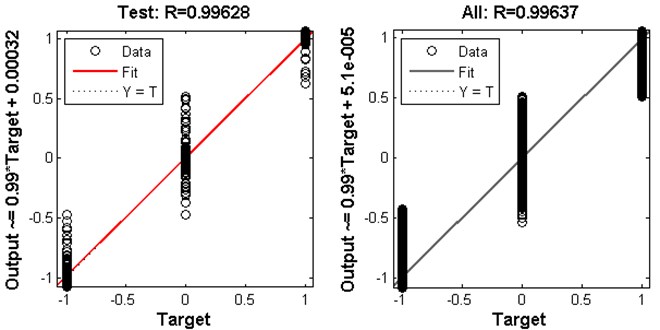
Fig. 11Target and output of ANN model
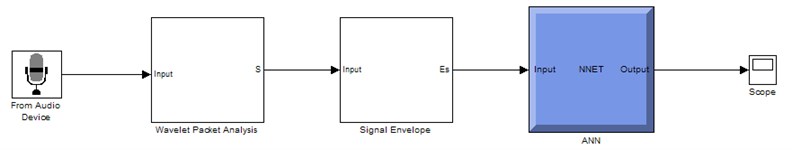
The next step is testing the system with real time simulation. The prepared simulink circuit is given in Fig. 12.
Fig. 12Simulink circuit for application
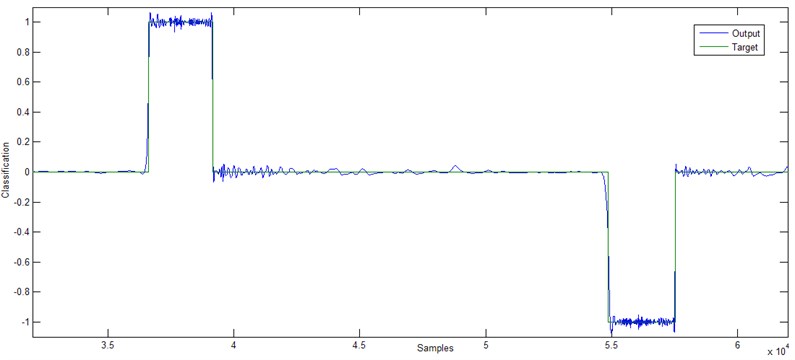
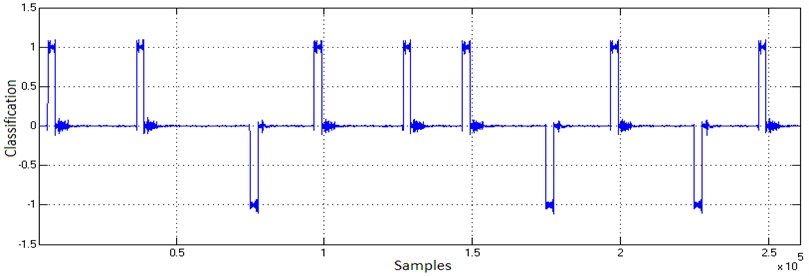
With consecutive tests, 7 undamaged and 3 broken glasses were placed at random, and the system was tested (Fig. 13).
Fig. 13Real time simulation results
5. Conclusions
In this study, a method based on discrete wavelet packet analysis and artificial neural network was proposed in order to determine structural defects in glasses. An impact pendulum that would not harm the glass but would create sufficient sound was used. The sounds were directly transferred to the computer with a microphone in 44100 Hz sampling frequency. In order to make the system real time operating, feature extraction was realized by using filter banks for discrete wavelet transform. As the sound signal had a high frequency, the analysis was realized at the seventh level. Using all of the 128 components with 172.27 Hz range deteriorates the ANN performance, besides that, slows the system in the real time operation. For this reason, 16 components were chosen for ANN training. Any damage that would occur in the integrity of the glass will cause various changes on different frequency bands. For used glasses, the central frequencies of undamaged glasses’ components are higher than that of broken glasses’ components. This provided a good opportunity for feature extraction.
After feature extraction, a simple ANN model was established for classification. The model has 16 inputs and 1 output, and it was trained to have three different output values. “No glass” is denoted with 0, “Undamaged glass” is shown with 1, and “Damaged Glass” is expressed with –1. The proposed ANN model has a high accuracy of 96.627 %, which shows how well the aimed classification is done. Aside from the small defects on the edge and color changes, which do not affect the integrity of glass, all other defects can be detected with this method. Using an ordinary microphone without the use of a DAQ card, establishing a relatively cheap defect-detection system will be possible. The biggest disadvantage of this method is the requirement to design an ANN model for each defect type. However, if only damaged and undamaged glasses are classified, using one ANN model is sufficient.
This technique which is proposed as a new method can be used for research and analysis. In particular, it can be used for quality control in glass products fabrication line. Although there are different methods of analysis for glass materials, this study provides simpler and cheaper solutions in quality control aspect. Following studies of the method may also be applied to different materials for defect detection.
References
-
Nishu Agrawal S. Glass defect detection techniques using digital image processing – a review. IP Multimedia Communications, A special Issue from IJCA, 2011, p. 65-67.
-
Zhao J., Kong Q. J., Zhao X., Liu J., Liu Y. A method for detection and classification of glass defects in low resolution images. Sixth International Conference on Image and Graphics (ICIG), 2011, p. 642-647.
-
Nishu Agrawal S. Automated inspection of defects in glass by proper color space selection and segmentation technique of digital image processing. International Journal Computer Technology & Applications (IJCTA), Vol. 3, Issue 3, 2012, p. 1058-1063.
-
Tiwana S. S., Kaur S. Study on various glass defect using glass edge detection methods. International Journal of Computer Science and Mobil Computing (IJCSMC), Vol. 2, Issue 5, 2013, p. 82-85.
-
Liu H. G., Chen Y. P., Peng X. Q., Xie J. M. A classification method of glass defect based on multiresolution and information fusion. The International Journal of Advanced Manufacturing Technology, Vol. 56, Issue 9, 2011, p. 1079-1090.
-
Akinci T. C. The defect detection in ceramic materials based on time-frequency analysis by using the method of impulse noise. Archieves on Accoustic, Vol. 36, Issue 1, 2011, p. 77-85.
-
Bevivino J. The path from the simple pendulum to chaos. Dynamics at the Horsetooth, Vol. 1, Issue 1, 2009, p. 1-24.
-
Ranachowski P., Rejmund F. Mechanical-acoustic examination of ceramic material. Proceedings of the 7th Int. Conference, Cottbus, 2008, p. 11-13.
-
Kater H. An account of experiments for determining the length of the pendulum vibrating seconds in the latitude of London. Phil. Trans. R. Soc., Retrived, Vol. 104, Issue 33, 2008, p. 11-25.
-
Akinci T. C., Nogay H. S., Yilmaz O. Application of artificial neural networks for defect detection in ceramic materials. Archives of Acoustics, Vol. 37, Issue 3, 2012, p. 279-286.
-
Janicek F., Mucha M., Ostrozlik M. A new protection relay based on a fault transient analysis using wavelet transform. Journal of Electrical Engineering, Vol. 58, Issue 5, 2007, p. 271-278.
-
Gokmen G. Wavelet based reference current calculation method for active compensation systems. Electronics and Electrical Engineering, Vol. 108, Issue 2, 2011, p. 61-66.
-
Deng H., Ling H. Fast solution of electromagnetic integral equations using adaptive wavelet packet transform. IEEE Transaction on Antennas and Propagation, Vol. 47, Issue 4, 1999, p. 674-682.
-
Akinci T. C., Nogay H. S., Gokmen G. Determination of optimum operation cases in electric arc welding machine using neural network. Journal of Mechanical Science and Technology, Vol. 25, Issue 4, 2011, p. 1003-1010.
-
Svozil D., Kvasnicka V., Pospichal J. Introduction to multilayer feed forward neural networks. Chemometrics and Intelligent Laboratory Systems, Vol. 39, Issue 1, 1997, p. 43-62.
-
Yoon J. M., He D., Qui B. Full ceramic bearing fault diagnosis using LAMSTAR neural network. 2013 IEEE Conference on Prognostics and Health Management (PHM), 2013, p. 1-9.
-
Elkhodary S. M., Nasrat L. S. The use of experimental and artificial neural network technique to estimate age against surface leakage current for non-ceramic insulators. Large Engineering Systems Conference on Power Engineering, 2006, p. 84-89.
-
Zhang J., Mingdong Y., Chonghai X., Zhenyu J. Prediction of the mechanical properties of ceramic die material with artificial neural network and genetic algorithm. IEEE International Conference on Intelligent Computing and Intelligent Systems, 2009, p. 603-607.
-
Saleh S. A., Rahman M. A new transient model for three-phase power transformers using a wavelet filter bank. IEEE Transaction on Power Delivery, Vol. 20, Issue 2, 2005, p. 1409-416.
-
Robertson C. D., Camps O. I., Mayer J. S., Gish W. B. Wavelets and electromagnetic power system transients. IEEE Transaction on Power Delivery, Vo1. 1, Issue 2, 1996, p. 1050-1058.
-
Sabin W. E. Discrete-signal analysis and design. Wiley-Interscience, A John Wiley & Sons, Inc., New Jersey, 2007.
-
Ouergli A. Hilbert transform from wavelet analysis to extract the envelope of an atmospheric mode: examples. Journal of Atmosferic and Oceanic Technology, Vol. 19, Issue 7, 2002, p. 1082-1086.
-
Kohli S. S., Makwana N., Mishra N., Sagar B. Hilbert transform based adaptive ECG r-peak detection technique. International Journal of Electrical and Computer Engineering, Vol. 2, Issue 5, 2012, p. 639-643.
-
The Mathworks, Inc. Signal processing toolbox. User’s guide, R2013b, 2013, p. 31-355.
About this article

